
Manuscript accepted on :10-03-2023
Published online on: 17-03-2023
Plagiarism Check: Yes
Reviewed by: Dr. Francisco Solano , Dr. Moumita Hazra
Second Review by: Dr. Hany Akeel
Final Approval by: Dr. Eman Refaat Youness
Ahmed Yaseen1, Mowafaq Mohammed Ghareeb2 , Dania F. Alsaffar1, Toh Seok Ming1 and Amirah Mohd Gazzali1*
1Department of Pharmaceutical Technology, School of Pharmaceutical Sciences, Universiti Sains Malaysia, 11800 Penang, Malaysia.
2Department of Pharmaceutics, College of Pharmacy, Baghdad University, Iraq.
Corresponding Author E-mail: amirahmg@usm.my
DOI : https://dx.doi.org/10.13005/bpj/2639
Abstract
Fusidic acid (FA) is a well-known pharmaceutical antibiotic used to treat dermal infections. This experiment aimed for developing a standardized HPLC protocol to determine the accurate concentration of fusidic acid in both non-ionic and cationic nano-emulsion based gels. For this purpose, a simple, precise, accurate approach was developed. A column with reversed-phase C18 (250 mm x 4.6 mm ID x 5 m) was utilized for the separation process. The main constituents of the HPLC mobile phase were composed of water: acetonitrile (1: 4); adjusted at pH 3.3. The flow rate was 1.0 mL/minute. The optimized wavelength was selected at 235 nm. This approach achieved strong linearity for alcoholic solutions of FA when loaded at a serial concentration ranging from 12.5 to 400 µg/ml. Furthermore, the approach showed good stability and achieved full recovery and an effective separation for FA from the abovementioned formulation. Besides, the protocol validation revealed good robustness at a temperature range of 23 to 27, pH 3.0 to 3.5, detection wavelength 230 to 240 nm, flow rate 0.8 and 1.2 and mobile phase contents of (78:22 to 82:18 acetonitrile/ water). The limit of Detection was obtained 1.33 µg/ml and limit of Quantification was 4.04 µg/ml for FA that uploaded through mentioned formulations. All the validation parameters were within the acceptance criteria, as per ICH , US Pharmacopeia requirements. Overall, an affordable and reproducible method could be achieved for the detection and quantification of fusidic acid within the nano-emulsion based gels formulas.
Keywords
Cationic Nanoemulsion; Fusidic Acid; Nanoemulsion; Nanoemulsion Gel
Download this article as:| Copy the following to cite this article: Yaseen A, Ghareeb M. M, Alsaffar D. F, Ming T. S, Gazzali A. M. Development and Validation of HPLC Method For the Detection of Fusidic Acid Loaded in Non-ionic and Cationic Nanoemulsion-Based Gels. Biomed Pharmacol J 2023;16(1). |
| Copy the following to cite this URL: Yaseen A, Ghareeb M. M, Alsaffar D. F, Ming T. S, Gazzali A. M. Development and Validation of HPLC Method For the Detection of Fusidic Acid Loaded in Non-ionic and Cationic Nanoemulsion-Based Gels. Biomed Pharmacol J 2023;16(1). Available from: https://bit.ly/3JLYxKG |
Introduction
FA is a pharmaceutical antibiotic used to treat primary and secondary bacterial skin infections caused by Staphylococcus, Streptococcus, and Corynebacterium sensitive strains. An antibiotic with steroid-like properties 1 and a molecular formula of C31H48O6 (Figure 1), FA’s effectiveness belongs to its ability to inhibit the translocation of peptidyl tRNA. 2.
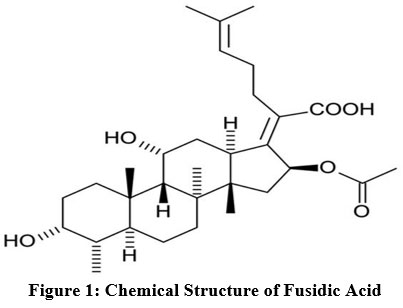 |
Figure 1: Chemical Structure of Fusidic Acid |
The development of novel analytical quality control methods is crucial in determining the calibre, therapeutic efficacy, and safety of FA and how it meets the requirements of the pharmaceutical industry and, by extension, the medical profession. Due to the ease with which it achieves chemical separation, identification, and quantification, reversed-phase liquid chromatography (RP-LC) constitutes the prominent contemporary analytical method of choice. Through its use, separating drug molecules from other compounds and/or excipients, in addition to their degradation products, has been rendered feasible 3.
The study’s major purpose is to improve and validate a proper HPLC method, which must be an accurate, sensitive, and precise method for quantifying FA without interferences between FA and other constituent elements of NE formulation. Besides presenting the method developed, this study will discuss its advantages over other published analyses.
Materials
Sgonek Biological Technology Co. (China) provided the reference standard fusidic acid (FA-RS) and stearyl amine. OREC Asia represented the supplier of ethanol (Malaysia). Soap Cart Co. (Malaysia) furnished the tea tree oil, and Sigma-Aldrich the propylene glycol (USA). Tween® 80 was acquired from Euro-Chemo-Pharma, while PEG 4000 was purchased from Merck (Germany) (Malaysia). J.T. Baker provided methanol and acetonitrile (HPLC grade) (Phillipsburg, USA). Deionized Milli-Q water constituted the purified water used (Millipore, Bedford, USA). QRC represents the source of glacial acetic acid (Selangor, Malaysia). Nylon filters (Sun Sri, USA) were used to filter the mobile phase (0.45 m) and Power sonic 405 (Seoul, Korea) was used to sonicate it. Before being injected into the HPLC equipment, 0.45 m polytetrafluoroethylene (PTFE) membrane filters of syringes (Pall Corporation, USA), were used to filter sample solutions.
HPLC Conditions and Apparatus
A Shimadzu pump (LC-20AT vp) (VP series, Kyoto, Japan) was employed, along with a UV–vis detector (SPD-20AD vp), a solvent delivery unit, a degasser, an auto-injector, and an oven (CTO-10S VP) (SIL20A HT vp). LabSolutions software was used to gather and process the data using that was already installed on a desktop computer system. An Agilent ZORBAX SB-C18 column (4.6 250 mm, 5 m) was used to achieve chromatographic separations (USA). The temperature of the oven was kept at 25°C. The mobile phase consisted of acetonitrile: water with 0.001 M acetic acid (8:2, v/v). The pH was optimised at 3.3, with a constant flow rate of 1 mL/min. The isocratic elution method analysed the calibration standard solutions/test samples. The sample injection was set at 20 μL to ensure effective detection and clearance of both drugs from the system; each injection was given a 10-minute run time. According to the results of a preliminary UV–vis spectrophotometric evaluation using a spectrophotometer, the greatest absorbance of the post-injection FA was 235 nm.
Methods
Preparation of a calibration curve and a standard solution
Forty milligrams of FA powder were dissolved in 100 ml of mobile phase (acetonitrile: water). The solution was vortexed for 5min minutes and sonicated. The stock solution was then diluted with the mobile phase to reach the final concentrations of 400µg /ml to 12.5 µg /ml. Each standard solution was injected three times into the HPLC system; then, peaks were recorded and plotted versus the concentrations to create the FA standard calibration curve. Based on error estimations, the y-intercept, slope, and correlation coefficient of the curve were computed using most minor square linear regression analysis.
Preparation of nanoemulsion and nanoemulsion gel
Preparation of FA-loaded non-ionic (NNE) and cationic (CNE) nanoemulsions
FA-loaded NE was produced with a precise ratio of oil/surfactants/water that resulted in transparent NE as indicated by a developed psuedoternary phase diagram software which gives the right ratio of mixing between the main constituents of NE. Unless otherwise stated, the non-ionic NE was prepared in the following manner using non-ionic surfactant. In the initial step, both oily phases, FA and surfactants, were mixed then, the aqueous phase was added gradually. Finally, the mixture was vortexed for 30 seconds. Finally, cationic surfactant stearyl amine (1%) was added to the mix to produce CNE.
Preparation of FA-loaded bilayered non-ionic (BNE) and cationic bilayered (CBNE) nanoemulsion gels
The FA-NNE and FA-CNE were jellified and transformed into 2% FA-BNE and 2% FA-CBNE using Carbopol® 940 hydrogel (Mumbai, Maharashtra, India). The two formulations were rheologically suitable for topical use in this form 4.
The FA NE gel stock sample was produced by combining 100 mg of the NE gel with 10 ml of mobile phase (acetonitrile: water), which contained 200 μg mL-1 of available FA). The resulting mixture was subjected to 10 minutes of sonication. Before analysis, All samples were used to filter it. With 20 microliters of the sample fed directly into the HPLC apparatus without any additional dilution. The placebo stock sample was manufactured in an identical manner to that of the other samples but without the addition of FA.
System suitability testing
The chromatographic system’s repeatability and performance were confirmed by a system suitability test. The theoretical plates (N), height equivalent of a theoretical plate (HETP), and tailing factor (T) were calculated using USP (United States Pharmacopeia) guidelines and tested at 200 µg /mL FA (n = 6).
Method validation
During method validation, ICH (2005) guidelines for linearity, precision, selectivity, accuracy, robustness and detection and quantification of limits were followed.
Range and linearity
Linearity was evaluated using five calibration plots on five consecutive days with FA concentrations ranging from (12.5 to 400 µg /mL), regarding ICH guidelines Q2(R1) (November 2005). The peak area of FA was used to construct the calibration curve.
Precision and accuracy
Repeatability (daily) and intermediate(inter-day) evaluated precision. Precision by repeatability (n=9) covered the method’s linear range, i.e., three concentrations obtained from the calibration curve: the lowest concentration was (12.5 µg/ml), the middle concentration was (50 µg/ml), and the highest concentration was (100 µg/ ml). This technique was performed three times on a single day, in one laboratory, and under consistent experimental conditions by the same analyst. On separate days, different analysts worked on the linear range of the technique (n=9) to attain intermediate precision. % RSD (the percentage relative standard deviation) was determined as an accuracy indicator. Besides, the relative percentage relating to an error (% RE) was used to assess the accuracy of FA calculated from the previously established standard calibration curve.
Recovery of FA
A half g of blank BNE sample was solubilized in 20 ml of ultra-pure water and swirled continuously while 10 mg of FA was added to the solution, which was then sonicated using an ultrasonic bath for ten minutes. Using a 10 ml volumetric flask, 1 ml of the mentioned solution was diluted with 10 ml of the mobile phase and passed through a 0.45 m nylon filter. In the end, the final nominal concentration was 50 µg/ml. A 20 µl FA sample was injected into the HPLC apparatus. The resulting area under the curve of the drug was coupled to the regression equation to compute the recovery of the selected sample. Three times the experiment was carried out.
Specificity
The chromatograms that resulted from the standard FA solution were compared with the chromatograms of the formulation with and without FA, the probability of interferences of FA with mobile phase and other formula’s excipients during the retention time was assessed.
Limit of detection (LOD) and limit of quantification (LOQ)
The standard deviation from the calibration curve’s y-intercept and the slope’s average, which were obtained from Equations using 1 and 2, respectively, were used to calculate the LOD and
LOQ
LOD = 3 (SD.a-1)
LOQ = 10 (SD/a-1)
Where SD is the intersection’s standard deviation and a is the slope’s average.
Robustness
Minor modifications to the optimal chromatographic conditions were used to test the resilience of the new approach. The variables tested were the detector wavelength (230 to 240 nm), pH 3.0 to 3.5), mobile phase composition (78:22 to 82:18 acetonitrile/ water v/v), flow rate (0.8 and 1.2 ml /min), and oven temperature (23 to 27 °C). The study was carried out with a FA concentration of 200 µg mL 1. The FA peak regions and percentage RSD of the test robustness were determined, and the data was statistically examined.
Stability of the stock solution
For 24 hours, the FA stock solution (20 mg/ml) was set aside at ordinary room temperature (25± 2°C). Then, FA concentrated stock solution was diluted to 200 µg/ml, which is a concentration within the standard range of the calibration curve. After 24 hours, the responses were compared to the freshly prepared sample.
Statistical analysis
All data obtained from statistical analyses were repeated three times individually. All gathered data are expressed as mean ± standard deviation (SD), with a statistical significance threshold of 0.05, using the GraphPad Prism® software.
Results and Discussion
System suitability testing
Before the validation technique, a group of tests that evaluate the system’s compliance (system appropriateness) must be done. This collection of compliance tests is intended to ensure that the equipment and procedure under development can generate accurate and precise results. 5
To be declared reliable and repeatable, the system must pass at least two of the following tests, according to the FDA (1994): repeatability, resolution, plate number, asymmetry, and retention factor. Moreover, asymmetry is a significant property Due to its inhibition of chromatographic peaks from broadening may lead to inaccuracies in detecting analytes of interest 7.
Many parameters, including analytical conditions, sample or solute volume, column length, can influence the number of plates used. The retention factor is utilized to confirm that the suggested technique produces a good chromatographic utilization. This metric is inversely related to the analyte’s retention time. When kept within acceptable limits, low retention factors result in reduced expense, faster analysis, and, as a result, fewer waste output 8.
According to the results of system suitability tests, the chromatographic parameters utilized to construct this approach can deliver precise and decisive results because the computed means value for asymmetry was lower than 2.0. The average plate number and Tailing factor exceeded 3000 and 2.0, respectively., as required by FDA guidelines (1994) 6. Furthermore, with an RSD of less than 2%, the results of FA retention time were found to be near 10 min, and chromatographic peak regions were sufficiently accurate for conformance testing (see Table 1) 7.
Table 1: System Suitability Analysis For FA At 200 μg/ml (Mean ± SD, n=6).
| Parameters | Theoretical plates (N) | Tailing factor (T) | Retention time (Rt) |
| Values | 8296.33±30.022 | 1.105±0.0057 | 6.02±0.013 |
| % RSD | 0.361 | 0.522 | 0.771 |
| Required limits | N > 3000 | T ≤ 2 | RSD≤2% |
Validation of Method
Linearity and range
Peak area and FA concentrations within the range of 12.5- 400 μg /ml were shown to have a linear relationship (Figure 2). Furthermore, the linearity of the evaluated calibration curves was confirmed by the value of the regression correlation coefficients (R).
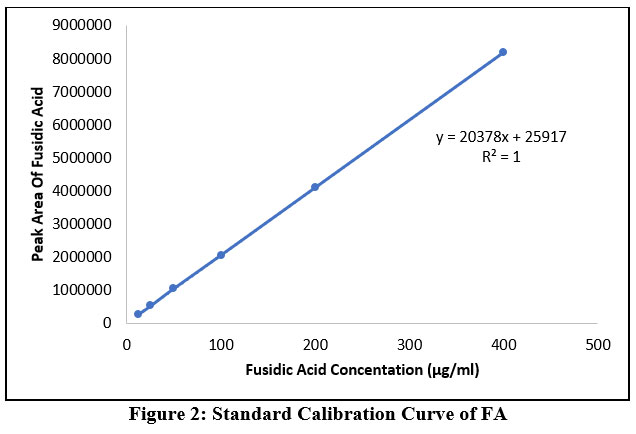 |
Figure 2: Standard Calibration Curve of FA. |
Precision and accuracy
The intra-day and inter-day precision and accuracy data are shown in Table 2. The intra-day precision for FA was 0.19 % to 1.55 %, while the accuracy was -1.101 % to 0.277 %. While the inter-day precision started from 0.66 % To 0.81 %, and the accuracy started from -0.886 % To 0.378 %. Statistics showed that the method was exact and accurate, within the 2% range indicated by the US Pharmacopeia 17.
Table 2: The Results of Intra-Day and Inter-Day Precision and Accuracy. Mean ± SD, N = 6.
| Conc.
(μg/mL)
|
Intra-day
|
Inter-day
|
||||||
| Area | Mean±( SD)* | Precision (%RSD) | Accuracy (%RE) | Area | Mean ± (SD)* | Precision (%RSD) | Accuracy (%RE) | |
| 100 | 2079731 | 2065036±6278 | 0.30 | 0.064 | 2035235 | 2050280±14902 | 0.72 | -0.663 |
| 2002018 | 2065036 | |||||||
| 2023958 | 2050569 | |||||||
| 50 | 1049000 | 1047652±2042 | 0.19 | 0.277 | 1040689 | 1048691±8568 | 0.81 | 0.378 |
| 1048655 | 1047652 | |||||||
| 1045303 | 1057732 | |||||||
| 12.5 | 280739 | 277786±4316 | 1.55 | -1.101 | 277868 | 278303±1861 | 0.66
|
-0.886 |
| 279961 | 276868 | |||||||
| 272904 | 280473 | |||||||
(SD) = standard deviation; †RSD = relative standard deviation, RE relative error
Recovery of FA
The major purpose of the experiment was to determine the accuracy of the presented method for quantifying FA in the sample proved. Therefore, the slope and intercept of the calibration curve were obtained in the concentration range of 400–12.5 5 μg /ml, which were used to determine FA recovery. The percentage of FA recovery was 100.7% in the NE gel formulation sample.
Specificity
The chromatograms of pure FA which appeared in 6.08 min are compared to the chromatograms of several types of FA-loaded NEs and placebo formulations in Figure 3. It was demonstrated that none of the formulation components, such as surfactants and oil and mobile phase components peaks which appears in the chromatograms especially from (2-5)min and (9-10) min , influenced FA retention time . As a result, this procedure is unique to FA analysis.
 |
Figure 3: Chromatograms of The Pure FA, Placebo and The Different Nanoemulsion Formulations. 1: Placebo CNE, 2: Placebo NNE, 3: FA-CNE, 4: FA-NNE, 5: FA-CBNE, 6: FA-BNE. Retention Time of FA = 6.08 Min. |
Determinations of Limit of detection (LOD) and limit of quantification (LOQ)
The LOD tested samples were found to occur at 1.33 μg. mL -1. Meanwhile, the LOQ was 4.04 μg. mL -1.
Robustness Assays
The contents of Table 3 indicate the method’s robustness. According to statistical testing, the peak area and retention times were not significantly affected by modifications in the mobile phase pH or oven temperature. However, differences in the detecting wavelength and flow rate resulted in significant variants in the peak curve area and retention time. Meanwhile, changes in mobile phase components had little effect on peak area but did produce significant alterations in retention duration.
Table 3: Robustness at Concentration of 200 µg/ml (Mean ± SD, N=3)
| Parameters | Variations | Peak mean curve area ± SD | %RSD | Mean retention time (min) ± SD |
| Mobile Phase pH | 3.0 | 4211670 ± 12573 | 0.29 | 6.07±0.001 |
| 3.3 | 4131696±46658 | 1.12 | 6.04±0.004 | |
| 3.5 | 4138716±67837 | 1.63 | 6.08±0.002 | |
| Wavelength (nm) | 230 | 4288308±79133 | 1.84 | 6.03±0.001 |
| 235 | 4141966±38346 | 0.92 | 6.02±0.013 | |
| 240 | 3343503±7088 | 0.21 | 6.03±0.005 | |
| Flow rate (ml /min) | 0.8 | 4264048±43858 | 1.02 | 7.53±0.006 |
| 1 | 4131258±17088 | 0.41 | 6.03±0.002 | |
| 1.2 | 3656187±9112 | 0.24 | 5.04±0.012 | |
| Mobile phase (w/v) | 78:22 | 4060333± 26222 | 0.64 | 6.37±0.180 |
| 80:20 | 4107832± 16346 | 0.79 | 6.04±0.008 | |
| 82:18 | 4120439± 70773 | 1.71 | 5.84±0.303 | |
|
Temperature(C°) |
23 | 4101336±6969 | 0.16 | 6.09±0.015 |
| 25 | 4135932±48326 | 1.16 | 6.05±0.006 | |
| 27 | 4131696±46658 | 1.12 | 6.14±0.069 |
Stock solution stability
The fusidic acid standard solution sample was determined to be stable after 24 hours at ambient temperature (25±2 C). In addition, the FA peak area did not differ significantly between 0 and 24 hours (p > 0.05). Therefore, the total drug content was 200.9011 μg /mL at 0 hours and 200.6556 μg /mL at 24 hours, as shown in Table 4.
Table 4: Stability of FA Solution
| Time (h) | Standard solution of fusidic acid (μg/mL) | Peak area | Total drug content (μg/mL) |
| 0 | 200 | 4216700 | 200.9011 |
| 4093338 | |||
| 4093338 | |||
| 24 | 200 | 4093338 | 200.6556 |
| 4093338 | |||
| 4093338 |
This method of measuring FA in biological fluids is described in several articles in the relevant literature. (9,11,12,18), and pharmaceutical products 13,14,6,15,4,16. Some of these procedures are time demanding, necessitate a buffer solution, or necessitate long-running durations, excess in the volume of injection, flow rates, and drug concentrations in the sample. In addition, being the first approved method for FA measurement in this type of formulation, this is a more user-friendly method for FA quantification in nanoemulsion and nanoemulsion gel.
Conclusion
Developing a stable HPLC–UV technique for determining FA concentration in NE and NE gels proved successful. The procedure was discovered to be simple, rapid, sensitive, and specific. The intra-day and inter-day precision and accuracy were both less than 2%, indicating that the protocol was extremely accurate, and the method followed USP recommendations. Excipients, diluents, mobile phase constituents, and degradation products did not cause any interference. The method might be employed for standard FA assays in addition to in vitro investigations of FA release from NE gel formulations.
Conflict of Interest
There are no conflict of inerest.
Funding Sources
It is self-funded study.
References
- Goswami N, Gupta VR, Jogia HA. Development and Validation of a Novel Stability-Indicating RP-HPLC Method for the Simultaneous Determination of Halometasone, Fusidic Acid, Methylparaben, and Propylparaben in Topical Pharmaceutical Formulation. Sci Pharm. 2013;81(2):505-518. doi:10.3797/scipharm.1301-21
CrossRef - Perera G, Hay R. A guide to antibiotic resistance in bacterial skin infections. J Eur Acad Dermatol Venereol. 2005;19(5):531-545. doi:10.1111/j.1468-3083.2005.01296.x
CrossRef - Tistaert C, Dejaegher B, Vander Heyden Y. Chromatographic separation techniques and data handling methods for herbal fingerprints: a review. Anal Chim Acta. 2011;690(2):148-161. doi:10.1016/j.aca.2011.02.023
CrossRef - Waqas MK, Sadia H, Khan MI, et al. Development and characterization of niosomal gel of fusidic acid: in-vitro and ex-vivo approaches. Des Monomers Polym. 2022;25(1):165-174. Published 2022 Jun 9. doi:10.1080/15685551.2022.2086411
CrossRef - Sahu PK, Ramisetti NR, Cecchi T, Swain S, Patro CS, Panda J. An overview of experimental designs in HPLC method development and validation. J Pharm Biomed Anal. 2018;147:590-611. doi:10.1016/j.jpba.2017.05.006
CrossRef - Tótoli EG, Salgado HR. Development, Optimization, and Validation of a Green and Stability-Indicating HPLC Method for Determination of Daptomycin in Lyophilized Powder. J AOAC Int. 2015;98(5):1276-1285. doi:10.5740/jaoacint.15-039
CrossRef - Rasool N, Kanwal Q, Waseem M, Mehrunnisa, Khan MI. Analytical method development and determination of hydrocortisone acetate and fusidic acid simultaneously in cream formulation, by reversed-phase HPLC. Biomed Chromatogr. 2021;35(3):e4997. doi:10.1002/bmc.4997
CrossRef - Poole CF, Gunatilleka AD, Sethuraman R. Contributions of theory to method development in solid-phase extraction.J Chromatogr A. 2000;885(1-2):17-39. doi:10.1016/s0021-9673(00)00224-7
CrossRef - Simmonds HA. Simultaneous separation by high-performance liquid chromatography of carbamoyl aspartate, carbamoyl phosphate and dihydroorotic acid. J Chromatogr B Biomed Sci Appl. 1999;732(2):487-493. doi:10.1016/s0378-4347(99)00303-5
CrossRef - Hikal AH, Shibl A, El-Hoofy S. Determination of sodium fusidate and fusidic acid in dosage forms by high-performance liquid chromatography and a microbiological method. J Pharm Sci. 1982;71(11):1297-1298. doi:10.1002/jps.2600711130
CrossRef - Mehmood T, Hanif S, Azhar F, et al. HPLC Method Validation for the Estimation of Lignocaine HCl, Ketoprofen and Hydrocortisone: Greenness Analysis Using AGREE Score. Int J Mol Sci. 2022;24(1):440. Published 2022 Dec 27. doi:10.3390/ijms24010440.
CrossRef - Rahman A, Hoffman NE. High-performance liquid chromatographic determination of fusidic acid in plasma.J Chromatogr. 1988;433:159-166. doi:10.1016/s0378-4347(00)80594-0
CrossRef - Abdelrahman M, Emam R , Ali N, et al. Novel eco-friendly chromatographic determinations of hydrocortisone acetate, fusidic acid, their pharmacologically active impurities and pharmaceutical excipients: a comparative study. Chem. Pap. 2020; 74:2175–2187. doi.org/10.1007/s11696-020-01065-w
CrossRef - Kumar V, Bhutani H, Singh S. ICH guidance in practice: validated stability-indicating HPLC method for simultaneous determination of ampicillin and cloxacillin in combination drug products. J Pharm Biomed Anal. 2007;43(2):769-773. doi:10.1016/j.jpba.2006.07.051
CrossRef - Da Silva TLA, Ferreira RGL, Lustosa IA, Kogawa AC. An Overview of Analytical Methods for the Quantification of Marbofloxacin in Pharmaceutical, Biological, and Food Matrixes. J AOAC Int. 2022;105(2):456-462. doi:10.1093/jaoacint/qsab143
CrossRef - Shaikh S, Muneera MS, Thusleem OA, Tahir M, Kondaguli AV. A simple RP-HPLC method for the simultaneous quantitation of chlorocresol, mometasone furoate, and fusidic acid in creams.J Chromatogr Sci. 2009;47(2):178-183. doi:10.1093/chromsci/47.2.178
CrossRef - Shabir GA. Validation of high-performance liquid chromatography methods for pharmaceutical analysis. Understanding the differences and similarities between validation requirements of the US Food and Drug Administration, the US Pharmacopeia and the International Conference on Harmonization.J Chromatogr A. 2003;987(1-2):57-66. doi:10.1016/s0021-9673(02)01536-4
CrossRef - Wang J, Yuan Y, Liu C, Zhu D, Shen X, Yang B. Preparation and pharmaceutical/ pharmacodynamic evaluation of topical brucine-loaded liposomal hydrogel.J Mater Sci Mater Med. 2009;20(10):2075-2084. doi:10.1007/s10856-009-3773-6
CrossRef

