
Manuscript accepted on :14-11-2022
Published online on: 25-01-2023
Plagiarism Check: Yes
Reviewed by: Dr. Narasimha Murthy, Dr. Dewi Syahidah
Second Review by: Dr. Yerbolat Iztleuov
Final Approval by: Dr. Anton R Kiselev
Rupali Patil* and Ramesh Karandikar2
Electronics and Telecommunication Engineering, Somaiya Vidyavihar University, Mumbai, India.
Corresponding Author E-mail: rupalipatil@somaiya.edu
DOI : https://dx.doi.org/10.13005/bpj/2608
Abstract
Purpose: A less computationally intensive methodology is required to digitise paper Electrocardiogram (ECG) records from scanned photographs so that it can be implemented on mobile devices and used in remote places without the necessary hardware or software requirements. Due to numerous degradations inherent in older resting paper ECG recordings, automated digitization of paper ECG records also becomes challenging. Methods: In the proposed method, we present a robust and simple, Level of Binarization (LOB) characteristic curve to binarize paper records. The binarized image is processed using the discontinuous signal correction (DSC) technique and is vertically scanned to extract 1-D ECG signal. Results: The proposed method is tested for paper ECG records having degradations like variable background colour, steep slope, ink evaporation, and folding. The average RMS error and accuracy for 101 test samples, is 0.01 and 98.34 % respectively. The results show that, the LOB-DSC gives better performance when compared to the existing ECG extraction methods. As proposed, the LOB method does not require pre-processing, and the computational complexity is also reduced. Conclusion: An automatic threshold for binarization and estimation of several types of degradations in old ECG records is obtained using the less computationally intensive LOB characteristic curve. This method can be applied in remote locations with low availability of advanced processing devices for ECG signal extraction.
Keywords
Automated Digitization; Computationally Efficient; Degradation; Paper ECG
Download this article as:| Copy the following to cite this article: Patil R, Karandikar R. Computationally Efficient LOB Algorithm for Digitization of Degraded Paper ECG Reports. Biomed Pharmacol J 2023;16(1). |
| Copy the following to cite this URL: Patil R, Karandikar R. Computationally Efficient LOB Algorithm for Digitization of Degraded Paper ECG Reports. Biomed Pharmacol J 2023;16(1). Available from: https://bit.ly/400a3by |
Introduction
The initial and essential step for scanned paper image analysis and digitization is Binarization. Binarization (optimum threshold selection) of scanned images of paper records refers to the conversion of a colour image into a binary image. It usually, converts required signal areas in black and background grid paper to white, and hence it can be further used in signal extraction and digitization technique. Thresholding of an image plays a crucial role in the digitization of paper ECG records since its performance affects quite critically the degree of success in signal extraction and recognition. The most straightforward approach to convert a colour image to black and white is to generate a grayscale image from the colour image and then apply a threshold on to it. This threshold lies between 0 to 255. The automated thresholding problem tries to find a solution at what value between 0 to 255, which can be used to obtain the best binary image that can further be used for extraction of signals. Here, we present a robust and novel method of automated global thresholding called level of Binarization (LOB) characteristic curve that can perform Binarization and digitization of any scanned older resting degraded paper ECG record.
Literature Review
In digitization of document images, one of the main pre-processing stages is a separation of the foreground from the background, i.e., thresholding. The thresholding techniques are majorly classified as local or global thresholding [1]. There are some sliding window local thresholding techniques also available. Niblack et al. [2,3] introduced a sliding window technique that calculates a local threshold for each pixel of an image using mean and standard deviation. The limitation of this method is that only mean and standard deviation are used for calculation of local threshold, which is not sufficient for adaptive thresholding which needs additional information about the background. This problem is solved by Sauvola et al. [4] who proposed a method that uses dynamics of the standard deviation by adding analysis of text and background pixels (grey values for text pixels near 0 and grey values for background pixels near 255), which gives better results for documented images. Swamy et al. used Otsu algorithm [5] to perform adaptive image binarization. The threshold is selected based on an active signal region and not on the entire image. The automated thresholding proposed by Mallawaarachchi et al. [6] used two methods. The first method is based on the dynamic computation of the threshold using image histogram. Another method computes the threshold using the technique proposed by Sauvola. Sauvola technique works well for faded paper ECG records [7,8] but leaves background grid for some cases. Gatos et al. [9] proposed adaptive degraded document image binarization in several steps like pre-processing using a low-pass Wiener filter, Savola adapted the thresholding for estimation of foreground text and then finally post-processing to improve text quality. The methods reported in [10-12] also propose similar stepwise binarization method for degraded documents. Literature reports several methods for thresholding, but these methods face a common problem of robustness, where one method can be suitably used for binarizing all types of degraded documents.
Our group has recently proposed a method for not only digitizing ECG paper records, but also detection of heart diseases from the digitized records [13]. In the proposed method, the adaptive threshold is calculated using a deep learning approach and thus requires a lot of computational power. Hence, that method is not suitable for computationally poor embedded devices available at rural or remote areas. Li et al. also proposed efficient and deep learning based ECG signal extraction [14-15]. Here, we present the level of Binarization (LOB) characteristic curve, a robust and computationally less complex automated thresholding technique that can binarize scanned older resting paper ECG records with varied degrees of degradation and also can be used for estimation of various kinds of degradations of old ECG records.
Methodology
 |
Figure 1: ECG signal extraction from scanned and camera capture ECG records using LOB. |
Figure 1 shows the automatic binarization and discontinuity correction of preserved signal records. The older resting paper ECG records are available in both single lead and 12 lead formats. All those records are scanned at 300 dpi and stored in a .png format using Epson L210 flatbed scanner. The database also consists of some camera captured paper ECG records, captured using 12 megapixels Motorola M5 mobile phone camera. First, the average value is calculated for both single lead, and 12 lead scanned ECG images, and it is found that both images have the same average values. The binary image can be obtained from any grayscale image by binarizing the image with a particular value (threshold) that lies between 0 to 255. To obtain that threshold value, first the normalized sum (NS) value is calculated as
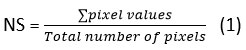
Where ∑ Pixel values are the addition of each white pixel (value =1) from an image and a total number of pixels is the product of the number of rows (M) and the number of columns (N). The characteristic curve is plotted between the NS of an image and threshold value for the binarized image. This threshold value is LOB.
Figure 2 (A) shows the thresholding operation, where the value of LOB is adjustable between 0 to 255. As seen in the image of the cameraman, after thresholding, only the dark area such as coat and hair are visible (black), and the background turns into white. Figure 2 (B) shows six different binary images with their corresponding normalized sum. The topmost image is fully white (corresponding to value=1) and hence the NS value is 1. The bottommost image is fully black (the corresponding pixel value is 0), and hence the NS is 0.
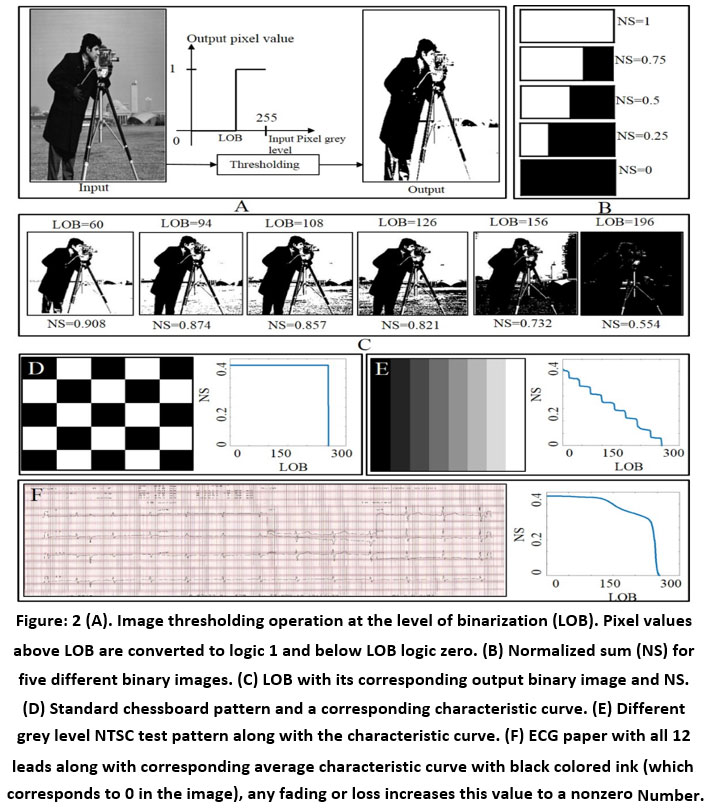 |
Figure 2: (A)Image thresholding operation at the level of binarization (LOB). Pixel values above LOB are converted to logic 1 and below LOB logic zero. (B) Normalized sum (NS) for five different binary images. (C) LOB with its corresponding output binary image and NS. |
From top to bottom in Figure 2 (B), the portion of white is reducing, and hence the NS is also decreasing. Figure 2 (C) shows different levels of binarization used (top) and a corresponding image obtained (middle). The bottom panel indicates NS corresponding to each image. It can be seen that NS decreases (from left to right) with an increase in the LOB. Figure 2 (D) shows a standard chessboard pattern and the corresponding characteristic curve. As expected, the characteristic curve is a single step as the chessboard pattern has only two levels (0 & 1) and hence characteristic curve has only one transition when all the white pixels turn into black. Figure 2 (E) shows a different grey level test pattern along with its characteristic curve. The characteristic curve has 8 steps; each step indicating the corresponding grey level has gone into the black region from white. Figure 2 (F) shows 12 lead paper ECG with corresponding average characteristic curve obtained from 30 reference ECG paper records (scanned within one hour of recording and verified binary pattern by cardiologists). To obtain the binary image from the input colour image, it is required to find out LOB in an automated manner. Figure 3 shows the proposed approach to determine the automated threshold (AT) for binarization. For this purpose, level of the threshold is defined which is the value of NS for which the corresponding LOB is selected, and white width (Wwidth) (Figure 3 E snippet) is defined, as the maximum level of LOB (i.e., width) from zero for which the NS remains 1 (white). The specific point at which the binary image is perfect is called the ideal level of binarization or Ideal LOB (Figure 3 (E) snippet). Ideal LOB is obtained by brute force attack where the binarized image is obtained for each grey value (0-255) of an image. Four cardiologists verified the best binary image. The grey value for which the best binary image is obtained is considered as desired ideal LOB. The ideal LOB is obtained for all 68 RGB images of size 190 X 425.
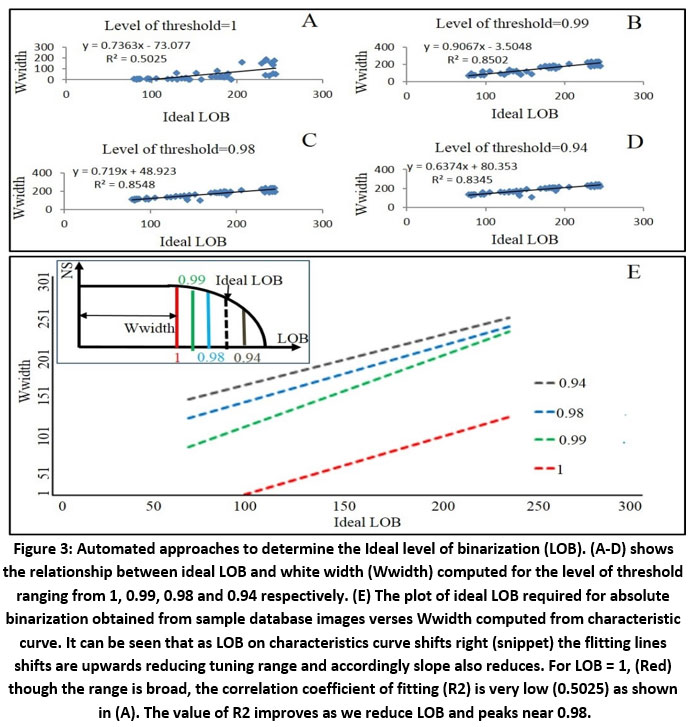 |
Figure 3: Automated approaches to determine the Ideal level of binarization (LOB). (A-D) shows the relationship between ideal LOB and white width (Wwidth) computed for the level of threshold ranging from 1, 0.99, 0.98 and 0.94 respectively. |
Figure 3 (A-D) shows the relationship between the desired ideal LOB and Wwidth computed for normalize sum or level of threshold ranging from 1, 0.99, 0.98 and 0.94 respectively. Figure 3 (E) is a plot of ideal LOB required for complete binarization obtained from ideal LOB versus Wwidth computed from characteristic curve. The flitting lines shift upwards reducing tuning range and accordingly slope also reduces. As shown in Figure 3 the level of the threshold is 1 (Red), the correlation coefficient of fitting (R2) is very low (0.5025). The value of R2 improves as we reduced the level of threshold and peaks near 0.98. Hence, we have selected 0.98 as the level of threshold. The corresponding linear fit equation is used to calculate an automated threshold as AT = 1.1889 * Wwidth -34.892. The automated threshold is then used to binarize all scanned and camera capture paper ECG records.
Results and Discussion
Binarization of degraded paper ECG records using LOB
 |
Figure 4: Binarization of degraded paper ECG records using LOB, (A)-(B) Crumbled paper ECG record. (C) camera capture image of paper ECG record is showing non-uniform illumination. (D) folded paper ECG record. |
Though previous research focused on digitization of scanned image of older resting paper ECG records, nowadays image can be immediately obtained with a cell phone camera. However, such cell phone capture images also have problems like non-uniform illumination, low contrast due to lack of sufficient or controllable lightning. Hence the algorithm is validated for both scanned as well as camera capture images. To test the robustness of the proposed algorithm, the proposed algorithm is tested for degraded paper ECG records having degradations like crumbling effect, non-uniform illumination effect and folding effect. Figure 4 shows the proposed LOB technique successfully binarized degraded paper ECG records, except for major folds (figure 4 H). Again, as can be seen from figure 4, the ECG signal present in binarized images (figure 4 E-H) contains discontinuities, which are further corrected using DSC.
LOB-Discontinuous Signal Correction DSC) and 1-D signal extraction
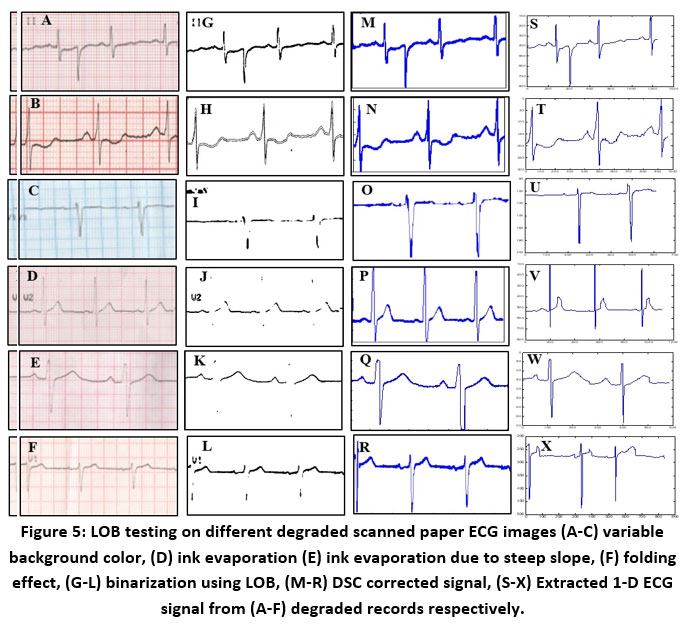 |
Figure 5: LOB testing on different degraded scanned paper ECG images (A-C) variable background color, (D) ink evaporation (E) ink evaporation due to steep slope, (F) folding effect, |
The proposed LOB algorithm blended with DSC and vertical scanning successfully extracts continuous 1-D ECG signal from degraded paper ECG records as shown in figure 5. Vertical scanning is used to extract the 1-D signal from a 2-D image by scanning the image vertically for the identification of signal pixels. Once the 1-D signal (extracted from degraded or preserved paper ECG records) is available, its easy task to extract important signal parameters for further analysis. The various degradations considered here are the variable background colour, ink evaporation, steep slope with ink evaporation and folding effect as shown in figure 5 (A-F) respectively. The correct and continuous 1-D ECG signal extracted in the presence of degradations validates the proposed LOB algorithm (figure 5(S-X).
Degradation estimation using LOB characteristic curve
Different losses such as folding of paper, paper crumbling, shadow and crumbled appeared during scanning, fading, camera capture and effect of shadow causing non-uniform illumination are characterized using LOB characteristic curve as shown in figure 6. It can be seen that after folding LOB characteristic curve shifts to left and smooth out as compared to the original LOB characteristic curve obtained from a non-degraded image. Due to crumbling, characteristic curve shifts to the left of the original and also slope increases. The crumbled and shadow effect which is a combined degradation increases the shift from original and reduces the slope. The fading effect obtained by scanning the same ECG after 180 days and the slope of the characteristic curve becomes steep due to fading effect. The original camera captured image and shadowing effect (non-uniform illumination) in case of such camera captured images is also characterized using LOB characteristic curve as shown in figure 6 (G) with the corresponding characteristic curve.
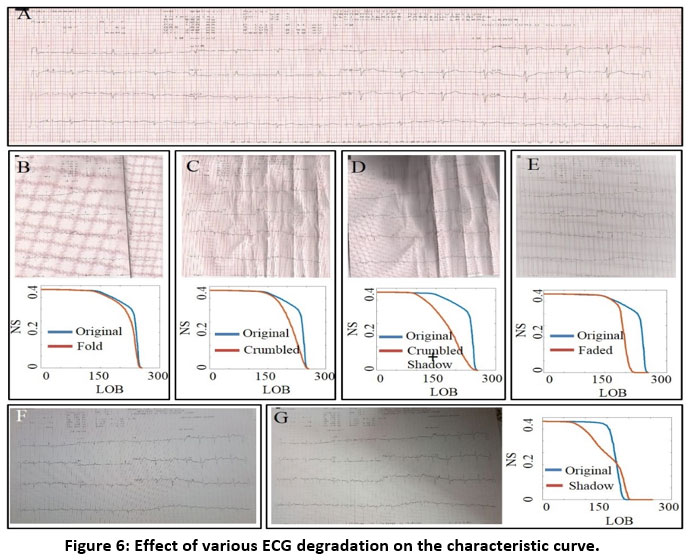 |
Figure 6: Effect of various ECG degradation on the characteristic curve. |
LOB-DSC accuracy and RMS error analysis and comparison with existing techniques
The image dataset consists of 836 scanned paper ECG images. For the validation purpose, ECG signal extracted by the proposed method is compared with the ground truth of the signal acquired from direct advanced data machines (sample size, N=101). Furthermore, the proposed method is tested for the images (N=735) for which ground truths are not accessible and visual feedback on the digitized output is obtained from two cardiologists. Accuracy and root mean square (RMS) error is calculated between extracted ECG and its ground truth. For accuracy, calculation the binary image obtained is inverted such that the background becomes black pixel, and the signal becomes a white pixel.
Table 1: Accuracy results of LOB-DSC technique when compared with existing techniques.
| Method | Radon transform
[16] (N=25) |
LOB | Contrast enhancement
Filtering [17] (N=5) |
LOB | Morphological feature extraction [18]
(N=25) |
LOB | K
means [19] (N=10) |
LOB |
| Accuracy
(%) |
95 | 98.91 | 99 | 99.46 | 97 | 98.91 | 99 | 99.06 |
Once the signal is present with a white pixel, the morphological operation, skeletonization is done such that a single pixel per column should remain in the ECG signal. A further similar operation is carried out for ground truth image, and then both images are multiplied such that, whenever there is an overlap of white pixels in the signal domain that is considered as signal pixel otherwise it is considered as zero. Finally, to calculate the percentage accuracy the total number of white pixels remained after multiplication are divided by a total number of white pixels in the original image or ground truth.
Further for calculation of RMS error, the pixels which are not white concerning to the ground truth are considered to be pixels in error. For RMS error calculation, the summation of these pixels is taken, and its mean value is computed by dividing it by the total number of pixels in the signal which are nothing but the number of white pixels of ground truth. Once this number is determined, its root is computed for calculation of root mean square error.
Table 2: RMS error results of LOB-DSC technique when compared with existing techniques.
| Method | Neighbourhood and median approach
[20] (N=5) |
LOB | Anchor point setting [21]
(N=169) |
LOB | Signal contour extraction [22]
(N=30) |
LOB | K
means [19] (N=10) |
LOB |
| RMS
error (%) |
3 | 1.2 | 16.8 | 1.07 | 12 | 2.89 | 1 | 0.93 |
Table 1 shows LOB is almost equivalent in the accuracy with the existing techniques reported in the literature with very high accuracy. LOB could still achieve a 0.06% improvement over existing techniques. The accuracy is highest (99.46%) with LOB when applied on image dataset used for contrast enhancement filtering. In terms of RMS error (as shown in table 2), LOB is better with all other RMS error reported in the literature by at least 7%. The minimum RMS error (0.93%) is found out to be with LOB when applied on the database images of the K-means algorithm. Highest RMS error of 16.8% is reported by anchor point setting. For the same database (anchor point setting) LOB accuracy is found out to be 1.07% which is a good improvement of 166 times than the original RMS error computed.
Complexity comparison of EBPS [23] and LOB method
The signal extraction methods reported uses pre-processing tech for image enhancement. Image enhancement techniques like filtering or contrast enhancement [24-26] contributes to computational complexity by at least O(n2) x filter size. As proposed EBPS and LOB method does not require pre-processing the computational complexity is reduced. The computational complexity and space complexity of proposed EBPS and LOB algorithm is shown in table 3. To calculate space complexity RGB image size used is 190 X 425. Total memory size is due to variables used to store RGB, greyscale, binary and processed binary image. Table 3 shows LOB is computationally better and has less space complexity.
Table 3: Complexity comparison of proposed method with EBPS [23]
| Method | Computational complexity | Space complexity |
| EBPS-DSC | O (K (nˆ2) + 3 K1 (nˆ2))
K = no. of slopes (+ve and -ve for DSC) K1 = no. of bit planes 3= bit plane, entropy and again rewriting bit planes n= size of each image |
663KB |
| LOB-DSC | O (K (nˆ2) + nˆ2)
K= no. of input images considered for optimized threshold calculation n= size of each image |
390KB |
Conclusion
A robust Level of Binarization (LOB) method is proposed that successfully separates foreground and background for document images, independent of the type of paper record and type of degradation on the paper. The LOB characteristic curve uses global statistics of scanned or camera captured paper ECG records; hence, it is degradation independent. It is found that even in the presence of degradations like paper crumbling effect, non-uniform illumination, and minor folds the LOB could easily binarize the image. Results show that LOB provides effective separation of background from foreground signal excluding some minor issues in folding.
The proposed LOB-DSC algorithm is also tested over 101 samples of single lead degraded ECG records having different degradations. The average RMS error and accuracy between the extracted digitized signal and ground truth for 101 different cases is 0.01 and 98.34% respectively demonstrating the improvement over EBPS method. The comparison of proposed LOB-DSC with existing ECG extraction methods shows that the accuracy is improved far better by at least 0.06% and RMS error of the proposed method significantly (i.e., at least 7%) reduced compared to most of the existing methods mentioned in the literature. The simple and less complex LOB-DSC algorithm proposed in this work is the most suitable choice for information (signal) extraction from degraded paper ECG records that can be implemented on less computationally efficiently devices available at remote places.
Acknowledgment
The authors would like to thank Saidhan hospital for providing us with the ECG dataset and their help in diagnostics.
Conflict of Interest
There is no conflict of interest
Funding Sources
No funding was involved in the present work.
References
- Biswas, B., Bhattacharya, U., Chaudhuri, B.B.: A global-to-local approach to binarization of degraded document images. In: 2014 22nd International Conference on Pattern Recognition, pp. 3008–3013 (2014). IEEE
CrossRef - Su, B., Lu, S., Tan, C.L.: Robust document image binarization technique for degraded document images. IEEE transactions on image processing 22(4), 1408–1417 (2012)
CrossRef - Khurshid, K., Siddiqi, I., Faure, C., Vincent, N.: Comparison of niblack inspired binarization methods for ancient documents. In: Document Recognition and Retrieval XVI, vol. 7247, p. 72470 (2009). International Society for Optics and Photonics
CrossRef - Sauvola, J., Pietik¨ainen, M.: Adaptive document image binarization. Pattern recognition 33(2), 225–236 (2000)
CrossRef - Swamy, P., Jayaraman, S., Chandra, M.G.: An improved method for digital time series signal generation from scanned ecg records. In: 2010 International Conference on Bioinformatics and Biomedical Technology, pp. 400–403 (2010). IEEE
CrossRef - Mallawaarachchi, S., Perera, M.P.N., Nanayakkara, N.D.: Toolkit for extracting electrocardiogram signals from scanned trace reports. In: 2014 IEEE Conference on Biomedical Engineering and Sciences (IECBES), pp. 868–873 (2014). IEEE
CrossRef - Waits, G.S., Soliman, E.Z.: Digitizing paper electrocardiograms: Status and challenges. Journal of electro cardiology 50(1), 123–130 (2017)
CrossRef - Mitra, S., Mitra, M., Chaudhuri, B.B.: Generation of digital time database from paper ecg records and Fourier transform-based analysis for disease identification. Computers in biology and medicine 34(7), 551–560 (2004)
CrossRef - Gatos, B., Pratikakis, I., Perantonis, S.J.: Adaptive degraded document image binarization. Pattern recognition 39(3), 317–327 (2006)
CrossRef - Chen, Y., Wang, L.: Broken and degraded document images binarization. Neurocomputing 237, 272–280 (2017)
CrossRef - Ntirogiannis, K., Gatos, B., Pratikakis, I.: A combined approach for the binarization of handwritten document images. Pattern recognition letters 35, 3–15 (2014)
CrossRef - Milyaev, S., Barinova, O., Novikova, T., Kohli, P., Lempitsky, V.: Fast and accurate scene text understanding with image binarization and off-the shelf ocr. International Journal on Document Analysis and Recognition (IJDAR) 18(2), 169–182 (2015)
CrossRef - Mishra, S., Khatwani, G., Patil, R., Sapariya, D., Shah, V., Parmar, D., Dinesh, S., Daphal, P., Mehendale, N.: Ecg paper record digitization and diagnosis using deep learning. Journal of Medical and Biological Engineering, 1–11 (2021)
CrossRef - C¨omert, Z., S¸engu¨r, A., Akbulut, Y., Budak, U., Kocamaz, A.F., Bajaj, ¨ V.: Efficient approach for digitization of the cardiotocography signals. Physica A: Statistical Mechanics and its Applications 537, 122725 (2020)
CrossRef - Li, Y., Qu, Q., Wang, M., Yu, L., Wang, J., Shen, L., He, K.: Deep learning for digitizing highly noisy paper-based ecg records. Computers in Biology and Medicine 127, 104077 (2020)
CrossRef - Jayaraman, S., Swamy, P., Damodaran, V., Venkatesh, N.: A novel technique for ecg morphology interpretation and arrhythmia detection based on time series signal extracted from scanned ecg record. Advances in Electrocardiograms-Methods and Analysis, 127–140 (2012)
CrossRef - Kumar, V., Sharma, J., Ayub, S., Saini, J.: Extracting samples as text from ecg strips for ecg analysis purpose. In: 2012 Fourth International Conference on Computational Intelligence and Communication Networks, pp. 317–321 (2012).
CrossRef - Damodaran, V., Jayaraman, S., Poonguzhali, S.: A novel method to extract ecg morphology from scanned ecg records. In: 2011 Defense Science Research Conference and Expo (DSR), pp. 1–4 (2011).
CrossRef - Shi, G., Zheng, G., Dai, M.: Ecg waveform data extraction from paper ecg recordings by k-means method. In: 2011 Computing in Cardiology, pp. 797–800 (2011).
- Chebil, J., Al-Nabulsi, J., Al-Maitah, M.: A novel method for digitizing standard ecg papers. In: 2008 International Conference on Computer and Communication Engineering, pp. 1308–1312 (2008). IEEE
CrossRef - Badilini, F., Erdem, T., Zareba, W., Moss, A.J.: Ecgscan: a method for conversion of paper electrocardiographic printouts to digital electrocardiographic files. Journal of electrocardiology 38(4), 310–318 (2005)
CrossRef - Ravichandran, L., Harless, C., Shah, A.J., Wick, C.A., Mcclellan, J.H., Tridandapani, S.: Novel tool for complete digitization of paper electrocardiography data. IEEE journal of translational engineering in health and medicine 1, 1800107–1800107 (2013).
CrossRef - Patil, R., Karandikar, R.: Image digitization of discontinuous and degraded electrocardiogram paper records using an entropy-based bit plane slicing algorithm. Journal of electrocardiology 51(4), 707–713 (2018).
CrossRef - Li, X.-q., Wang, D., Cui, Q.: Wldf: effective statistical shape feature for cracked tongue recognition. Journal of Electrical Engineering & Technology 12(1), 420–427 (2017)
CrossRef - Wang, P., Hu, X., Li, Y., Liu, Q., Zhu, X.: Automatic cell nuclei segmentation and classification of breast cancer histopathology images. Signal Processing 122, 1–13 (2016)
CrossRef - Jeong, S.-J., Yang, Y.-S., Lee, K., Kang, J.-G., Lee, D.-G.: Vision-based automatic system for non-contact measurement of morphometric characteristics of flatfish. Journal of Electrical Engineering & Technology 8(5), 1194–1201 (2013).
CrossRef

