
Manuscript accepted on :13-10-2022
Published online on: 10-11-2022
Plagiarism Check: Yes
Reviewed by: Dr. Hind Shakir
Second Review by: Dr. Asim Faraz
Final Approval by: Dr. Anton R Kiselev
Shravan R. Shanbhag1, Priyanka Kamath2* and Prasanna Mithra P3
1Department of Urology, Sri Sathya Sai Institute of Higher Medical Sciences, Puttaparthi, Anantapur district, Andhra Pradesh, India.
2Department of Pharmacology, Kasturba Medical College, Mangalore, Manipal Academy of Higher Education, Manipal, India.
3Department of Community Medicine, Kasturba Medical College, Mangalore, Manipal Academy of Higher Education, Manipal, India.
Corresponding Author E-mail: priyanka.kamath@manipal.edu
DOI : https://dx.doi.org/10.13005/bpj/2527
Abstract
Background and Aim The incidence of various cancers including the prostate, is on the rise globally. Prostate cancer is one of the most frequently reported cancer in men worldwide. This study was done to study the correlation of free PSA, percentage free PSA, and PSAD, with prostate biopsy findings, and the role of DRE in screening for carcinoma prostate. Methods The cross-sectional, correlational study was conducted at a tertiary care hospital in Coastal Kerala, over a period of 18 months in a sample size of 100 patients. The following was the study outline followed; Results The prevalence of prostate cancer was found to be 41%, maximum number of patients were in the age group of 50 -70 years of age. Percentage free PSA (%fPSA) and prostate volume were found to vary significantly between patients with Benign Prostate Hyperplasia and prostate cancer. At a cut off of 0.15, PSA density was seen to significantly vary between patients with BPH and prostate cancer. At a cut off of 15% (chosen based on prior studies), %fPSA was seen to significantly vary between patients with BPH and prostate cancer. The sensitivity and specificity of %fPSA were 73.17% and 93.22% respectively. Digital rectal examination varied significantly between patients with benign enlargement and those with malignancy. However, false positive rate with DRE alone was 44.06%. Conclusion DRE continues to be a useful screening technique as a part of clinical examination to identify patients who should undergo further screening for prostate cancer such as PSA estimation, free PSA estimation, and if required, a prostate biopsy, but DRE alone cannot be used to make accurate clinical decision owing to the false positives. Percentage fPSA could be a useful tool that can be used to avoid unnecessary biopsies in patients with a PSA range between 4.0 – 10.0 ng/ml.
Keywords
Free PSA; Percentage fPSA; PSAD; Prostate Cancer
Download this article as:| Copy the following to cite this article: Shanbhag S. R, Kamath P. K, Mithra P. P. Screening for Prostate Cancer: Role of Free Psa, Psad with Prostate Biopsy Findings and Digital Rectal Examination. Biomed Pharmacol J 2022;15(4). |
| Copy the following to cite this URL: Shanbhag S. R, Kamath P. K, Mithra P. P. Screening for Prostate Cancer: Role of Free Psa, Psad with Prostate Biopsy Findings and Digital Rectal Examination. Biomed Pharmacol J 2022;15(4). Available from: https://bit.ly/3DPH006 |
Introduction
The incidence of various cancers including the prostate, is on the rise globally. Prostate cancer is one of the most frequently reported cancer in men worldwide. In India, data from various Population Based Cancer Registries (PBCRs), has shown that prostate cancer is present among the ten most frequently reported cancers across major cities and metros. It is the second most common cancer reported in Delhi, Kolkata, Thiruvananthapuram and Nagpur. According to a latest report, prostate cancer among population above the age of 60 years, was responsible for highest DALYs (Disease Associated Life Years). 1, 2, 3 What is worrisome is the fact that in the last decade, prostate cancer has been seen to be diagnosed or detected at a later stage of the disease, which makes it more difficult to treat. The proportion of cases of carcinoma prostate being detected at a more advanced stage of the disease increased from 3.9% to 8.2% in the past ten years.4
Prostate specific antigen (PSA), a glycoprotein expressed by the prostate tissue, is expressed by normal and malignant cells alike. The measurement of PSA is an important tool to screen for prostate cancer, and also, to assess response to treatment as well as recurrence of cancer. According to a systematic review conducted by the American Cancer Society, the sensitivity of a PSA cut-off of 4.0 ng/mL, was 21% for detecting any prostate cancer, and51% for detecting high-grade cancers.5 A higher PSA level has been seen to be associated with a higher risk of malignancy, high-grade cancer, a higher tumour stage, or even metastases. However, a PSA value above the traditional 4.0 ng/mL cut-off has been seen to detect a cancer on biopsy in only about 25-30% of patients.6
Today, along with an absolute PSA value, other PSA derivatives such as PSA density (PSAD; PSA to prostate volume ratio), PSA velocity (rate of increase of PSA value), age-specific PSA levels, and PSA doubling time are also commonly used. However, since no added advantage over PSA alone has been effectively proven, these derivatives have not yet completely replaced PSA.6 PSA that is not bound to plasma proteins constitutes freePSA (fPSA), which accounts for 5-35% of total PSA. Ratio of fPSA to total PSA is referred to as percentage free PSA, and is yet another predictor of malignancy of theprostate.7
Apart from these, a host of non-FDA approved laboratory tests such as gene fusion tests for urinary biomarkers, Mi-prostate score test, detection of α-methylacyl coenzyme A racemase (AMACR) which is over-expressed in prostate cancer, PTEN gene deletions, PC antigen 3 which is over-expressed in prostate cancer, etc. are being worked upon.7,8 However, these are yet to be validated, and not widely available.9 Therefore, PSA measurement continues to be one of the primary screening tools for prostate cancer. Digital rectal examination (DRE) is a vital component of the examination of the prostate gland. A normal PSA value does not rule out prostate cancer. It has been observed that men with a normal PSA value but an abnormal DRE have been diagnosed with carcinomaprostate.10 This study was done to investigate the correlation of fPSA, percentage fPSA, and PSAD, with prostate biopsy findings, and the role of DRE in screening for carcinoma prostate.
Materials and Methods
The study was conducted at a tertiary care hospital in Coastal Kerala catering a wide variety of both urban and rural patients, over a period of 18 months from 2017 to 2018. This was a cross-sectional, correlational study, and based on past studies, the sample size was calculated to be 100 patients.11 All patients in the age group of 45-75 years, with lower urinary tract symptoms, or those with suspicious findings on DRE were included. Patients with PSA in the range 4-10 ng/ml (both inclusive) were also included. Patients diagnosed with other malignant conditions, patients with severe immunosuppression, severely ill patients and those with painful a no rectal conditions, anal stenosis, acute prostatitis, or known coagulopathies were not included.
Study outline
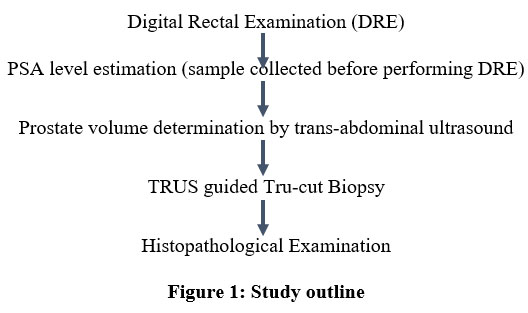 |
Figure 1: Study outline |
Patients were chosen for the study, on the basis of clinical history. Data collected included demographic details of the patients, duration and severity of symptoms (LUTS). If a patient with LUTS symptoms satisfied the inclusion criteria, and was ready to sign the informed consent form, a blood sample was collected for the estimation of PSA and fPSA, before DRE was conducted. Then a DRE was done after explaining the procedure to the patient, and seeking his approval again. PSA levels were estimated from the sample drawn and percentage fPSA was calculated using the formula, %fPSA = fPSA/tPSA x 100. A trans-abdominal USG was done for the measurement of prostate volume. Prostatic volume was measured using ellipsoid formula, Volume = 0.52 x length x height x width.12 PSAD was calculated by the formula, PSAD = PSA/prostatic volume. Finally, a TRUS guided or finger guided Tru-cut Biopsy was done under aseptic conditions and under antibiotic cover for the purpose of histopathological examination. Utmost care was taken so as to not injure the neighbouring rectal mucosa or haemorrhoidal veins while doing the procedure.
Analysis
The collected data was entered in MS-Excel and analysis was done using SPSS, version17.0. For qualitative data, statistical test Chi square was done, and for quantitative data, unpaired Student T-test and ANOVA was done; wherever applicable, Fischer exact test was applied. A p-value < 0.05 was considered as statistically significant.
Ethical considerations
The study was started after permission from the institutional ethics committee (IEC) was obtained. Patients were provided with a patient information sheet in the language that they could read and understand, and in case of patients unable to read, an impartial witness was present. Patients were assigned an identifier code. Personal information like name, address, contact details were not recorded.
Results
As per the sample size calculated, data was collected from 100 patients, and this was available for analysis. Majority of the patients hailed from in and around Cochin and Southern Kerala. Majority of the patients belonged to middle to lower middle class strata; no single occupation predominated. Most of the patients were non-vegetarian.
As a whole study cohort, the mean age of the patients was about 63 years, the mean BMI was 25.04 kg/m2 and the mean haemoglobin (Hb) was 13.22 gm/dl. These baseline characteristics did not vary significantly between the BPH and the prostate cancer group, on applying the Chi-square test.
Table 1A: Baseline Characteristics of Patients.
| Baseline Characteristics of Patients | |
| Age (years) | 62.87 (7.94) |
| Hemoglobin (gm/dl) | 13.22 (1.02) |
| BMI (kg/m2) | 25.04 (3.52) |
All values expressed as Mean (2SD)
Table 1B: Baseline Characteristics of Patients- Benign vs Malignant
| BPH | Ca Prostate | |
| Age (years) | 62.59 (7.74) | 63.26 (8.31) |
| Hemoglobin (gm/dl) | 13.23 (0.92) | 13.20 (1.16) |
| BMI (kg/m2) | 25.06 (2.96) | 25.00 (4.23) |
On digital rectal examination, of the 100 patients, 29 of the patients had a grade I gland of which 20 were later found to be malignant, 26 patients had a grade II enlarged gland of which 15 were non-malignant, 43 patients had a grade III enlargement of which 33 were non-malignant, and only two patients had a grade IV enlarged non-malignant gland. Application of the Chi-Square test showed a significant difference between groups with p value of 0.001.
Of the 60 (60%) hard glands on palpation, 34 were later found to be malignant on biopsy, and of the 40 glands that were firm on palpation, 33 were found to be non-malignant on biopsy. Application of the Chi-Square test showed a significant difference between groups with p value of less than 0.001.
As per the study design, all patients irrespective of the DRE findings went on to have a prostate biopsy done. Of the 100 patients, 41 patients were found to have a prostatic malignancy, and the rest of the patients had a benign enlargement of the prostate gland. Majority of the patients included were aged between 51 to 70 years of age.
Table 2: Age-wise Distribution of BPH and Ca Prostate.
| Age
(years) |
BPH
n (%) |
Ca Prostate
n (%) |
Total patients in the age group
N = 100 |
Percentage (%) in that age group | |
| BPH | Ca Prostate | ||||
| 45 – 55 | 13
(22.03) |
8
(19.51) |
21 | 61.90 | 38.10 |
| 56 – 65 | 26
(44.07) |
19
(46.34) |
45 | 57.78 | 42.22 |
| 66 – 75 | 20
(33.90) |
14
(34.15) |
34 | 58.82 | 41.18 |
| Total | 59 | 41 | 100 | 59 | 41 |
Mean PSA in patients with BPH was found to be 6.8 ng/ml whereas in patients with prostate cancer, it was 7.4 ng/ml. However, the difference between the groups was not found to be statistically significant. Free PSA was estimated in all patients, and percentage free PSA (%fPSA) was then calculated. Mean percentage fPSA was found to be 23.76% in BPH, and 16.65% in Ca Prostate. This difference was found to be statistically significant.
A higher prostate volume was noted in patients with BPH with a mean value of 69.2 cc, whereas a smaller gland was noted in Ca prostate with a mean value of 47.8 cc. This difference in size between the groups was found to be statistically significant. However, no statistical significance was seen between the groups in the mean PSA Density (PSAD), though it was higher in patients with Ca prostate compared to those with a benign enlargement.
Table 3: PSA, %fPSA, Prostate Volume and PSAD Levels in Benign and Malignant Prostate Diseases
| Benign | Malignant | p value | |
| PSA (ng/ml) | 6.8 (1.2) | 7.4 (0.94) | 0.28 |
| Percent fPSA (%) | 23.76 (7.2) | 16.65 (4.6) | <0.05* |
| Prostate volume (ml) | 69.2 (16.5) | 47.8 (10.5) | <0.05* |
| PSAD (ng/ml2) | 0.104 (0.02) | 0.16 (0.03) | 0.851 |
All values expressed as Mean (2SD)
Independent samples t test, with Levene’s test for equality of variances: *= significant, p< 0.05
Volume-wise distribution of the patients based on prostate size meant all four patients who had a large gland measuring more than 90 cc were of a benign nature. Among the 44 patients who had a gland with smaller volume of 30-50 cc, majority of them had a malignant gland. Among the 29 patients who had a gland of 51-70 cc, 22 were found to have a benign enlargement; so also, 21 patients out of 23 who had a gland of 71-90cc had a benign enlargement of the gland. Of the 100 patients, 68 had a PSAD of less than 0.15, of which 57 patients had BPH and the rest had a malignant prostate growth. the remaining patients had a PSAD more than 0.15, of which majority of them (30 out of 32) had prostate malignancy, and only two patients had a benign enlargement. The difference between the groups was found to be highly significant on applying the Chi Square test.
Validity of PSAD, Percentage free PSA and DRE in predicting Ca Prostate
The following parameters were calculated from the 2×2 table, based on the presence or absence of malignancy, and PSAD values in either of these disease states: Sensitivity = 73.17%, Specificity= 96.61%, Positive Predictive Value = 93.75%, Negative Predictive value = 83.82%, False Negative = 26.83%, False Positive = 3.38%
The patients were tested for fPSA from which the percentage free PSA (%fPSA) was calculated. It was noted that 34 patients had a value less than 15%, of which majority of them had Ca prostate (30 out of 34 patients). The remaining 66 patients had a higher level of %fPSA more than 15%, of which majority of them (55 out of 66) had a benign enlargement of the prostate. The following parameters were calculated from a similar 2×2 table, based on the presence or absence of malignancy, and percentage free PSA values in either of these disease states: Sensitivity = 73.17%, Specificity = 93.22%, Positive Predictive value = 88.24%, Negative Predictive Value = 83.33%, False Negative = 26.82%, False Positive = 6.78%.
Similarly for DRE, the results showed: Sensitivity = 82.9%, Specificity = 55.93%, Positive Predictive value = 56.67%, Negative Predictive Value = 82.5%, False Negative = 17.07 %, False Positive = 44.06%
Table 4A: Validity of PSAD in predicting Ca Prostate
|
PSAD (ng/ml2) |
Biopsy |
Total |
|
|
Ca Prostate |
BPH |
||
|
>0.15 |
30 |
2 |
32 |
|
≤0.15 |
11 |
57 |
68 |
|
Total |
41 |
59 |
100 |
Table 4B: Validity of Percentage free PSA in predicting Ca Prostate
|
%fPSA |
Biopsy |
Total |
|
|
Ca Prostate |
BPH |
||
|
≤15% |
30 |
4 |
34 |
|
>15% |
11 |
55 |
66 |
|
Total |
41 |
59 |
100 |
Discussion
This study was conducted with the objective of studying the correlation between the levels of percentage free PSA and PSAD with prostate biopsy findings, in the detection of prostate cancer, and also to assess the role of DRE in screening for carcinoma prostate. An attempt was also made to study how much having a percentage free PSA test done, could avoid unnecessary prostate biopsies.
As most of the patients were non-vegetarian. Hence, a correlation between diet and occurrence of cancer could not be made. Studies in the past have shown that intake of cooked red meat is associated with higher incidence of advanced prostate cancer, while baked poultry was inversely associated with the incidence of prostate cancer.13,14As a whole study cohort, the mean age of the patients was about 63 years, the mean Body Mass index (BMI) was 25.04 and the mean Hb was 13.22 gm/dl. As the baseline characteristics were matched, baseline differences that could have played a confounding role in results was not present.
The yield of any screening test refers to the amount of previously unrecognised disease that is identified and diagnosed following a screening test. Limiting the screening test to be conducted in high-risk population increases the yield of any screening test, for example screening for prostate cancer in men above 50 years of age would have a higher yield than screening conducted in men over 40 years of age.15
Regarding DRE, a study among Irish males who underwent a prostate biopsy despite normal PSA values showed a suspicious in 67% patients, almost similar to our study. They concluded that despite all the advances, DRE could still be considered a very useful screening tool for prostate cancer, and remains so in the primary care setting.16A meta-analysis that included fourteen studies to study the role of DRE as a diagnostic tool for prostate cancer concluded that though DRE had high specificity and negative predictive value, the sensitivity and positive predictive value were low. Hence DRE was not solely enough to make any conclusion, and had to be correlated with further procedures including a biopsy.17 Another study found the positive predictive value (PPV),sensitivity and specificity of DRE for prostate cancer to be 67%, 66.7% and 88.6%respectively, with an accuracy of 82.8%.18,19 The predictive value of PSA in prostate cancer has been found to be 20.6% in patients with PSA between 4-10 ng/ml.20 It has been suggested that predictive value of PSA in prostate cancer at a range between 2-9 ng/ml is doubtful, as it may result in unnecessary biopsies, or even over-diagnosis of clinically insignificant cancer.21
Regarding prostate volume, our results similar to an observation made in an earlier study which concluded that larger the prostate size, lower was the chance of a positive biopsy report. Other studies have also concluded that in patients whose PSA ranges from 2.0 – 9 ng/ml, a smaller prostate volume is one of the strongest predictors of carcinoma prostate. In fact, prostate volume scored over PSA in predicting a positive biopsy.22,23
PSA density (PSAD) is a useful, widely used PSA derivative, that helps make a better clinical decision than PSA level, in patients with a PSA level of 4.0 – 9.0 ng/ml, what is considered as a “gray zone” in prostate cancer diagnosis.24,25 Earlier studies have found that the mean PSAD values significantly differ between patients with BPH and prostate cancer. At a cut-off value of 0.15, the sensitivity was seen to be 81%, the specificity was seen to be 69%, and false negative results in patients with 4-9 ng/ml is 18.5%,26 and has been suggested that PSAD is superior to percentage fPSA in predicting prostate cancer.26 A combination of PSAD, DRE and PSA velocity was found to predict prostate cancer better, and reduce the number of unnecessary prostate biopsies.28
Strengths and Limitations
Our study had certain strengths as well as limitations. The hospital where this study was conducted is a large, tertiary referral centre with a high patient-load each day. Though there are abundant population based studies on various aspects of prostate cancer among Western and African-American population, such studies among the Indian population are scanty. Also, India itself has multiple ethnicities, which could determine the occurrence, prevalence, and progression of any disease, including cancer. Digital rectal examination was one of the parameters in our study. There could be a degree of inter-examiner variability with DRE, however this difference would be present in almost all studies that involve DRE. Yet, the concordance of examination findings with biopsy findings and with previously reported data is reassuring.
It is worthwhile to note that both PSAD and %fPSA as screening tests, are more specific than sensitive for prostate cancer, meaning both tests would be helpful in correctly identifying patients without prostate cancer, and, the percentage of people without prostate cancer testing positive with these screening tests would be low- this could be useful in avoiding unnecessary prostate biopsies. This is similar to an earlier study finding. 29
Conclusion
In our study, the percentage free PSA (%fPSA) and prostate volume were found to vary significantly between patients with BPH and prostate cancer. At a cut off of 0.15, PSA density was seen to significantly vary between patients with BPH and prostate cancer. The PSAD could correctly predict prostate cancer in 73.17% patients with prostatecancer, with a predictive value of 93.75%.At a cut off of 15% (chosen based on prior studies), %fPSA was seen to significantly vary between patients with BPH and prostate cancer. The sensitivity and specificity of %fPSA were 73.17% and 93.22% respectively which meant only 6.78% patients who did not have carcinoma prostate, had a %fPSA less than15%.Digital rectal examination varied significantly between patients with benign enlargement and those with malignancy. However, false positive rate with DRE alone was 44.06%, hence DRE alone cannot be used to make accurate clinical decision. Yet, DRE continues to be a useful screening technique as part of clinical examination to identify patients who should undergo further screening for prostate cancer such as PSA estimation, free PSA estimation, and if required, a prostate biopsy. Percentage fPSA could be a useful tool that can be used to avoid unnecessary biopsies in patients with a PSA range between 4.0 – 10.0 ng/ml.
References
- GLOBOCAN 2020: New Global Cancer Data. Union for International Cancer Control. [Available from https://www.uicc.org/news/globocan-2020-new-global-cancer-data#] Last accessed 11 OCT 2022.
- Jain S, Saxena S, Kumar A. Epidemiology of prostate cancer in India. Meta Gene 2 2014;596–605.
CrossRef - Kulothungan V, Sathishkumar K, Leburu S, et al. Burden of cancers in India – estimates of cancer crude incidence, YLLs, YLDs and DALYs for 2021 and 2025 based on National Cancer Registry Program. BMC Cancer 22, 527 (2022). https://doi.org/10.1186/s12885-022-09578-1
CrossRef - Siegel RL, Miller KD, Fuchs HE, et al. Cancer statistics, 2022. CA Cancer J Clin 2022;72:7–33
CrossRef - Adhyam M, Gupta AK. A Review on the Clinical Utility of PSA in Cancer Prostate. Indian J SurgOncol 2012;3(2):120–9.
CrossRef - Gaudreau P, Stagg J, Soulières D, Saad F. The Present and Future of Biomarkers in Prostate Cancer: Proteomics, Genomics, and Immunology Advancements. Biomarkers in Cancer 2016;8(S2):15–33
CrossRef - Saini S. PSA and beyond: alternative prostate cancer biomarkers. Cell Oncol (Dordr). 2016;39(2):97–106.
CrossRef - Gaudreau P, Stagg J, Soulières D, Saad F. The Present and Future of Biomarkers in Prostate Cancer: Proteomics, Genomics, and Immunology Advancements. Biomarkers in Cancer 2016;8(S2):15–33
CrossRef - Prensner JR, Rubin MA, Wei JT, Chinnaiyan AM. Beyond PSA: The next generation of prostate cancer biomarkers. SciTransl Med. 2012 March 28; 4(127): 127rv3. doi:10.1126/scitranslmed.3003180.
CrossRef - Walsh AL, Considine SW, Thomas AZ, Lynch TH, Manecksha RP. Digital rectal examination in primary care is important for early detection of prostate cancer: a retrospective cohort analysis study. British Journal of General Practice 2014; DOI:10.3399/bjgp14X682861
CrossRef - Murray NP, Reyes E, Orellana N, Fuentealba C, Dueñas R. A Comparative Performance Analysis of Total PSA, Percentage Free PSA, PSA Velocity, and PSA Density versus the Detection of Primary Circulating Prostate Cells in Predicting Initial Prostate Biopsy Findings in Chilean Men. BioMed Research International 2014; 676572: http://dx.doi.org/10.1155/2014/676572
CrossRef - Tyloch JF, Wieczorek AP: The standards of an ultrasound examination of the prostate gland. Part 2. J Ultrason 2017; 17: 43–58.
CrossRef - Lin P, Aronson WA, Freedland SJ. Nutrition, dietary interventions and prostate cancer: the latest evidence. BMC Medicine 2015;13:3. doi 10.1186/s12916-014-0234-y
CrossRef - Sonn GA, Aronson W, Litwin MS. Impact of diet on prostate cancer: a review. Prostate Cancer Prostatic Dis. 2005;8(4):304-10.
CrossRef - Screening for Disease. In, Park’s Texbook of Preventive and Social Medicine, 24th edition. Jabalpur, BanarsiBhanot Publishers; 2017.p148-50.
- Walsh AL, Considine SW, Thomas AZ, Lynch TH, Manecksha RP. Digital rectal examination in primary care is important for early detection of prostate cancer: a retrospective cohort analysis study. The British Journal of General Practice 2014;64(629):e783–e787.
CrossRef - Hoogendam A, Buntinx F, de Vet HCW. The diagnostic value of digital rectal examination in primary care screening for prostate cancer: a meta-analysis. Family Practice 1999;16(6):621–6.
CrossRef - Manyahi JP, Musau P, Mteta AK. Diagnostic values of digital rectal examination, prostate specific antigen and trans-rectal ultrasound in men with prostatism. East Afr Med J. 2009;86(9):450-3.
CrossRef - Palmerola R, Smith P, Elliot V, Reese CT, Mahon FB, Harpster LE. The digital rectal examination (DRE) remains important – outcomes from a contemporary cohort of men undergoing an initial 12-18 core prostate needle biopsy. Can J Urol. 2012;19(6):6542-7.
- Vukotic V, Cerovic S, Kozomara M, Lazic M. The predictive value of PSA in diagnosis of prostate cancer in non-screened population. ActaChirIugosl. 2005;52(4):81-7.
CrossRef - Bonn D. Predictive value of PSA in prostate cancer is doubtful. The Lancet Oncology 2002;3(3):130.
CrossRef - Al-Azab R, Toi A, Lockwood G, Kulkarni GS, Fleshner N. Prostate volume is strongest predictor of cancer diagnosis at transrectal ultrasound-guided prostate biopsy with prostate-specific antigen values between 2.0 and 9.0 ng/mL. Urology. 2007;69(1):103-7.
CrossRef - Kobayashi T, Mitsumori K, Kawahara T, Nishizawa K, Ogura K, Ide Y. Prostate gland volume is a strong predictor of biopsy results in men 70 years or older with prostate-specific antigen levels of 2.0-10.0 ng/mL.Int J Urol. 2005;12(11):969-75.
CrossRef - Rai S, Pavan N, Soodana-Prakash N, Nahar B, Dong Y, Satyanarayana R et al. Defining the optimal PSA range for the maximal predictive efficacy of PSA density to detect prostate cancer on biopsy: Results from a multi-institutional and prospective contemporary cohort. Journal of Clinical Oncology 2016;34(2)70-70.
CrossRef - Aminsharifi A, Howard L, Wu Y, De Hoedt A, Bailey C, Freedland SJ et al. Prostate-specific antigen density as a predictor of clinically significant prostate cancer when the PSA level is in the diagnostic “grey-zone”: Defining the optimum cut-point stratified by race and body mass index. J Urol. 2018;pii:S0022-5347(18)43126-6.
- Aksoy Y, Oral A, Aksoy H, Demirel A, Akcay F. PSA Density and PSA Transition Zone Density in the Diagnosis of Prostate Cancer in PSA Gray Zone Cases. Annals of Clinical & Laboratory Science 2003;33(3):320-23.
- Chen CS, Wang SS, Li JR, Cheng CL, Yang CR, Chen WM, et al. PSA density as a better predictor of prostate cancer than percent-free PSA in a repeat biopsy. Journal of the Chinese Medical Association 2011;74(12):552-5.
CrossRef - Okada K, Okihara K, Kitamura K, Mikami K, Ukimura O, Kawauchi A, et al. Community-based prostate cancer screening in Japan: Predicting factors for positive repeat biopsy. International Journal of Urology 2010;17:541–47.
CrossRef - Tadayon F, Arezegar HR, Khorrami MH, Juzdani HR, Shahdoost AA, Mellat M.Evaluation of prostatic cancer prevalence in patients with prostatic-specific antigenbetween 4 and 10 and normal digital rectal examination. Adv Biomed Res. 2016; 5: 112.
CrossRef

