
Manuscript accepted on :29-09-2022
Published online on: 24-11-2022
Plagiarism Check: Yes
Reviewed by: Dr. Sohayla Mohamed Elsherbini Attalla
Second Review by: Dr. Randa Salah Gomaa
Final Approval by: Dr. Jihan Seid Hussein
Ruchi Yadav , Akanksha Sharma and Jyoti Prakash
Amity Institute of Biotechnology, Amity University Uttar Pradesh, Lucknow -226028, U.P., India.
Corresponding Author E-mail: jprakash@lko.amity.edu
DOI : https://dx.doi.org/10.13005/bpj/2538
Abstract
Brain is one of the most intricate organs in the human body that works with billions of cells. A brain tumor emerges when there is uncontrolled division of cells shaping a strange gathering of cells around or inside the cerebrum. To understand the complexity of brain function and gene expression in different regions of brain is most challenging and crucial. RNAseq techniques along with computational analysis has made this task much easier and accurate. In this current research RNAseq data of brain regions have been used to predict functional genes in different regions of brains. Differential expression of genes in different regions of brain highlights the function of genes and associated pathways in brain function. The aim of this study was to identify differentially expressed gene in the brain tumor samples. RNA-seq data was retrieved from ENA database with the accession no.- PRJNA294929. Total 5 samples were retrieved in fastq format, out of which 4 samples were of corpous callosum and 1 sample was of frontal cortex. Differentially Expressed Genes (DEG) analysis was done using Galaxy platform and R software, functional enrichment of DEGs was done using DAVID and GO databases. The RNA-seq data analysis shows the up regulation of PHGDH, TUBB4A, HSPA2, GFAP, NKX3-1, COX3 genes and three genes PHGDH, COX3 and MT3 shows significant difference in their gene expression. This result can have importance in understanding the complexity of brain transcriptomics and DEGs can be further studied to evaluate their expression in brain cells and associated diseases. Further wet lab verification is required as these genes can be used as potential drug target and can be used for drug designing for brain tumor.
Keywords
Brain cancer; DEG analysis; Galaxy Server; RNAseq; R and Bioconductor
Download this article as:| Copy the following to cite this article: Yadav R, Sharma A, Prakash J. Prediction and Identification of Signature Genes Expressed in Different Brain Regions through RNA-Seq Data Analysis. Biomed Pharmacol J 2022;15(4). |
| Copy the following to cite this URL: Yadav R, Sharma A, Prakash J. Prediction and Identification of Signature Genes Expressed in Different Brain Regions through RNA-Seq Data Analysis. Biomed Pharmacol J 2022;15(4). Available from: https://bit.ly/3VljRd9 |
Introduction
The Brain is one of the most complex, multifunctional, sensitive organs in the human body that coordinates with billions of nerves and cell and respond to different signals like environmental, stress etc. Brain has very complex structure that is composed of Cerebrum, cerebellum and brain stem which is protected by skull 1. To understand the gene expression in brain in its various region is very important to uncover complex functioning of brain at the molecular level. A brain tumor emerges when there is uncontrolled division of cells shaping a strange gathering of cells around or inside the cerebrum. 2 That gathering of cells can influence the typical usefulness of the cerebrum action and decimate the solid cells. Cerebrum tumors ordered to generous or second rate (grade I and II) and harmful tumors or high (grade III and IV). Benign tumors are non-progressive (non-cancerous) so considered to be less aggressive, they originated in the brain and grows gradually. Nonetheless, threatening tumors are dangerous and develop quickly with vague limits they can be started in the brain itself which is called essential malignant tumor, or it is initiated somewhere else in the body and spread to the cerebrum which is called auxiliary harmful tumor. 3
Primary brain tumors represent more than 100 diverse tumor types with broadly unique sciences and clinical results, however these neoplasms often present comparable difficulties to neuro-oncologists. Dangerous gliomas are the most well-known sort of essential characteristic cerebrum tumor in grown-ups and remain incredibly deadly. Current norm of-care treatments for these diseases incorporate a medical procedure, radiation and palliative cytotoxic, which have critical results and restricted adequacy.4 Advances in our comprehension of the atomic underpinnings of malignancy have prompted focused on sub-atomic treatments that may allow improvement in helpful adequacy and diminished harmfulness; these treatments, nonetheless, still face numerous difficulties.5
Signal transduction pathways that are improperly directed in cerebrum diseases incorporate development factors and their receptors (for example epidermal development factor receptor, vascular endothelial development factor receptor and platelet-determined development factor receptor), which manage cell co-operations with the microenvironment and intracellular oncogenic pathways.6 Monoclonal antibodies may have more prominent explicitness, yet face conveyance limitations preferential tumor delivery of chemotherapies, conjugated toxins and radioisotopes has been achieved through convection-enhanced delivery, intra tumoral implants and intra-arterial infusion.7 Regardless of these advances, not many atomically focused on treatments have shown critical antineoplastic action for an expansive scope of patients conceivably because of tumor and patient heterogeneity. It is plausible, in any case, that focused treatments will be best in blend either with each other or with cytotoxic treatments.8
Despite ongoing advances in molecular diagnostics and current individual treatment, most patients experiencing glioma actually face restricted endurance. Wide proof exists that other than age, adjuvant radio-chemotherapy, the degree of surgical tumor resection significantly affects patients’ endurance.9 In any case, patients experiencing gliomas that attack the corpus callosum infrequently go through careful tumor resection. These tumors are viewed as more forceful because of corpus callosum attack and dissemination to both hemispheres. 10
Neurodegenerative illnesses are the maximum predominate brain disorders around the globe and the affected populations are hastily increasing. lately, these diseases had been addressed the usage of the facts acquired from RNA-sequencing technology to reveal the changes in gene/transcript expression, impact of variants, and pathways concerned in sickness mechanisms.11 The corpus callosum is the biggest inter hemispheric commissure giving an association between homologous cortical territories. Consequently, authorized coordination of cerebral handling between the two halves of the globe is ascribed to the corpus callosum, upheld by the perception of expanded corpus callosum size in people equipped for finishing complex undertakings and in people with less social laterality. Recently, left mind arranged people, being believed to be more lateralized because of the regular ipsilateral area of language. 12
High-throughput sequencing technology is swiftly turning into the exceptional method for measuring RNA expression stages also referred to as RNA-seq. The advent of fast sequencing technology together with reduced prices has enabled detailed profiling of organic phenomenon ranges, impacting almost each area in lifestyles sciences and is now being adopted for scientific use. 13 RNA-seq technology permits the specific identity of gene isoforms, translocation events, and nucleotide versions and put up-transcriptional base changes. One many of the most dreams of these experiments are to spot the differentially expressed genes in two or more situations. 14
Differential gene expression analysis of RNA-seq records usually includes 3 components: normalization of counts, parameter estimation of the statistical version and checks for differential expression. Finding genes which are differentially expressed among situations is a critical part of understanding the molecular basis of phenotypic version. From decades, DNA microarrays were used notably to quantify the abundance of mRNA corresponding to different genes but with advancement in sequencing technologies and computational algorithms to solve complex biological problem excessive-throughput sequencing of cDNA (RNA-seq) has emerged as a robust competitor 15. Since, in Microarray technology quantification of gene expression is measured based on fluorescent signals, there is huge chance of accumulation of errors in microarray result. Comparisons between different microarray result is also difficult since variation in gene expression can arise due to biasness in fluorescent dyes, laser scanners etc. Along with these limitation, computational analysis of microarray data is also very tedious and time taking, and several samples cannot be compared.
With the emergence of technique where transcripts can directly be measured without there dependency on fluorescent probes and laser scanners, has made RNAseq technology as most promising tool to study transcriptome. RNAseq technique can be used to compare several samples and to identify differentially expressed genes without any biasness. Most important factor that makes RNAseq as more efficient tool to study gene expression than traditional approach is that RNAseq can be used to identify novel genes and even minimally expressed genes can also be identified. Since, high throughput technologies like genome seq, exome seq, ChIpSeq, RNAseq are dependent on sophisticated and sensitive software’s efficient tools has been developed to analyze these results. Huge number of computational techniques have been evolved for studying differential gene expression in RNA-seq records. In current research R and Bioconductor software’s, Galaxy tools along with functional databases like Gene Ontology database, KEGG pathways database, were used for extensive RNAseq analysis of samples under study. These tools and software’s were used for current research that is discussed further in materials and method section.
Materials and Methods
RNA-Seq Data retrieval
The RNA-Seq data was retrieved in the fastq format from European Nucleotide Archive (ENA) database (https://www.ebi.ac.uk/ena/browser/home ). The samples were of human brain from frontal cortex (fc) and corpus callosum (cc) (Accession ID-PRJNA294929 https://www.ebi.ac.uk/ena/browser/view/PRJNA294929?show=reads ). Five samples were selected for current study in which 4 samples were of corpus callosum (cc) and 1 sample was of frontal cortex (fc) selected samples along with their run accession has been shown in table 1. RNA-seq used in this data has been done using illumina platform. Current data has been selected based on several factors like importance of RNAseq in understanding brain function, availability of data, recent trends in research in transcriptomics studies.
Table 1: List of selected samples used for RNA-Seq data analysis. These samples were retrieved from ENA database with Accession ID-PRJNA294929.
| S.No. | Run Accession | Sample Accession | Sample type | Sample name |
| 1. | SRR12245803 | SAMN15558300 | corpus callosum | cc |
| 2. | SRR12245804 | SAMN15558299 | corpus callosum | cc |
| 3. | SRR12245805 | SAMN15558298 | corpus callosum | cc |
| 4. | SRR12245806 | SAMN15558297 | corpus callosum | cc |
| 5. | SRR12245807 | SAMN15558296 | frontal cortex | fc |
Software’s/ Tools and Databases
R software version 4.0.2 16 along with Bioconductor packages were used for RNA-Seq analysis. R is a programming language most widely used for statistical computing and graphical visualization of large datasets. It is user friendly programming language which can be used for high throughput data analysis of various genomics and proteomics experiment. Bio-conductor (http://bioconductor.org/) provides various packages that are most widely used for experimental data analysis like microarray, RNA Seq, NGS analysis etc. Bioconductor is a project based on and extending R that provides tools for bioinformatics analysis, visualization, comparison, statistical analysis etc. of huge datasets. In this study various packages like Rsamtools version 3.12, Genomic Alignments version 3.12, Variant Annotations version 3.12, DESeq2 version 3.12, Annotate version 3.12, GO.db version 3.12 were used at different steps of RNA-Seq analysis. 17-19
Galaxy tools
(https://usegalaxy.org/) were also used for RNA-Seq analysis. Various tools like FastQC, Trimmomatic, RNA Star, MULTIQC, Free Bayes, Feature counts, DESeq2, Deeptools, plotPCA, compute Matrix, plot heatmap, AnnotateMyId were used for prediction of Differentially expressed genes and functional annotation of genes 20.
Firstly, quality control analysis was done using FastQC tool of Galaxy server that generates several plots and quality estimation values which used to verify suitability of data for current study. Secondly, preprocessing of samples was done using trimmomatic tool which is used to trim reads sequence to remove adapter contamination and improve the quality of reads files for further analysis. Reads sequence were mapped to reference genome using RNA star tool and variants were also identified using Free Bayes tools of Galax server. Lastly, Differential gene expression analysis was done using DESeq2 Bioconductor package and DESeq2 tool of Galaxy also for verification and confirmation of results that is explained in detailed in result section. Functional analysis of predicted genes was done using online databases and genes were studied using references and literatures. Different databases like Gene Ontology, David database, KEGG pathway databases were used for functional enrichment of genes.
Functional Enrichment of Differentially Expressed Genes was done using
Database for Annotation, Visualization, and Integrated Discovery (DAVID) database (https://david.ncifcrf.gov/) and Gene Ontology (GO) database (http://geneontology.org/). Galaxy server tools and R software were used to find the differentially expressed genes in the brain tumor samples and results were compared for final analysis and interpretation of results. The methodology used for RNA-Seq analysis has been shown in figure 1 this methodology has been partly adopted from workflow for RNA-Seq analysis provide by Galaxy server (https://training.galaxyproject.org/training-material/topics/transcriptomics/tutorials/ref-based/tutorial.html).
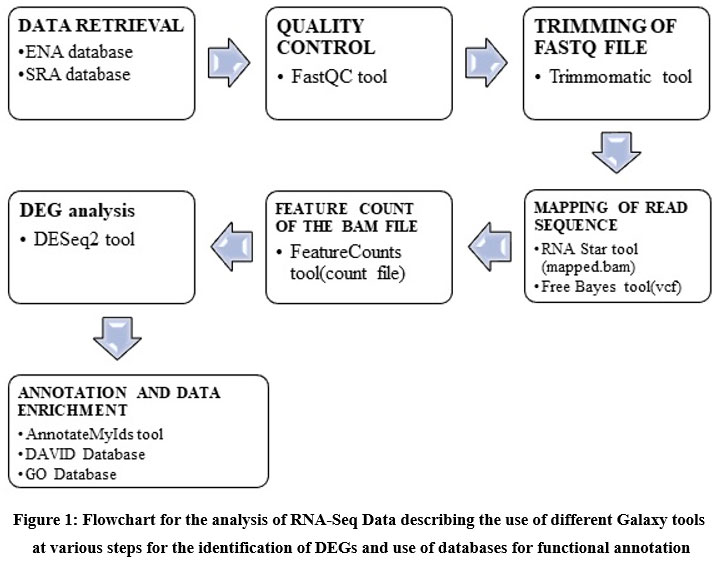 |
Figure 1: Flowchart for the analysis of RNA-Seq Data describing the use of different Galaxy tools at various steps for the identification of DEGs and use of databases for functional annotation. |
The raw RNA-seq data was downloaded and uploaded at galaxy server in fastq format. To estimate the quality control of the sequence FASTQC tool 21 was performed. Trimming of raw files was done before any statistical and mapping analysis to increase the quality and reliability of the results. Trimming filters, the low-quality regions of the reads sequence and preserves the high-quality portions of the reads sequence after FastQC Trimmomatic tool was used for trimming.
Alignment of read sequence to reference genome (mapping)
For mapping the read sequence to the reference genome (hg19) RNA Star 22 tool was used. After performing RNA Star as an output, STAR log file, splice juctions.bed file and mapped.bam file was generated. To aggregate the RNA Star results MultiQC was performed and visual analysis was done using Integrative Genomics Viewer (https://software.broadinstitute.org/software/igv/ ) and the UCSC genome browser (https://genome.ucsc.edu/) . Then VCF file (Variant Calling Format) was generated using Free Bayes 23 tool. Similarly, analysis was also done using Rsamtools package 24 which reads the bam file in R software for further analysis. Variant Annotation package of R and Bioconductor was used for annotation of variants obtained from VCF file. Further annotations of these variants were done using the vcf file generated through Free Bayes tool.
Genomic Alignments package was used for alignment of RNA-Seq data with genomic sequence. It provides efficient alignemtn file for storing and manipulating short genomic alignments (typically obtained by aligning short reads to a reference genome). The result file includes, read counting, coverage value and junction detection, between RNA-Seq and genomic sequence
Feature Count of the bam file the alignment produces binary alignment map file (BAM) where there is read alignment for each file. The mapped reads (mapped.bam) were used to identify number of same reads sequence using feature Counts tool and this tool is also used for annotation by using in-built annotations for human (hg19). It produces a count, summary and a length file that describes the number of reads sequence that are aligned to same genes etc. After doing feature counts of the bam file MultiQC was performed for combining all the counts result into one file 25.
Differentially expressed genes (DEG) analysis between corpus callosum (cc) and frontal cortex (fc)
Differentially expressed genes are the genes that show observable difference in their expression levels/ index or in read counts. This comparison can be used between the set of experimental conditions and DEGs can be identified that have statistical and biological significance. DESeq2 was used for DEG prediction and statistical analysis. FeatureCounts file was used as an input for DESeq2 tool. After DESeq2 tool deeptools tool like PCA and heatmap plot were generated for visualization and statistical analysis of DEGs. Heatmap was also generated by using SummaryBam tool and plot heatmap tool of galaxy 26.
The heatmap gives an overview of similarities and dissimilarities between samples: the color represents the distance between the samples. Also, the DEG’s are expressed in the plot. PCA plot is useful for visualizing the overall effect of experimental covariates and batch effects.
DESeq2 package of R and Bioconductor was also used for the prediction of DEGs and results were compared with the Galaxy tools for verification and confirmation of list of DEGs. Functional enrichment of DEG’s was done for biological intervention and pathway analysis. Annotation of the DESeq2 result was done using annotateMyId tool. Likewise, in R software annotations of the identified DEG’s was done using Annotate and GO.db package. Annotated list was then searched in the DAVID and Gene Ontology database for functional analysis.
Results and Disscussion
Quality control analysis
The quality of RNA-Seq data plays a crucial role particularly in sequence assembly and gene expression studies. The FastQC tool provides a raw data and a HTML output file which include basic statistics, sequence count, per sequence quality scores, sequence length distribution, mean quality scores, status check, per base N content, sequence duplication level, sequence GC content, overrepresented sequence, adaptor content.
FastQC compares actual and estimated scores of all parameters and highlights problematics area, pass parameters, and area of concern. All samples’ files used for this study were subjected to FastQC tools with default parameters as in Galaxy server. All the samples’ files pass the quality parameters when compared to actual parameters as mentioned in FastQC tool. This result shows that all files can be used for further analysis. To compare FastQC all results were compiled and compared using MultiQC tool.
Binary Alignment Mapping Analysis (BAM) and BAI (index) file of cc and fc was read in R software through which output file was obtained. Result genomic alignment positions across all the files across human genome. Genome visualization of the binary alingment map file and variant file was done using the UCSC browser and Integrative Genomics Viewer as shown in figure 2 for all the corpous callosum samples.
 |
Figure 2: IGV window showing variants of all the corpous callosum sample. |
Figure 2 shows the variation in the samples, red lines mean alternative allele whereas blue lines mean reference allele. The light blue line in the figure 2 means homozygous variants and dark blue lines means heterozygous variants. Similarly, VCF analysis was also done for fc samples.
Variation in PHGDH gene was identified in the VCF results analysis and visualized using UCSC genome browser. This alignment shows that the variation of PHGDH gene was located on chromosome 1(chr1). 3 set of variation was shown, out of which CAAGAAGG-GAATTCTC and GATCAT-TCTCGG was synonymous variant. Variant alignment of NRCAM gene was also identified which shows that the variation of NRCAM gene located on chromosome 7(chr7) only one set of variation was shown A-T which was a missense variant. Variant alignment of NKX3-1 gene was also identified which shows variation of NKX3-1 gene located on chromosome 8(chr8) one variation was identified CTC-ATT which was a missense variant.
Variant analysis was also done using Variant Annotation package of Bioconductor. VCF text files contain meta-information lines, a header line with names of column, data lines with information about a genome position, and optional genotype information on samples for each position. Data was imported and explored by using various commands of Variant Annotation package. Header information was extracted by using header () for the genomic positions row Ranges () was performed, which gives the information of the VCF file such as chromosome, position, ID fields. Location of the variants in and around the genes was done using locate Variant () method of Variant Annotation package. Result shows that 93 reads sequences were found from hg 19 in all the regions using All Variants () command.
Bam file was used to count both gDNA-seq and RNA-seq reads for genomic features in in SAM/BAM files. Aggregate results of all the count files were unmapped or unassigned. In frontal cortex sample, there is large number of unmapped genes whereas compared to all other corpus callosum sample, they have comparatively less unmapped genes.
DESeq2 tool was used for DEG analysis, count table generated from the feature Count was used for DEGs prediction. Figure 3 shows the estimation of variance-mean dependence from high throughput RNA-Seq data. The blue colored dot shown in the plot represents the corpus callosum dataset whereas the red colored dot represents the dataset of frontal cortex.
 |
Figure 3: Plot with the first 2 dimensions from a principal component analysis (PCA) run on the normalized counts of the samples. |
DESeq2 tool generates three output i) normalized count for each gene in the sample ii) A graphical summary of the results and iii) a summary file for each gene which includes gene ID, log of fold change, mean of normalized counts, the p- value, p- value adj. Figure 4 shows the heatmap of sample-to-sample distance matrix that was generated using normalized count file. Heatmap gives the overall similarities and dissimilarities between the sample. The dark blue color represents shorter distance and dark blue color shows that maximum distance in gene expression between the samples.
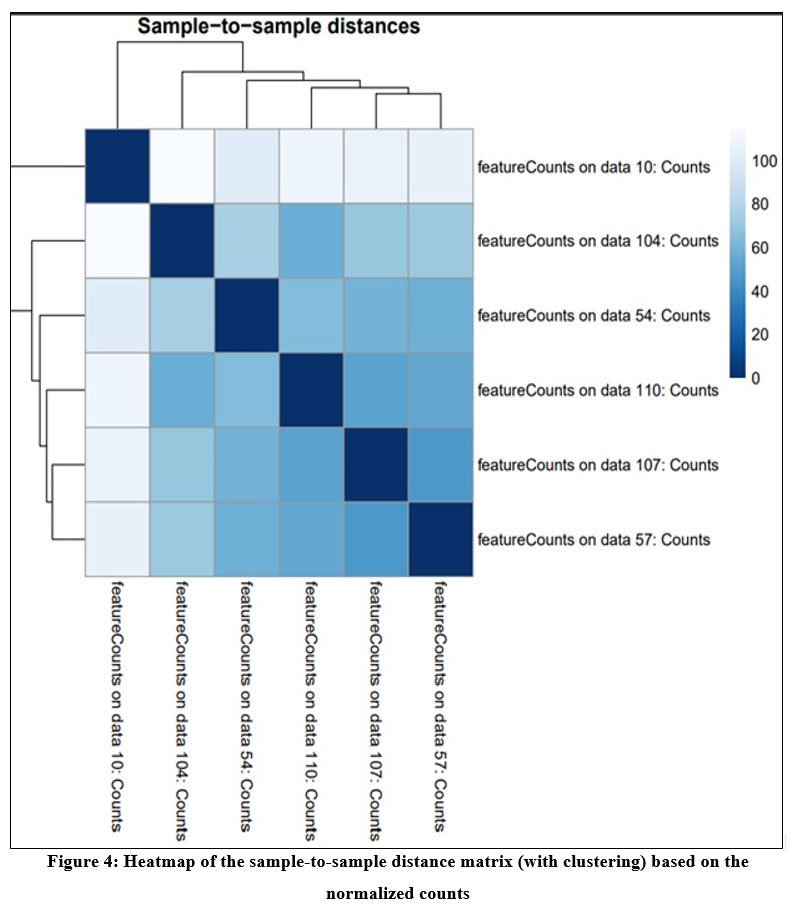 |
Figure 4: Heatmap of the sample-to-sample distance matrix (with clustering) based on the normalized counts |
Dispersion plot was also visualized to study the amount of variation between the samples as shown in figure 5. The amount of shrinkage can be analyzed depending on the size of the sample, the number of coefficients, the mean of the row and the variability of the gene-wise estimates.
 |
Figure 5: Plot showing dispersion estimation of the mean of the normalized counts |
The MA plot (M: log ratio and A: mean average) was shown in figure 6 MA plot represents the log of fold change v/s mean of the normalized count. MA plot analysis shows that no significant genes were regulated in the range -2 to +2. The prominent result was shown in the range -4 to -8 for down regulating genes represented by the red dots in the lower half of the plot. Whereas number of up-regulating genes was present in the range +4 to +6 represented by the red dots in the upper half of the plot.
 |
Figure 6: MA plot for the brain sample displaying the fold change compared with the mean of normalized counts using DESeq2 dataset. |
Figure 7 is a PCA plot in which the colored triangular symbols shown in figure 7(a) represents sample datasets for corpus callosum, and the black encircled red dot symbol in the extreme top represents the frontal cortex sample dataset. The presence of the sample to the extreme ends of the PCA plot suggest that the sample (a) shows up-regulation of the genes whereas sample (b) present at the extreme end showing negative i.e., the down regulation of the genes.
 |
Figure 7: Principal Component Analysis plot of the BAM file (a)-fc sample (b)-cc sample |
Table 2 shows that list of DEGs and with statistical value. The top ten differentially expressed genes as mentioned in table 2 are downregulated. Here 406976(MIR199A1) gene have the lowest log (FC) value i.e. -8.17583 with p-value is 1.15. Here the quantity of the cellular component is highly decreased in gene 406976 having p-value 1.15.
Table 2: List of genes that are down regulated identified from DESeq2 tool.
| S.No. | GeneID | Gene Symbol | Base mean | log2(FC) | P-value | P-adj |
| 1. | 406976 | MIR199A1 | 134.7481 | -8.17583 | 1.15 | 4.97 |
| 2. | 407046 | MIR9-1 | 1464.733 | -7.99506 | 7.72 | 8.30 |
| 3. | 407016 | MIR26A2 | 4865.168 | -6.98217 | 2.67 | 8.22 |
| 4. | 221416 | C6of223 | 26.7866 | -6.3913 | 1.76 | 0.00236 |
| 5. | 147645 | VSIG10L | 34.18684 | -6.3025 | 2.78 | 0.00314 |
| 6. | 4508 | MT-ATP6 | 1872.292 | -5.99295 | 5.12 | 8.30 |
| 7. | 10678 | B3GNT2 | 77.67828 | -5.94884 | 9.98 | 0.00165 |
| 8. | 100463488 | MTRNR2L10 | 13.60611 | -5.91548 | 8.00 | 0.00748 |
| 9. | 4509 | MT-ATP8 | 608.1554 | -5.79919 | 5.05 | 3.62 |
Table 3 shows the up-regulating genes out of which according to the research (26227) PHGDH, (4504) MT3, TUBB4A (10382), were the gene that were related to the cancer-causing pathway.
Table 3: List of genes that are up regulated.
| S.No | GeneID | Gene symbol | Base mean | log2(FC) | P-value | P-adj |
| 1. | 2670 | GFAP | 302.5479 | 5.158 | 2.15 | 0.002722 |
| 2. | 5375 | PMP2 | 12.44252 | 5.084986 | 0.00025 | 0.109701 |
| 3. | 5354 | PLP1 | 164.288 | 4.508557 | 3.46 | 0.00372 |
| 4. | 4504 | MT3 | 7.836866 | 4.450029 | 0.002015 | 0.447217 |
| 5. | 26227 | PHGDH | 8.361677 | 4.372021 | 0.00276 | 0.558348 |
| 6. | 4155 | MBP | 56.86065 | 4.354631 | 1.55 | 0.012603 |
| 7. | 64850 | ETNPPL | 6.317752 | 4.092463 | 0.005625 | 0.807203 |
| 8. | 6271 | S100A1 | 5.422727 | 4.061078 | 0.005199 | 0.772229 |
| 9. | 10382 | TUBB4A | 5.933693 | 3.985739 | 0.007065 | 0.916193 |
| 10. | 2861 | GPR37 | 5.083396 | 3.965473 | 0.00628 | 0.872134 |
| 11. | 26084 | ARHGEF26 | 5.252485 | 3.958184 | 0.006936 | 0.914496 |
The PHGDH gene provides instructions for making the parts (subunits) that make up the phosphoglycerate dehydrogenase enzyme. The enzyme converts a substance called 3-phosphoglycerate to 3-phosphohydroxypyruvate in the first step in serine production. Serine is necessary for the development and function of the brain and spinal cord (central nervous system)27.
Serine is a part of chemical messengers called neurotransmitters that transmit signals in the nervous system. Proteins that form cell membranes and the fatty layer of insulation (myelin) that surrounds many nerves also contain serine. It can be obtained from the diet, but brain cells must produce their own serine because dietary serine cannot cross the protective barrier that allows only certain substances to pass between blood vessels and the brain (the blood-brain barrier).28 The lack of serine likely prevents the production of proteins and neurotransmitters in the brain and impairs the formation of normal cells and myelin. These disruptions in normal brain development lead to microcephaly, severe developmental delay, and the other signs and symptoms of phosphoglycerate dehydrogenase deficiency.29
In the mutations TUBB4A gene, which provides instructions for making a protein called beta-tubulin (β-tubulin). The TUBB4A gene is found primarily in the brain, particularly in the putamen, cerebellum, and white matter.30 The researchers suspect that problems with microtubules impair neuronal migration or the transport of important substances within neurons, leads to dysfunction and loss of these cells in the brain, particularly in the putamen, cerebellum, and white matter. Abnormalities in these brain regions underlie the movement, speech, and learning problems that can occur in TUBB4A-related leukodystrophy.31
The DEG’s were also analyzed using R and Bio-conductor package. The package used here is the DESeq2 package. This package provides methods to test for the differential expressed using negative binomial generalized linear model. As the input, it expects the count file which is generated using the galaxy feature count tool.
For the analysis of DEG’s the count file was taken as an input and DESeq DataSet was created by specifying gene count data frame. After creating DESeq DataSet, the algorithm of DESeq2 was performed and the result was extracted. The result shows the base mean value, p-value, log (FC), padj value and the geneIDs.
In this figure 8, heatmap plot enlists the top 20 set of genes that were expressed in the samples. By analyzing the plot, it was seen that from gene 4538 to 284076 (shown in figure 8) shows down regulation of genes in the cc samples, whereas the same set of genes up regulated in the fc807 sample. From the gene 406936 to 2670 variation was seen between cc804 and fc807 sample.
 |
Figure 8: Heatmap generated using DESeq2 package in the R. |
Functional annotation and data enrichment of differentially expressed genes
For the intervention and pathway analysis on the differentially expressed genes annotate package was used along with the GO.db package for describing the entire gene ontology. Annotate package was used to associate the experimental data with the available metadata. The GO.db is a set of annotation maps describing the entire Gene Ontology assembled using data from GO. It provides detailed information about the latest version of the Gene Ontologies.
Annotation of the genes was done using the DAVID and Gene Ontology database. The geneID were annotated in DAVID database to retrieve gene symbols. Then gene symbols were further annotated using GO Database. Pathway enrichment was done to annotate which gene was involved in tumor/ cancer causing pathways. Pathway enrichment was performed over the differentially expressed gene. Out of which most effective genes are listed in Table 4. The genes expressed were ND4, COX3, B3GNT5, NKX3-1, HSPA2, PHGDH, DAAM, NRCAM and GATM. All the gene were studied in the GO database for the pathway enrichment. The table 4 shows the pathway involved in DE Gene.
Table 4: List of Differentially expressed gene and the pathways involved using GO Database
| S. No | Gene ID | Gene symbol | Functions | Pathway |
| 1 | 4538 | ND4 | Biomarker of Alzheimer’s disease. Parkinson’s, schizophrenia, muscular dystrophy, neurological diseases | Metabolic pathway |
| 2 | 4514 | COX3 | Nervous system related syndrome like MELAS syndrome | Pathway in cancer |
| 3 | 84002 | B3GNT5 | Expressed in Bone marrow | Metabolic pathway |
| 4 | 4824 | NKX3-1 | Prostate cancer | Pathway in cancer |
| 5 | 3306 | HSPA2 | Digestive tract disease like Crohn’s Disease | MAPK signalling pathway |
| 6 | 26227 | PHGDH | Neurological disorder, microcephaly, cognitive disorder | glycine, Erin and threonine metabolism |
| 7 | 23500 | DAAM2 | Neurodevelopmental disorder | Wnt signaling pathway |
| 8 | 4897 | NRCAM | Autism, Neurological disorder | cell adhesion molecule |
| 9 | 2628 | GATM | cognitive disorder, neurological disorder and lack of coordination | glycine, Erin and threonine metabolism |
Gene ontology and pathway analysis shows that 9 genes have function in cancer and these genes are associated with cancer causing pathway. This cancer-causing pathway were metabolic pathway, pathway in cancer, MAPK signalling pathway, glycine, serine and threonine metabolism (P02776) and Wnt signaling pathway. According to various studies (geneID-26227) PHGDH 32 gene plays major role in cancer metabolism, (gene Id-4538), ND433 gene mutation also has been identified in a small number of people with Leigh syndrome, a progressive brain disorder that typically appears in infancy or early childhood and (geneID- 3306) HSPA2 34 gene is expressed in various tumors. These results highlight important genes that can be taken into consideration to explore the biology of brain tumor. Important genes that can be further used for wet lab verification are NADH, PHGDH, DAAM2, NRCAM and GATM. These genes have function in neurodevelopment, neuronal signaling, neuron development and are associated with neurological disorders like Alzheimer’s disease, Parkinson’s, schizophrenia, cognitive disorder, and muscular dystrophy 35.
Conclusion
The formation of abnormal groups of cells inside the brain can trigger and lead to the activation of a brain tumor. The abnormal cells instantaneously affect the processing of the brain and health of a patient. In this study analysis was done to find the differentially expressed genes using R and bioconductor packages over the count file. As a result 20 genes were found that were differentially expressing and out of 20 genes, 9 genes were found involved in cancer causing pathway. By the final analysis of the results, it was seen that genes i.e., PHGDH, and HSPA2 were found involved in the cancer-causing pathways. From the pathway enrichment done using DAVID and GO database and it was found that these genes have significant role in causing brain tumor. It has been seen that the PHGDH, TUBB4A, and MTT3 gene also involved in regulation of gene expression in the samples. Finally, by comparative analysis between both R and Bioconductor results and Galaxy results, it was found that the PHGDH, COX3, MT3 gene were differentially expressed in brain tumor. Functional enrichment of selected genes and extensive literature study highlights important genes that can be considered for further wet lab experiments.
Important genes that have function in neurological related disorder are, ND4 (NADH dehydrogenase 4) gene that is encoded by mitochondrial genome and has function in electron transport chain, and it is hereditary [36]. ND4 gene is found to be associated with neurological disorders like Parkinson’s, schizophrenia, muscular dystrophy, neurological diseases, and it is also used as Biomarker of Alzheimer’s disease. PHGDH (phosphoglycerate dehydrogenase) gene it is involved in amino acid synthesis since this gene encodes enzymes that is used to synthesize L-serine in cells. Mutation in PHGDH is associated with Neurological disorder, microcephaly, and cognitive disorders [37].
DAAM2 (dishevelled associated activator of morphogenesis 2) have important function in development of nervous system and in Wnt signaling pathway. DAAM2 gene is involved in neurological related disorders [38], NRCAM (neuronal cell adhesion molecule) it is involved in neuron signaling and have function in development of neuron, cell communication and allelic variant this gene is linked with autism [39]. GATM (glycine amidinotransferase) is related to the biosynthesis of creatine and any error in functioning of this gene is related to several neuro and muscular related diseases [40]. Result shows that NADH, PHGDH, DAAM2, NRCAM and GATM have important functions in brain function. Further with wet lab verification these genes can be used as drug targets, biomarkers or can have important role in understanding brain tumor biology and can have application in terms of clinical perspectives.
Acknowledgements
We would like to acknowledge Amity Institute of biotechnology, Amity University Uttar Pradesh, Lucknow campus for providing us facilities to conducting this study. This research project is not funded by any specific grant from funding agencies in the public, commercial, or non-profit sectors.
Conflict of Interest
There is no conflict of interest.
References
- Bagley JA, Reumann D, Bian S, Lévi-Strauss J, Knoblich JA. Fused cerebral organoids model interactions between brain regions. Nature methods. 2017;14:743-51.
CrossRef - Seitzman BA, Gratton C, Marek S, Raut RV, Dosenbach NU, Schlaggar BL. et al., A set of functionally-defined brain regions with improved representation of the subcortex and cerebellum. Neuroimage. 2020;206:116290.
CrossRef - Zhang B, Jung M, Tu Y, Gollub R, Lang C, Ortiz A. et al., Identifying brain regions associated with the neuropathology of chronic low back pain: a resting-state amplitude of low-frequency fluctuation study. British journal of anaesthesia. 2019;123:e303-11.
CrossRef - Leggio M, Olivito G. Topography of the cerebellum in relation to social brain regions and emotions., Handbook of clinical neurology. 2018; 154:71-84.
CrossRef - Lu AT, Hannon E, Levine ME, Crimmins EM, Lunnon K, Mill J. et al., Genetic architecture of epigenetic and neuronal ageing rates in human brain regions. Nature communications. 2017;8:1-4.
CrossRef - Polania R, Nitsche MA, Ruff CC., Studying and modifying brain function with non-invasive brain stimulation. Nature neuroscience. 2018;21:174-87.
CrossRef - Carhart-Harris RL, Nutt DJ., Serotonin and brain function: a tale of two receptors. Journal of Psychopharmacology. 2017;31:1091-120.
CrossRef - Seghier ML, Price CJ., Interpreting and utilising intersubject variability in brain function. Trends in cognitive sciences. 2018;22:517-30.
CrossRef - Juszczak GR, Stankiewicz AM., Glucocorticoids, genes and brain function. Progress in Neuro-Psychopharmacology and Biological Psychiatry. 2018;82:136-68.
CrossRef - Parodi A, Rudzińska M, Deviatkin AA, Soond SM, Baldin AV, Zamyatnin AA., Established and emerging strategies for drug delivery across the blood-brain barrier in brain cancer. Pharmaceutics. 2019;11:245.
CrossRef - Brunese L, Mercaldo F, Reginelli A, Santone A., An ensemble learning approach for brain cancer detection exploiting radiomic features. Computer methods and programs in biomedicine. 2020;185:105134.
CrossRef - Kaina B, Christmann M., DNA repair in personalized brain cancer therapy with temozolomide and nitrosoureas. DNA repair. 2019;78:128-41.
CrossRef - Costa-Silva J, Domingues D, Lopes FM., RNA-Seq differential expression analysis: An extended review and a software tool. PloS one. 2017;12:e0190152.
CrossRef - Lachmann A, Torre D, Keenan AB, Jagodnik KM, Lee HJ, Wang L. et al., Massive mining of publicly available RNA-seq data from human and mouse. Nature communications. 2018;9:1-0.
CrossRef - Qiu P., Embracing the dropouts in single-cell RNA-seq analysis. Nature communications. 2020;11:1-9.
CrossRef - Collado-Torres L, Nellore A, Kammers K, Ellis SE, Taub MA, Hansen KD. et al., Reproducible RNA-seq analysis using recount2. Nature biotechnology. 2017;35:319-21.
CrossRef - Liao Y, Smyth GK, Shi W., The R package Rsubread is easier, faster, cheaper and better for alignment and quantification of RNA sequencing reads. Nucleic acids research. 2019; 47:e47
CrossRef - Marini F, Binder H., pcaExplorer: an R/Bioconductor package for interacting with RNA-seq principal components. BMC bioinformatics. 2019:20:1-8.
CrossRef - Lamarre S, Frasse P, Zouine M, Labourdette D, Sainderichin E, Hu G. et al., Optimization of an RNA-Seq differential gene expression analysis depending on biological replicate number and library size. Frontiers in plant science. 2018;9:108.
CrossRef - Moreno P, Huang N, Manning JR, Mohammed S, Solovyev A, Polanski K. et al., User-friendly, scalable tools and workflows for single-cell RNA-seq analysis. Nature Methods. 2021;18:327-8.
CrossRef - Grüning BA, Rasche E, Rebolledo-Jaramillo B, Eberhard C, Houwaart T, Chilton J. et al., Jupyter and Galaxy: Easing entry barriers into complex data analyses for biomedical researchers. PLoS computational biology. 2017;13:e1005425.
CrossRef - Etherington GJ, Soranzo N, Mohammed S, Haerty W, Davey RP, Palma FD., A Galaxy-based training resource for single-cell RNA-sequencing quality control and analyses. GigaScience. 2019;8:giz144.
CrossRef - Saif R, Ejaz A, Mehmood T, Asif F, Alghanem SM, Ahmad TS., Introduction to Galaxy Platform for NGS Variant Calling Pipeline. Advancements in Life Sciences. 2020;7:129-34.
- Zoabi Y, Shomron N., Processing and Analysis of RNA-seq Data from Public Resources. InDeep Sequencing Data Analysis 2021:81-94. Humana, New York, NY.
CrossRef - Zytnicki M., mmquant: how to count multi-mapping reads?. BMC bioinformatics. 2017; 18:1-6.
CrossRef - Zheng T, Wang A, Hu D, Wang Y., Molecular mechanisms of breast cancer metastasis by gene expression profile analysis. Molecular medicine reports. 2017;16:4671-7.
CrossRef - Yoshino H, Nohata N, Miyamoto K, Yonemori M, Sakaguchi T, Sugita S. et al., PHGDH as a key enzyme for serine biosynthesis in HIF2α-targeting therapy for renal cell carcinoma. Cancer research. 2017; 77:6321-9.
CrossRef - Zhang B, Zheng A, Hydbring P, Ambroise G, Ouchida AT, Goiny M. et al., PHGDH defines a metabolic subtype in lung adenocarcinomas with poor prognosis. Cell reports. 2017;19:2289-303.
CrossRef - Mattaini KR, Sullivan MR, Lau AN, Fiske BP, Bronson RT, Vander Heiden MG., Increased PHGDH expression promotes aberrant melanin accumulation. BMC cancer. 2019;19:1-1.
CrossRef - Lu Y, Ondo Y, Shimojima K, Osaka H, Yamamoto T., A novel TUBB4A mutation G96R identified in a patient with hypomyelinating leukodystrophy onset beyond adolescence. Human genome variation. 2017;4:1-3.
CrossRef - Duncan ID, Bugiani M, Radcliff AB, Moran JJ, Lopez‐Anido C, Duong P. et al., A mutation in the Tubb4a gene leads to microtubule accumulation with hypomyelination and demyelination. Annals of neurology. 2017;81:690-702.
CrossRef - Reid MA, Allen AE, Liu S, Liberti MV, Liu P, Liu X, Dai Z, Gao X, Wang Q, Liu Y, Lai L. Serine synthesis through PHGDH coordinates nucleotide levels by maintaining central carbon metabolism. Nature communications. 2018 ;9:1-1.
CrossRef - Vignal-Clermont C, Girmens JF, Audo I, Said SM, Errera MH, Plaine L, O’Shaughnessy D, Taiel M, Sahel JA. Safety of intravitreal gene therapy for treatment of subjects with Leber hereditary optic neuropathy due to mutations in the mitochondrial ND4 gene: the REVEAL study. BioDrugs. 2021;35:201-14.
CrossRef - Scieglinska D, Krawczyk Z, Sojka DR, Gogler-Pigłowska A. Heat shock proteins in the physiology and pathophysiology of epidermal keratinocytes. Cell Stress and Chaperones. 2019;24:1027-44.
CrossRef - Rathore R, Schutt CR, Van Tine BA. PHGDH as a mechanism for resistance in metabolically-driven cancers. Cancer drug resistance (Alhambra, Calif.). 2020;3:762.
CrossRef - Dong Y, Sameni S, Digman MA, Brewer GJ. Reversibility of age-related oxidized free NADH redox states in Alzheimer’s disease neurons by imposed external Cys/CySS redox shifts. Scientific reports. 2019;9:1-3.
CrossRef - Eade K, Gantner ML, Hostyk JA, Nagasaki T, Giles S, Fallon R, Harkins-Perry S, Baldini M, Lim EW, Scheppke L, Dorrell MI. Serine biosynthesis defect due to haploinsufficiency of PHGDH causes retinal disease. Nature metabolism. 2021;3:366-77.
CrossRef - Chen A, Liu Z, Wu Q, Li H. Disheveled-associated activator of morphogenesis 2 promotes invasion of colorectal cancer by activating PAK1 and promoting MMP7 expression. Genes & Genomics. 2021;43:923-35.
CrossRef - Liang L, Wu S, Lin C, Chang YJ, Tao YX. Alternative splicing of Nrcam gene in dorsal root ganglion contributes to neuropathic pain. The Journal of Pain. 2020;21:892-904.
CrossRef - Zhang L, Zhu Z, Yan H, Wang W, Wu Z, Zhang F, Zhang Q, Shi G, Du J, Cai H, Zhang X. Creatine promotes cancer metastasis through activation of Smad2/3. Cell metabolism. 2021;33:1111-23.
CrossRef

