
Manuscript accepted on :02-08-2022
Published online on: 14-10-2022
Plagiarism Check: Yes
Reviewed by: Dr. Neha Gujarati
Second Review by: Dr. Praveen Kumar D
Final Approval by: Dr. H Fai Poon
Nibedita Dey1 , Smita Ayer2, Rajeswary Hari3 and Kamatchi C4*
1Saveetha School of Engineering, SIMATS, Thandalam, Tamil Nadu, India
2Visionary RCM - CorroHealth, Hyderabad, Telangana, India.
3Department of Biotechnology,Dr.M.G.R Educational and Research Institute, Chennai, Tamil Nadu, India
4Department of Biotechnology,The Oxford College of Science, Bengaluru, Karnataka India.
Corresponding Author E-mail: ckamatchi@gmail.com
DOI : https://dx.doi.org/10.13005/bpj/2552
Abstract
The lifestyle disorders are taking a toll on many individuals. With the fast-paced life, it is difficult to control the diet and physical activity necessary for optimal living. Stress too has added up to the various aliments associated with the body. Thyroid diseases are found to be a major hormonal discomfort found in many Asians. Hypothyroidism is a special condition in which there is a deficiency in the thyroid hormone production. The present study was devised to provide a comprehensive data on the effect of fresh onset of hypothyroidism on patients in Chennai. The diagnosed patients were experimented for their biochemical and molecular profiles. There was a significant increase in the lipid and peroxidase profiles. The antioxidant enzyme content also saw a steep decrease in individuals with hypothyroidism. The presence of thyroid peroxidase gene was found to be present in most of the hypothyroid patients. The genes were found to be 320 and 422 bp in size for the amplified product. Therefore, we were able to suggest that there is a very inevitable relation between hypothyroidism and heart ailments. Prolonged and unmonitored hypothyroidism can lead to various other pathological conditions to manifest in the patient in the long run.
Keywords
Biochemical Profiling; Chennai; Exon 9; Fresh Cases; hypothyroidism
Download this article as:| Copy the following to cite this article: Dey N, Ayer S, Hari R, Kamatchi C. Molecular and Biochemical Characterization of Hypothyroid Patients in Chennai. Biomed Pharmacol J 2022;15(4). |
| Copy the following to cite this URL: Dey N, Ayer S, Hari R, Kamatchi C. Molecular and Biochemical Characterization of Hypothyroid Patients in Chennai. Biomed Pharmacol J 2022;15(4). Available from: https://bit.ly/3EGGovK |
Introduction
The greatest control system of the human physiology is its hormone- based endocrine system. It coordinates and facilitates the various functions of the body. They compose of chemical messengers that transport and move through the systemic circulation to regularize and assess the optimal functioning of the body. When compared to the nervous system, the endocrine seems to have a longer impact on the organs and tissues. The proper functioning of the endocrine system is very essential for optimum working of the defence systems, electrolyte balances, growth, proliferation, metabolism and balance. The thyroid hormone is secreted from a butterfly shaped gland that is located at the neck region of the body. It is associated with the larynx and trachea. They are produced from thyroglobulin which is a glycoprotein. It is one the few glands that stores its products and hormones in quantities required for the future. Presence of iodine has a major influence on this hormone. All cells in the body have receptors for the thyroid hormone. It influences the metabolic rates, the ion pumps for energy production, protein synthesis and growth of an individual. There are many ailments associated with the imbalance of thyroid hormones. If the gland starts over functioning it is called hyperthyroidism while underactive phenomenon of the same leads’ hypothyroidism. Major population under risks of thyroid malfunction can be determined by their gender, age, hereditary and living conditions. Women are considered more prone to the thyroid related illness when compared to men. Pregnancy and menopause also add up to the occurrence of this disease. It greatly affects the reproductive life of the uterus. When screened based on age, the senior citizens are prone to hypothyroidism. The genetics associated with thyroid diseases is quite complex. It often reported to skip a generation. Based on family history, the severity of the disease also varies. Many living conditions also cause the alteration in the thyroid concentration in the blood. Scenarios like postpartum, autoimmune diseases or smoking favour the occurrence of thyroid related diseases.
When we go the genetic aspect of the disease, the thyroid peroxidase gene is related to the thyroid functioning and metabolism. It produces thyroid peroxidase, which is a form of glycoprotein. It has a prosthetic heme moiety. This gene is essential to introduce the iodine in to the thyroglobulin protein. They also aid in coupling the iodine to the tyrosine, this will generate T3 and T4 hormones that regulate many aspects of the body. The chromosome that encodes for this gene is 2pter-p12 2. It is a 150kb sequence that is very specific to thyroid peroxidase. In 1999, Lazar and team experimented on generating the genes that were involved in expression of thyroid related hormones. It was seen that the expression of thyroid peroxidase gene decreases in case of cancer cell lines but retained their activity in normal conditions. there are many biochemical parameters associated with hypothyroidism. They can be used to evaluate the patient with great ease and efficacy. One such parameter is oxidative stress 3,4. The generation of oxygen species that are highly reactive and enhance the damage to many biomolecules and hormones. Another profiling which is feasible to assess the thyroid dysfunction would be lipid peroxidation assay. The presence of reactive species of oxygen will initiate a sequence of reactions by reduction of the polyunsaturated fatty acids. This yields lipid hydroperoxides. They will give out further by products that cause hinderance to many systems in the body, including thyroid 5. Blood profile also changes when it comes to stress created in the internal environment due to free radicles. Erythrocytes as they have greater concentration of molecular oxygen and iron in them, they are damages to a great extend if exposed to free radicles 6. The membrane of erythrocytes are more prone adverse effects as it is easily available for ROS to adhere and react. There is a constant oxygen tension around the surface of BC due to lipid peroxidation. This is due to the richness in the fat levels around the cell membrane along with the oxygen 7. When there is an abnormal thyroid function the blood profile would show elevated levels of total cholesterol and LDL 8. They seem to be contributing a lot of dyslipidemia in many clinical patients worldwide 9. There is a decrease in the sensitivity of the receptors involved in the catabolism of cholesterol. It is very pivotal to note the levels of cholesterol in thyroid patients as it will be very hazardous for the individual in the long run 10. Failure in the thyroid system tends to elevate the homocysteine in the plasma of the blood. This has an adverse effect on the heart and its functioning. Thyroid dysfunction also causes hypertension in the arteries of the heart leading tp stiffness of the vessels and heart muscle 11. Coagulation is also found to be associated with thyroid hormone 12.
The metabolism of the hormone occurs in the liver cells. When there is an imbalance in the hormone related to thyroid, the lever’s functionality gets hampered. To monitor or see the effects of thyroid dysfunction, the liver function tests can be linked and checked. We have tried to relate the relationship between thyroid and liver issues in the current study. Generally, thyroid hormones have an affinity towards lipids hence, the liver produces many by products that eventually would interact with thyroid hormones to give out characteristic functions. The complex formation with the hormone is very essential to maintain the optimal concentration of the thyroid hormone in the systemic circulation. The presence of free hormone accounts to the biologically active molecules reacting with the body tissues and organs. The concentrations by nature is kept steady to have proper functioning of the body. Under diseased conditions of the liver or thyroid gland this complex formation is hindered that leads to many undesired outcomes and effects on the tissues 13. Hypothyroidism has been reported by many researchers to be a reason behind the occurrence of cholestatic jaundice. Reduction in the hormone causes a decrease in the bile secretions 14. Mutations in the thyroid peroxidase gene has been reported before be a molecular reason behind the occurrence of thyroid dysfunction. Till date seven different mutations have been reported in this gene. These mutations are mostly frameshift, insertions, substitutions and duplications. The phenotypes of disease varied based on the heterozygous and homozygous genotypes of the patients. The mutations were reported to be either in the intron or promoter regions of the gene 15.
The Aim of our study is to evaluate the biochemical variations in patients having thyroid issues. These were compared to normal patients. The profiles collected were the lipid content, plasma profile, enzymes related to antioxidants, etc. Later their polymorphic profile was attempted for the thyroid peroxidase gene. These tests were performed to find the possible link between the biochemical traits and their genetic constitution in thyroid patients. The keywords used in this study are Efflux system, nanoparticles, drug resistance, synergistic effect, antibacterial properties.
Materials and methods
The blood samples were collected from 30 healthy patients and 30 thyroid patients. These samples were procured from A.C.S. Medical College and Hospital, Chennai. The patients’ blood samples were from individual who were diagnosed with thyroid for the first time. The ethical committing meeting was conducted by, ACS Medical College and Hospital, Chennai and reference ethical committee for the research, 0303/ACSMCH/Ethical/02/2014. Hence, their blood didn’t have any influence of thyroid medication. The range was kept to be around 10 mU/mL the sample of blood were collected intravenously using one time use syringes. They were transferred to two containers, one with an anticoagulant and other with an anticoagulant. The blood containers without the anticoagulants were processed by centrifuging them at 5000 rpm for 10 minutes. The serum was transferred to 2 ml tubes from the supernatant. Later they were stored at -80 ºC in the deep freezer. The pellet was processed to yield the membrane of the erythrocytes.
Membrane isolation and estimation
The pellet is washed with saline around 3.5 times. Next tris-HCL buffer was use to rinse thrice the pellet. The pH of this buffer was maintained at 7.2 at 0.1 M concentration. The third wash was using the same buffer by at 7.4pH. ultimately a thick gel like pellet was attained of the RBC membranes. The protein content in the membrane were quantified using Folin lowry method. An alkaline solution was prepared by mixing 2g of sodium hydroxide in 400ml of distilled water. 10g of anhydrous sodium carbonate was introduced into the mixture and made up to half litre of solution with distilled water. In another beaker 1g of copper sulphate was made in 50 ml of distilled water. 1 g of sodium potassium tartrate was made in 50 ml water. A mixed reagent was formulated using 99 ml of alkaline solution with 0.5 ml of copper sulphate solution and 0.5 ml of sodium potassium tartrate solution. Each time this mixture was made freshly for the experiment. The test tubes were inoculated with 200µL of sample pellet, 0.3 ml of reagent and 1 ml of mixed reagent. Incubation was done for one hour and absorbance was seen in UV-Vis spectroscopy 16.
Total proteins estimation
Biuret was used quantify the total proteins present in the plasma of the patients as well as normal individuals. A 500 ml of water reagent was made using 1.5g of cupric sulphate and 6g of sodium potassium tartrate. Ten percent of the sodium hydroxide was added and distilled water was utilized to make the volume to 1 litre. The reading s were taken colorimetric ally at 540 nm 17.
Albumin estimation
The reagent mentioned in the above section was opted for this assay too. 0.4 ml of the plasma was added to 5.6 ml of sodium sulphate-sulphite reagent along with 3 ml of ether. Biuret reagent was added carefully to produce violet colour. 5 ml of the reagent was used in this study. Readings were taken at 540 nm using UV-Vis spectrophotometry 18.
Lipid Profile
520 mg of ferric per chlorate was mixed with 600 ml of ethyl acetate. Under ice cold conditions, chilled concentrated sulphuric acid was administered in small portions and used at temperatures below 45 ºC. equal portions of the serum and the standard cholesterol solution were taken in separate vials. 5 ml of the reagent prepared was added in both the vials. Readings were taken at 560 nm using UV-Vis spectrophotometry. High density lipid profiling was performed using a different set of reagents. Magnesium chloride was taken in 3.167 g quantity and mixed in 1 ml solution of heparin. Around 20,000 units of heparin were found to be in that 1 ml solution. Later distilled water was added to make up to 8 ml. 2ml of the serum was mixed with 0.18 ml of reagent prepared by us and stirred well. After reducing the temperature to 4 ºC, the sample mixture was centrifuged at 2000 rpm and maintained at cold conditions of 10 ºC for half an hour. The supernatant is inferred to contain HDL; hence, 1 ml of the supernatant is used for further assay. For low density lipoprotein a similar protocol was opted but the reagents varied in comparison to HDL. Sodium – dodecyl sulphate solution with 10% concentration. The solvent used was sodium chloride solution with 0.15 M. the pH was adjusted to 9 using alkaline sodium hydroxide. 0.15 ml of SDS solution was mixed with 2 ml of serum. Contents were incubated for 2 hrs at 37 ºC. the centrifuged at 10,000 rpm for around 15 minutes. The supernatant was used to quantify LDL. The pellet portion is seemed to contain the very low-density lipoprotein (VLDL). 1 ml of this was used to quantify VLDL19.
Lipid peroxidation Assay
The erythrocyte membrane sample that we prepared previously was mixed with 1.5 ml of TBA, 0.8 ml of distilled water and 1,5 ml of acetic acid. The quantity of mixed reagent used is 0.2 ml. The whole combination of solution was boiled in water bath for one hour. Later cooled in running tap water and 5 ml of butanol: pyridine mixture was introduced into the mixture. The ratio of the mixture was kept at 15:1 v/v. another centrifugation was performed at 4000 rpm for 10 minutes. Readings were taken at 532 nm using UV-Vis spectrophotometry. The RBC cells were homogenised manually and treated with sodium chloride and anhydrous sodium sulphate salts. Organic solvent mix of chloroform and methanol were administered in the 2:1 ratio and centrifuged. The clear supernatant made from organic solvent was carefully removed and dried to produce lipid residues 20.
Dienes assay
The residues obtained from the above protocol were resuspended in methanol and quantified using UV-Vis spectroscopy at absorbance of 213 and 233 nm. The dienes content will be depicted by the ratio of the absorbance by both the wavelengths.
Lipid hydro peroxide Assay
10μL of triphenylphosphine were incubated with the sample for half an hour for about 20-25 ºC. this would remove the hydroperoxides and generate blank solution for the assay. 10μl of methanol was used to mix 90μl of tissue sample to make up to test sample. FOX2 reagent was pipetted out for 900μl and introduced into the test sample and incubated for half an hour. Centrifugation was performed for 10 minutes at 12000rpm and readings were taken for the supernatant at 560 nm 21.
Catalase Assay
0.1ml of phosphate buffer was taken as solvent and to it 0.1ml of sample was introduced after homogenization. 0.5ml of hydrogen peroxide was also added to the sample. 2ml of dichromate acetic acid was administered in sequence after every 30 seconds to stop the reaction between the reagents. After boiling the overall sample the tubes were cooled and readings were taken using spectrophotometer at 620 nm.
Superoxide dismutase assay
0.25 ml of chilled ethanol was mixed with 0.15 ml of chloroform and to it 0.5 ml of membrane homogenate was added to form the test solution. It was mixed in a shaker for about 15 minutes and then centrifuged. The supernatant was separated and 2ml of buffer was administered. Epinephrine was added to the solution in quantities of 0.4ml which lead to variations in optical density. This difference in density was analysed and recorded at 480 nm.
Glutathione -S- transferase estimation
0.1ml of RBC membrane homogenate was taken along with 0.1ml of 1-Chloro 2,4 dinitrobenzene. To this mixture 1.7ml of water and 1ml of phosphate buffer was also added. It was incubated for 5 minutes and reduced glutathione was pipetted into the mixture. The temperature was kept to be 37ºC.this led to change in optical density which was read for the first reading after 3 minutes and continuous readings were taken at every 30 minutes interval. The readings were taken at 340nm.
Glutathione reductase Assay
0.2ml 0f GSSG was mixed with 1.5 ml of buffer and 0.5ml of EDTA. They were incubated at 37ºC for about 10 minutes. To this mixture erythrocyte membrane homogenate was introduced in 0.1ml quantity. 0.1ml solution of NADPH was also pipetted into the full mixture. The change in optical density was observed in spectrophotometry at 340nm at equal intervals of 30 seconds from the first 3rd minute.
Glutathione peroxidase estimation
0.4ml of buffer along with 0.2ml of homogenate and 0.1 ml of sodium azide was taken together in a container. 0.2ml each of EDTA and reduced glutathione were added to it as well. 0.1ml of hydrogen peroxide was administered at three intervals of zeroth minute, 1.5 minutes and 3 minutes. Before centrifugation 1 ml of TCA was added and rotated at optimal rpm. The supernatant was collected and to 1 ml of the supernatant sample 4 ml of phosphate buffer was incorporated. The DTNB was added in 0.5ml quantity and the residual content of glutathione were measured at 412nm.
DNA isolation
The genetic material was isolated from blood samples of both normal as well as hypothyroid patients using blood samples. Electrophoresis was performed to quantify the length of the genomic sequence obtained [22].
PCR for thyroid peroxidase gene
The amplification of the desired TPO gene was performed to check their presence in the given samples by the polymerase chain reaction technique, standard protocol generally used in a PCR technique was opted. The primer sequence specific for TPO were designed ad used in the process. The sequence information are as follows – the forward primer for TPO exon 9 was 5’-ACAAGACGAGAAGGGTCCAG-3’ and the reverse sequence was 5’- AGAGTTCATGGGGACCAGC-3’. PCR reaction as follows, intitial denaturation 94° C 3mins, denaturation 94° C 50sec, Annealing 59.6° C 45sec, Extension 72° C 1min repeated for 30 cycles and followed by final extension 72° C, 3 mins. The amplification were visualized by agarose gel electrophoresis of amplified product 422bp.
Results
In our current study, we wished to link the presence of hypothyroidism to liver disorder, heart disease and hypercholesteremia. We also attempted to polymorph the hypothyroid population in Chennai with the normal crowd. The effect of this disease to antioxidant suppression and oxidative stress was also analysed.
Protein profile
The results of the plasma protein levels in both normal and hypothyroid patients were collected and their mean and standard deviations were calculated. The significance of the result was done using the ANOVA table followed by the Dunnett’s ‘t’ test. The table 1 depicts the plasma protein levels in the form of total proteins, albumin and globulin content in both the type of patients. There is a decrease observed in the protein concentration in hypothyroid patients in comparison to the normal population. If this decrease becomes significant over time many liver aliments will manifest along with the thyroid symptoms. For the protein profile the total plasma for the normal patients was found to be around 7.6 ± 0.3 while for hypothyroid patient was found to be around 6.4 ± 0.2. The P values were found to be less than 0.05 which was very significant. While the albumin and globulin have non-significant changes in their concentrations.
Table 1: Plasma protein levels in the form of total proteins, albumin and globulin content in both the type of patients.
| S.No. | Parameter | Control (Normal) Samples | Hypothyroid Samples | P Value |
| 1. | Total Plasma Protein
(g/dL) |
7.6 ± 0.3 | 6.4 ± 0.2 | <0.05 |
| 2. | Albumin (g/dL) | 5.07 ± 0.2 | 4.26 ± 0.3 | Non- Significant |
| 3. | Globulin (g/dL) | 2.53± 0.32 | 2.13 ± 0.26 | Non- significant |
Lipid profile
The lipid profiles for LDL, HDL.VLDL and total cholesterol for all the 60 patients were collected and analysed. Their values were averaged and their standard deviations were recorded. Statistical significance was seen in the same way as reported above. Table 2 depicts the lipid levels that were found to be very significant and high in value in hypothyroid patients. This data could be inferred to have feasible evidence of the relation between hypercholesteremia and hypothyroidism. The membrane lipid peroxidation product assay also manifested significant levels of lipid peroxidation and conjugated dienes in the membranes of erythrocytes of hypothyroid patients. But the lipid hydroperoxide level seems to be at a normal range in both the patients. The lipid profile values were found to be 129.04 ± 17.91for normal patients and 199.35 ± 20.12 for hypothyroid patients. For LDL levels the values were 49.65 ± 7.59 for normal patients and 39.55 ± 5.72 for thyroid patients. It was found that the HDL content was 48.72 ± 14.39 in normal and 127.67 ± 20.97 in diseased samples. Lastly the VLDL levels were 30.67 ± 6.16 for normal and 32.13 ± 5.22 for thyroid patients. The P value was fund be very significant for total cholesterol, LDL and HDL content. VLDL have not much difference in both the samples.
Table 2: The lipid levels found in both normal and thyroid patients.
| S.No. | Parameter (mg/dL) | Control (Normal) Samples | Hypothyroid Samples | P Value |
| 1. | Total Cholesterol | 129.04 ± 17.91 | 199.35 ± 20.12 | <0.01 |
| 2. | LDL | 49.65 ± 7.59 | 39.55 ± 5.72 | <0.01 |
| 3. | HDL | 48.72 ± 14.39 | 127.67 ± 20.97 | <0.01 |
| 4. | VLDL | 30.67 ± 6.16 | 32.13 ± 5.22 | Non- significant |
The lipid peroxidation levels for normal patients was found to be 3.16 ± 0.60 whereas for thyroid patients was found to be 6.3 ± 1.6. The conjugate dienes in normal patients was noted to as 0.19 ± 0.06 and thyroid patients as 0.35 ± 0.11. The lipid peroxide levels were found to be 0.05 ± 0.006 for normal and 0.08 ± 0.004 for hypothyroid individuals. Table 3 represents the levels of erythrocyte membrane tissue lipid peroxidation products in normal and hypothyroid individuals. Our data manifested that the levels of Malondialdehyde generated due to lipid peroxidation was very significant in nature. It was at a higher level in hypothyroid patients when compared to its normal counterpart. A spontaneous increase in stress due to reactive oxygen species can lead to damage to the membrane, tissues, proteins as well as the DNA. It could possibly induce cancer in the future in many individuals.
Table 3: The Levels of erythrocyte membrane tissue lipid peroxidation products in normal and hypothyroid individuals
| S.No. | Parameter (mg/dL) | Control (Normal) Samples | Hypothyroid Samples | P Value |
| 1. | Lipid Peroxidation | 3.16 ± 0.60 | 6.3 ± 1.6 | <0.05 |
| 2. | Conjugated Diene | 0.19 ± 0.06 | 0.35 ± 0.11 | <0.05 |
| 3. | Lipid Hydroperoxide | 0.05 ± 0.006 | 0.08 ± 0.004 | <0.01 |
Enzymes assay
The catalase value for normal individuals was found to be 2.95 ± 0.78 while for the patients with thyroid issues were found to be 0.64 ± 0.3. The concentration of superoxide dismutase for normal patients were 6.26 ± 1.73 whereas for the patients with thyroid problems were observed to be 1.32 ± 1.04. the glutathione -S-transferase levels were noted to be 1.78 ± 0.2 for healthy people and 0.86 ± 0.16 for hypothyroid patients. The glutathione reductase values were 5.22 ± 1.19 for healthy individuals and 3.36 ± 1.10 for diseased patients. Finally, the glutathione peroxide values were 4.48 ± 0.9 for normal people and 1.81 ± 0.58 for patients with hypothyroid conditions. Table 4 shows the antioxidant response of various enzymatic antioxidants to oxidative stress in the erythrocyte membranes of normal and hypothyroid individuals. We compared the enzymatic responses from the systems of people with and without hypothyroidism. The responses of antioxidants like catalase, superoxide dismutase, glutathione reductase and glutathione peroxidase in individuals with hypothyroid had very low significance when compared to normal subjects. Glutathione-S-transferase manifested a low significance in thyroid patients, but their value was higher when compared to the other four enzymes taken into consideration in our study. The levels of these antioxidants are very essential for the removal of reactive species from the body. This elimination of reactive species has its own set of pros on the human body. Due to hypothyroidism we found that the levels of these vital antioxidants have reduced. Hence, patients might be prone to further medical complications in the near future.
Table 4: Levels of Erythrocyte membrane antioxidant enzymes in normal and hypothyroid individuals
| S.No. | Parameter | Control (Normal) Samples | Hypothyroid Samples | P Value |
| 1. | Catalase | 2.95 ± 0.78 | 0.64 ± 0.3 | <0.01 |
| 2. | Superoxide Dismutase | 6.26 ± 1.73 | 1.32 ± 1.04 | <0.01 |
| 3. | Glutathione-S-transferase | 1.78 ± 0.2 | 0.86 ± 0.16 | <0.05 |
| 4. | Glutathione reductase | 5.22 ± 1.19 | 3.36 ± 1.10 | <0.01 |
| 5. | Glutathione peroxidase | 4.48 ± 0.9 | 1.81 ± 0.58 | <0.01 |
Genomic isolation
The blood cells were processed and their genome were isolated in 0.6% agarose gel electrophoresis. Figure 1 depicts the genome bands from healthy individuals without thyroid problem. Lane 1 was loaded with DNA ladder having base pairs from 33500 to 500 pairs. Lane 2 to 6 were loaded with samples mgrS1 to mgrS5.
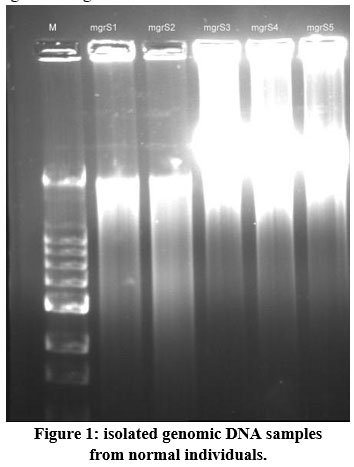 |
Figure 1: isolated genomic DNA samples from normal individuals. |
Figure 2 depicts the genomic profile of patients affected by hypothyroidism. The samples assayed in this set were mgrT1, mgrT2, mgrT3, mgrT4, mgrT5, mgrT6, mgrT7, mgrT8, mgrT9, mgrT10, mgrT11, mgrT12, mgrT13, mgrT14, mgrT15 from diseased patients. MgrS3 and mgrS4 were placed in lane 17 and 18 for reference with normal individuals. Lane 1 was loaded with super mix DNA ladder with same base pair length as mentioned for figure 1.
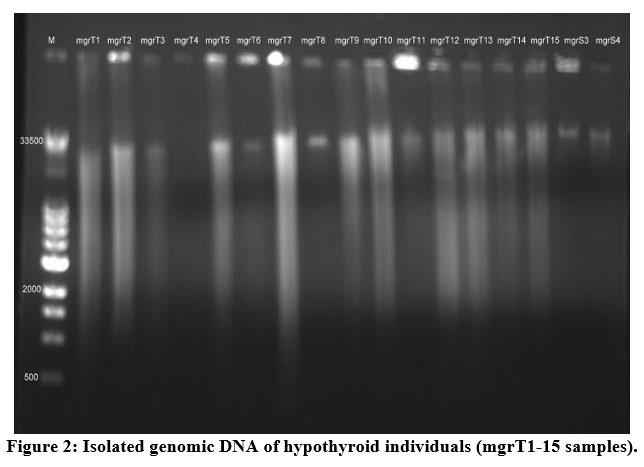 |
Figure 2: Isolated genomic DNA of hypothyroid individuals (mgrT1-15 samples). |
Figure 3 represents another set of genomic profile detail for samples from mgrT16, mgrT17, mgrT18, mgrT19, mgrT20, mgrT21, mgrT22, mgrT23, mgrT24, mgrT25 and mgrT26. These samples were also from patients with initial diagnosis of hypothyroidism. Here too mgrS3 and mgrS4 were placed in lane 12 and 13 for reference with normal individuals. The ladder in lane 1 was the same used in previous two genomic profiles.
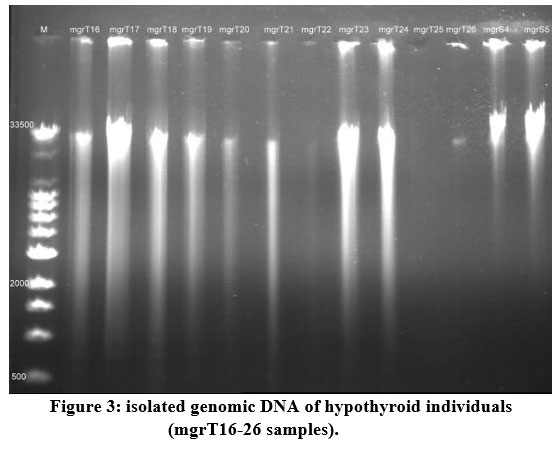 |
Figure 3: isolated genomic DNA of hypothyroid individuals (mgrT16-26 samples). |
Polymerase chain reaction analysis
The desired TPO exon 9 gene was analysed and amplified using PCR. Later, they were visualized using 1.5% agarose gel electrophoresis. This technique was performed for both normal and patient with hypothyroidism. Figure 4 represents the genomic profile of 2 healthy individuals mgrS1 and mgrS2. Water was used as a control in lane 4. The lane 1 was loaded with DNA marker with 1kb to 100bp size. The 2 samples from healthy individuals showed the presence of thyroid peroxidase gene.
 |
Figure 4: amplified product of exon 9 of the TPO gene of normal individuals. |
Similarly, the amplification of genome was performed for patients with hypothyroidism. The samples amplified were mgrT1, mgrT2, mgrT3, mgrT4, mgrT5, mgrT6, mgrT7 and mgrT8. Water was used as control in lane 8. Lane 1 was as usual loaded with DNA ladder of length ranging from 1kb to 100bp. This is represented in figure 5. The amplified product (320bp), was not able to sequence due to consensus sequence
 |
Figure 5: amplified product of exon 9 of the TPO gene of hypothyroid individuals. |
Most of the mutations in the thyroid peroxidase gene is seen to be happing in the exon 8 and 9. These exons encode for the heme section that binds catalytically to the Thyroid peroxidase enzyme. Since we used RBC for the study hence, we focused on these specific genes for molecular profiling of our patients. Based on the literature evidence that we attained we designed our primer for exon 9 and amplified the genomic DNA we extracted 23. Figure 6 depicts the polymerase chain reaction profiles of samples mgrT23 and mgrT24. The amplified product was found to be of size 422 bp.
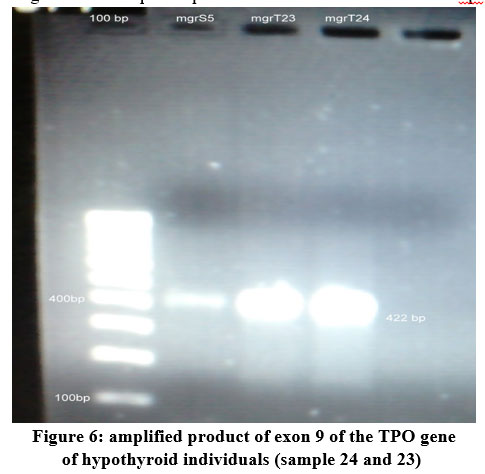 |
Figure 6: amplified product of exon 9 of the TPO gene of hypothyroid individuals (sample 24 and 23) |
This segment was then sent for sequencing. The forward sequence of the 368 bp was found to be ACTGCCGCTCGAGGCGACCCTCCTCTGGTATCCTGGGCCTCACTGAGATGCTTTTCCTATCTGCACAGATCATCACCCTGAGGGATTACATCCCCAGGATCCTGGGACCCGAGGCCTTCCAGCAGTACGTGGGTCCCTATGAAGGCTATGACTCCACCGCCAACCCCACTGTGTCCAACGTGTTCTCCACAGCCGCCTTCCGCTTCGGCCATGCCACGATCCACCCGCTGGTGAGGAGGCTGGACGCCAGCTTCCAGGAGCACCCCGACCTGCCCGGGCTGTGGCTGCACCAGGCTTTCTTCAGCCCATGGACATTACTCCGTGGAGGTGAGTGAGTGCGGTCCCTGCAGCTGGTCCCCAT
while the reverse sequence was found to be CATGGGCTGAAGAAAGCCTGGTGCAGCCACAGCCCGGGCAGGTCGGGGTGCTCCTGGAAGCTGGCGTCCAGCCTCCTCACCAGCGGGTGGATCGTGGCATGGCCGAAGCGGAAGGCGGCTGTGGAGAACACGTTGGACACAGTGGGGTTGGCGGTGGAGTCATAGCCTTCATAGGGACCCACGTACTGCTGGAAGGCCTCGGGTCCCAGGATCCTGGGGATGTAATCCCTCAGGGTGATGATCTGTGCAAATAGGAAAAGCATCTCAGTGAGGCCCAGGATACCAGAGGAGGGTCGCCTCGAGCGGCAGTGTGGAAAAGCATCTTCCTTGACAGCCCCAGGGAACTGGACCCTTCTCGT.
When compared with BLAST software, these chromosomes were found to in close relation with TPO on chromosome 2 of homo sapiens. This gene is in charge of an enzyme that aids in production of thyroid hormone and also the iodine coupling in the gland. They are found in the apical region of the thyrocyte membrane. Any mutation in this gene can lead to many adverse effects like inability of the thyroid peroxidase enzyme to iodine or thyroglobulin or the heme domains 24,25.
Our results inferred that there were high levels of lipoprotein and oxidative stress biomarker compounds in hypothyroid patients under our study. The levels of antioxidant enzymes and plasma proteins were found to be low in the same set of people. Hence, we were able to suggest that even the freshly diagnosed hypothyroid patients are at potential risk of heart diseases based on the lipid profile analysis. The plasma protein levels indicated that there might be an onset of liver dysfunction in these patients in due course of time if their thyroid levels are not normalized. The oxidative stress biomarker compounds manifested that there is an excessive internal free radical formation in the patients due the thyroid imbalance. In the long run, this might cause damage to the essential cellular structures. The structures covered in this damage are proteins, DNA and various essential membranes. This can also result in cancer and extreme dysfunction of thyroid system. This excessive stress generated due to free radicles in the body tends to supress the antioxidant healing response of the individual 26. Even the results that we attained from our experimentation also inferred the same. The patients with hypothyroid issues had very low levels of antioxidant enzymes in their RBC membranes. Although these patients are diagnosed freshly of thyroid issues, they already have decreased antioxidant levels and increased stress biomarkers in the form of free radicals.
The isolation of DNA performed in both the types of patients with the motive to screen the thyroid peroxidase gene. This termed to be a key enzyme that functions well in normal subjects. It is responsible for synthesis of thyroid peroxidase enzyme for the normal metabolism of thyroid hormone. Any mutation in this gene has been reported earlier by many researchers might be the causative reason for thyroid hormone imbalance. When a similar study was performed in the people of west Bengal, alternation was noticed in the Asp666Asp and Thr725Pro section of the hormone in many hypothyroid patients. Two of their subjects under study manifested biallelic deletions. They suggested that the possible allele directly related to hypothyroidism might be the C allele that is associated with Thr725Pro 27. When checked the effect of developmental growth in individuals, the TPO expression has evidences of containing two splicing sections 28. From the polymerase chain amplification results from normal samples in our study were able to find the presence of thyroid peroxidase gene in all the patients. The gene was found to be of 320 bp in size. When tested in people with hypothyroidism, many patients till had the thyroid peroxidase gene unaltered in them. But, sample mgrT7 and mgrT8 didn’t show the presence of the gene. The manifestation of thyroid issues in these patients might be due to the altered TPO gene in them. The deficiency in the enzymes related to antioxidants will cause failure in tackling the extrinsic factors. These factors include diet, medications, physical activity, environmental conditions, etc. Many intrinsic factors also cause thyroid malfunctions. These are fatigue and body injuries. Intrinsic factors may directly or indirectly relate to generation of oxidative stress in the body. Although many researchers support the evidence of hyperthyroid leading to oxidative stress and hindering antioxidant enzymes, but the actual pathophysiology of this lowering of the enzymes has not been elucidated properly yet. The presence of hypothyroidism does bring changes in the physiology to adapt to the current environment and hence reducing the free antioxidant enzymes. This inference can also be justified by the facts produced by many scientists that thyroid hormone does combat the toxicity produced due to oxidative stress in both animal and human models 29,30. The protective effect of this hormone is associated with the proper functioning of the antioxidant species of the body.
Hence, we would like to suggest from our set of studies on 30 diseased subjects from Chennai that hypothyroidism does cause depletion in the antioxidant enzymes required for the optimal functioning of the body. This will increase the generation of free radicles in the electron transport chain and elevate the cellular stress. The absence of essential enzymes doesn’t compensate the radicals, so the individuals are mostly in oxidative state. Hence, under prolonged stress conditions the patient’s cellular structures tend to get damaged. This damage could further extend to the organs that aid in synthesis of antioxidants internally or from extracellular components. The genetic alternation of TPO in freshly diagnosed cases is quite rare. But few individuals did show the absence of TPO in their cells. Hence, we would like to conclude that the biochemical effects of hypothyroidism start manifesting even in fresh patients from the time they start having symptoms. But the genetic effect of TPO gene on hypothyroid might not be of great influence in most of the freshly diagnosed cases, but few do land up having the disease primarily because of the mutation of the gene. The main cause of hypothyroidism in the given crowd under study generally might be due to lack of physical activities and diet.
Conclusion
This work was framed with an intention to provide detailed consequences on early hypothyroid patients in Chennai. This disease was attributed to be an outcome of underactive thyroid system. 30 patients with early thyroid diagnosis were compared with 30 normal individuals in the given area in our study. Their biochemical profiles were collected and studied in the form of protein, lipid, membrane protein, antioxidant enzyme and peroxidation assays. These experiments were performed in both the normal and diseased population. Th protein profile showed decrease in total protein content but was of lower significance. If the disease goes unmonitored and uncontrolled over time this could lead to potential liver dysfunction. The lipid profiles showed significant elevation in LDL, HDL and total cholesterol levels. This could be the reason behind thyroid patients being prone to heart ailments. The enzyme and peroxidase assays threw light on the fact that oxidative stress in directly propositional the presence and severity of the hypothyroid condition. The onset of the condition itself showed high and elevated significant levels of reactive ion species and decreased levels of antioxidant enzymes. This significant manifestation of oxidation state of the internal environment of a fresh patient shows that potential damage to internal organs is inevitable without medications. If the damage is not controlled over time it could lead to cancel under certain unfortunate conditions. The effect of TPO gene on the hypothyroid onset is found in very few cases. Most of the patients with early hypothyroid diagnosis did show the presence of an intact 320 bp TPO amplified gene in the polymerase chain reaction profile. Mostly the disease is reported to be due to the extrinsic and intrinsic factors surrounding the patients. Hence, we were able to infer that hypothyroidism can be related to other pathological conditions like liver dysfunction and hypercholesteremia based on the biochemical profiles we observed. The molecular profile suggested that the onset of this might not be always related to mutation of the TPO gene. Therefore, regular health monitoring with proper intake of supplements, low fat diet and physical activities can aid in balancing the thyroid levels and avoid in adverse pathological conditions in the body.
Acknowledgment
None.
Conflict of interest
The authors declare that there is no any conflict of interest
Funding
There is no funding source.
References
- Grüters A, Krude H. Update on the management of congenital hypothyroidism. Hormone Research. 2007;68:107–111.
CrossRef - Halliwell V., and Gutteridge J.M.C., Free radical in biology and medicine, 2nd Edn., Oxford University Press, Oxford,1989.
- Roubal W.T., and Tappel A.I., Arch.Biochem Biophys., 113, 5, 1966.
CrossRef - Feller D.R., Hagerman L.M., Newman H.A.I., and Witiak D.T., Principles of medicinal chemistry, Edited by Foye W.O., Lemke T.L. and Williams D.A., New Delhi, 523, .1995.
- Biondi B. Palmieri EA. Fazio S. Cosco C. Nocera M. Sacca L. Filetti S. Lombardi G. Perticone F. Endogenous subclinical hyperthyroidism affects quality of life and cardiac morphology and function in young and middle-aged patients. J Clin Endocrinol Metab. 2000;85:4701–4705.
CrossRef - Monzani F. Di Bello V. Caraccio N. Bertini A. Giorgi D. Gusti C. Ferrannini E. Effect of levothyroxine on cardiac function and structure in subclinical hypothyroidism: a double blind, placebo-controlled study. J Clin Endocrinol Metab. 2001;86:1110–1115.
CrossRef - Eritsland J. Safety considerations of polyunsaturated fatty acids. Am J Clin Nutr 2000;71:197S– 201S.
CrossRef - Canaris GJ, Manowitz NR, Mayor G, Ridgway C: The Colorado thyroid disease prevalence study. Arch Intern Med 2000;160: 526-534.
CrossRef - Ôsimihodimos V, Bairaktari E, Tzallas C, Miltiadus G, Liberopoulos E, Elisaf M. The incidence of thyroid function abnormalities in patients attending an outpatient lipid clinic. Thyroid 1999;9: 365-358.
CrossRef - Kimura S, Hong YS, Kotani T, Ohtaki S, Kikkawa F. Structure of the human thyroid peroxidase gene: comparison and relationship to the human myeloperoxidase gene. Biochemistry. 1989;28:10,4481-4489.
CrossRef - Pucci E, Chiovato L, Pinchera A. Thyroid and lipid metabolism. Int J Obesity 2000;24: 109-112.
CrossRef - Dieckman T, Demacker PN, Kasyelein JJ, Stanenhoef AF, Wiersinga WM. Increased oxidability of low-density lipoproteins in hypothyroidism. J Clin Endocrinol Metab 1998;83: 1752-1755.
CrossRef - Bianco AC, Salvatore D, Gereben B, Berry MJ, Larsen PR. Biochemistry, cellular and molecular biology, and physiological roles of the iodothyronine selenodeiodinases. Endocr Rev 2002; 23:38–89.
CrossRef - Gaitan E, Cooper DS. Primary hypothyroidism. Curr Ther Endocrinol Metab1997; 6:94–8.
- Bakker B, Bikker H, Vulsma T, De Randamie JSE, Wiedijk BM, De Vijlder JJM. Two decades of screening for congenital hypothyroidism in the Netherlands: TPO gene mutations in total iodide organification defects (an update) Journal of Clinical Endocrinology and Metabolism. 2000;85(10):3708–3712.
CrossRef - Ian M. Rosenberg ,Protein analysis and purification- Benchtop Techniques,1996 Springer publication.
- Koller A, Kaplan A. The C.V. Mosby Co St. Louis toronto princeton. Clin Chem 1984;418:1316-24.
- Rondeau, Bourdon, E. The glycation of albumin: Structural and functional impacts. Biochimie. 2011;93, 645–658
CrossRef - Wybenga, D R V J Pileggi, P H Dirstine, John Di Giorgio. Direct Manual Determination of Serum Total Cholesterol with a Single Stable Reagent. Clinical Chemistry, 1970;16, Issue 12,980–984.
CrossRef - Satoh, K. Serum lipid peroxide in cerebrovascular disorders determined by a new colorimetric method. Clin. Chim. Acta, 1978;90: 37-43.
CrossRef - Otomo, M. Composition of the xylenol orange complexes of Fe+++ and their application to the determination of iron or xylenol orange. Buneski Kagaku 1965;14:677–682.
CrossRef - Sambrook J, Russell DW. Molecular Cloning: A Laboratory Manual. Cold Spring Harbor, NY: Cold Spring Harbor Laboratory Press; 2001.
- Ris-Stalpersa, C., and Bikker, H. Genetics and phenomics of hypothyroidism and goiter due to TPO mutations: Mol. Cell. Endocrinol. 2010;322:38–43.
CrossRef - Faure P, Oziol L, Artur Y, Chomard P. Thyroid hormone (T3) and its acetic derivative (TA3) protect low-density lipoproteins from oxidation by different mechanisms. Biochimie 2004; 86: 411-8.
CrossRef - Ohtaki, S., Nakagaw, H., Nakamura, M. and Kotani,T. Thyroid peroxidase and clinical Endocrinol. 1996;43:1-14.
CrossRef - Umeki K, Kotani T, Kawano JI, et al. Two novel missense mutations in the thyroid peroxidase gene, R665W and G771R, result in a localization defect and cause congenital hypothyroidism. European Journal of Endocrinology. 2002;146(4):491–498.
CrossRef - Niu DM, Hwang B, Chu YK, Liao CJ, Wang PL, Lin CY. High prevalence of a novel mutation (2268 insT) of the thyroid peroxidase gene in Taiwanese patients with total iodide organification defect, and evidence for a founder effect. Journal of Clinical Endocrinology and Metabolism. 2002;87(9):4208–4212.
CrossRef - Wu JY, Shu SG, Yang CF, Lee CC, Tsai FJ. Mutation analysis of thyroid peroxidase gene in Chinese patients with total iodide organification defect: identification of five novel mutations. Journal of Endocrinology. 2002;172(3):627–635
CrossRef - Tenenbaum-Rakover Y, Mamanasiri S, Ris-Stalpers C, Alina German, Joseph Sack, Stavit Allon-Shalev, Joachim Pohlenz, Samuel Refetoff. Clinical and genetic characteristics of congenital hypothyroidism due to mutations in the thyroid peroxidase (TPO) gene in Israelis. Clinical Endocrinology. 2007;66(5):695–702
CrossRef - Hashemipour M, Amini M, Iranpour R, et al. Prevalence of congenital hypothyroidism in Isfahan, Iran: results of a survey on 20,000 neonates. Hormone Research. 2004;62(2):79–83.
CrossRef

