
Manuscript accepted on :31-10-2022
Published online on: 14-11-2022
Plagiarism Check: Yes
Reviewed by: Dr. Naser Shaalan, Dr. Dewi Syahidah
Second Review by: Dr. Rajaneekar Dasari
Final Approval by: Dr. Eman Refaat Youness
Fatma M. Refaat1 , M. M. Gouda1* and Mohamed Omar2
1Department of Electronic Technology, Faculty of Technology and Education, Helwan University, Cairo, Egypt
2Biomedical Engineering Department, Faculty of Engineering, Misr University for Science and Technology MUST, Cairo, Egypt.
Corresponding Author E-mail: mohamedgouda@techedu.helwan.edu.eg
DOI : https://dx.doi.org/10.13005/bpj/2576
Abstract
The brain is the organ that controls the activities of all parts of the body. The tumor is familiar as an irregular outgrowth of tissue. Brain tumors are an abnormal lump of tissue in which cells grow up and redouble uncontrollably. It is categorized into different types based on their nature, origin, growth rate, and stage of progress. Detection of the tumor by traditional methods is time-consuming and does not widen to diagnose a large amount of data and is less accurate. So, the automatic diagnosis of the tumors in the brain by magnetic resonance imaging (MRI) plays a very important role in computer-aided diagnosis. This paper concentrates on the diagnosis of three kinds of brain tumors (a meningioma, a glioma, and a pituitary tumor). Machine learning algorithms: KNN, SVM, and GRNN are suggested to increase accuracy and reduce diagnostic time by using a publicly available dataset, features that are extracted of images, data pre-processing methods, and the principal component analysis (PCA). This paper aims to minimize the training time of the suggested algorithms. The dimensionality reducing technique is applied to the dataset and diagnosis using machine learning algorithms, such as Support Vector Machines (SVM), K-Nearest Neighbor (KNN), and Generalized Regression Neural Networks (GRNN). The accuracies of the algorithms used in diagnosing tumors are 97%, 96.24%, and 94.7% for KNN, SVM, and GRNN, respectively. The KNN is therefore regarded as the algorithm of choice.
Keywords
Brain tumor; Computer-aided diagnosis; Generalized regression neural networks; K-nearest neighbor; Principal component analysis; Support vector machines
Download this article as:| Copy the following to cite this article: Refaat F. M, Gouda M. M, Omar M. Detection and Classification of Brain Tumor Using Machine Learning Algorithms. Biomed Pharmacol J 2022;15(4). |
| Copy the following to cite this URL: Refaat F. M, Gouda M. M, Omar M. Detection and Classification of Brain Tumor Using Machine Learning Algorithms. Biomed Pharmacol J 2022;15(4). Available from: https://bit.ly/3O5P15R |
Introduction
The organ that controls the activities of all parts of the body is the brain. Brain tumors are a major cause of cancer deaths worldwide, as brain tumors can affect people of any age, and it increases the death rate among children and adults.1 The tumor is, familiar as an irregular outgrowth of tissue, and brain tumors are an abnormal lump of tissue in which cells grow up and redouble uncontrollably.2
Brain tumors are labelled into different types based on their nature, origin, growth rate, and stage of progress. The tumor is diagnosed based on its growth as a benign tumor and a malignant tumor. Benign tumors slowly grow and do not spread to neighbouring tissues, while malignant tumors rapidly grow and spread to neighbouring tissues. The most common three kinds of brain tumors are meningioma, glioma, and pituitary tumor.3 Gliomas are the more widespread kinds of brain tumors that emerge in the glial cells of a brain.4 The meningioma is a tumor that arises from the meninges — the membranes that surround the brain and spinal cord. Most meningiomas grow very slowly, often over many years, Meningiomas are the most common benign tumors.5 As for the pituitary tumor, it begins with the pituitary glands that make hormones that affect other glands and many of the body’s tasks. Complications of pituitary tumors might reason permanent deficiency from hormones and a loss vision.6
There are many kinds of tests that can be used to expose brain tumors are magnetic resonance imaging MRI, Biopsy, CT scan, etc. One of the disadvantages of other test methods such as CT scan which needs for radiation exposure and the use of a contrast material (dye) in most cases, also there is other type, namely biopsy test. In case the tests are positive for cancer, it has to be confirmed with other tests. MRI provides better soft tissue contrast than CT and can differentiate better between fat, water, muscle, and other soft tissue than CT (CT is usually better at imaging bones). Therefore, MRI is the most common method for diagnosing human brain tumors. Brain tumors diagnosis is not an easy task because of cancer cell formation and medical image analysis.7 Magnetic resonance imaging (MRI) supplies a secure, non-invasive procedure to test the brain’s macro build, microstructure, and some sides of how the brain actions, and it also a type of test that gives images with plenty pieces of information inside the human tissues with the scenery of three dimensions but the trouble with them is they are low pass image and it is tricky to segment tumor from another cell because to homogeneity. They are taken of various parts of the body such bones, lungs, and brain. We are cantering on MRI of the brain, so we must know about MRI and its processing.8
Machine Learning (ML) is a study of algorithms and statistical paradigms that can be utilized to perform a specified task without using explicit instructions, depending on patterns instead of those.9 Also, machine learning is the operation of supply computers with they might learn by utilizing the data and experience such as human brain. The major aim of machine learning is to make algorithms which can train themselves to get better, realize complex patterns, and get solutions to the modern problems by utilizing the prior data.10 Machine learning algorithms have widely stood out in the medical imaging field as a part of artificial intelligence.11 It can be split into two major categories, supervised and unsupervised. In supervised techniques, an algorithm is utilized to find the mapping function of input variables and their linked output labels to predict modern subjects’ labels. The essential goal is to learn ingrained patterns within the training data utilizing algorithms such as Artificial Neural Networks ANN12, Support Vector Machine (SVM), and K-Nearest Neighbours (KNN).13 There are two kinds of supervised learning are classification and regression.12 As for, unsupervised learning is based on only the input variables such as fuzzy c-means and others.14 Also, there are two types of unsupervised learning are clustering and association.10 Deep learning is a subset of ML that is based on artificial neural networks with representation learning. These neural networks attempt to simulate the behavior of the human brain— albeit far from matching its ability—allowing it to “learn” from large amounts of data.12 Early detection and diagnosis for brain tumors becomes an important matter in evaluating the patients and helps in choosing the most adequate treatment to save patients’ lives. Sometimes complex cases in the diagnosis stage can be confusing and Sometimes complex cases in boring for doctors. Cases like these require experts to work, identify tumors, compare tumor tissue for the surrounding areas, and apply filters to images, if necessary, to become clearer for human vision, and this task takes time and is prone to human error. Delayed detection of tumors and brain tumors, in particular, are the cause for the death of a large number of patients. So, the coming early revelation and ranking of brain tumors will increment the chances to treat the patients, and for this reason, use the computer-aided diagnosis (CAD) system for its importance in facilitating to reveal brain tumors early in timeless without intervention human.3 Nowadays, digital images are increasingly existence utilized in the medical field for diagnosis. Early recognition of brain tumors is, substantial to effectively treat tumors.15
In the literature, algorithm for the diagnosis of a brain tumor into normal, benign, and malignant by SVM that achieved an accuracy of 93%. The main advantage for SVM is that a minor alteration in the data has no influence on the hyperplane and therefore on the SVM, so, it is stable. But it takes a long time to train with a big data set.16,18 Neural networks are used for diagnosis of a brain tumor into normal and abnormal, and achieved an accuracy of 92.14%. The advantage of neural networks is lowering complexity and ease of design, but there is no a set rule for determining the appropriate network architecture.17 The classifier SVM is used for diagnosis of a brain tumor to high-grade glioma (HGG) and low-grade glioma (LGG), and it achieved an accuracy of 87.8%. Its advantages are that it is one of the best tools for data analysis and application; it is characterized by the speed of learning even with big data. Also, CNN algorithms are used for diagnosis of normal and brain tumor images, its accuracy of 89%. Its advantages are features automatically discovered without human supervision, computationally efficient. But the training process takes a long time, requires a large group to process and train the network.19 Algorithm for diagnosis of benign and malignant tumors images by SVM. The classifier SVM achieved an accuracy of 95%. Its advantage is one of the best tools for data analysis and application; it is characterized by the speed of learning even with big data. And its disadvantage is taking a long time to train.20 Algorithm for the diagnosis of a brain LGG and HGG by 3D CNN. The classifier CNN achieved an accuracy of 96.49%. Its advantages are Features automatically discovered without human supervision, computationally efficient. And its disadvantages are that the training process takes a long time, and requires a large group to process and train the network.21 Algorithm for the diagnosis of a brain tumor into LGG and high-HGG by Random Forest. The classifier Random Forest achieved an accuracy of 89%. Its advantage decrease overfitting in decision trees and assists to improve accuracy. And its disadvantage requires much computational force.22
Algorithms for diagnosis of a brain tumor, whether it is benign, malignant, or normal. Backpropagation and probabilistic neural network techniques are utilized in the diagnosis of tumors achieved an accuracy of 79.76%. PNN accuracy is more than the BPNN.23 Algorithms for diagnosing whether the image is having a tumor or not, are backpropagation neural networks and probabilistic neural networks.24 There are some disadvantages of PNN, which need a lot of memory areas to store the algorithm because the training vectors are converted into connection weight vectors; hence, the training set size is very large, and it runs slower when new cases are classified.25 An algorithm for diagnosis for a brain tumor, whether benign or malignant by the backpropagation Neural Network.26 An algorithm for diagnosis of a brain tumor by a decision tree, where brain tumors are diagnosed as being Grade 1-4 according to the World Health Organization (WHO). Grade 1: a benign tumor, the cells Like nearly with normal brain cells, and they grow slowly. Grade 2: a malignant tumor, where the cells are less similar to normal cells in Grade 1 tumor. Grade 3: a malignant tumor, but the cells are completely unlike normal cells. Grade 4: a malignant tumor, but the cells are abnormal and grow rapidly, and some problems concerning this algorithm were unstable, meaning that any alteration in the dataset could lead to a major alteration in the decision tree structure, often are imprecise relatively.25
An algorithm was used to diagnose images which had a tumor or not, by K-Means Clustering was utilized in brain tumor diagnosing. Some problems with this algorithm are that they do not work well with groups of different sizes (i.e., the original data); it is hard to presage a value of k.27 An algorithm for diagnosis the images is having a tumor or not, by convolutional neural networks to brain tumors diagnose, achieved an accuracy of 95.62%, and there were some problems, which may take a long time in training, want for large data sets, and the appropriate explanatory comments, which is an accurate procedure that needs experts in this field.28
Therefore, three other algorithms have been used to classify brain tumors: k-Nearest Neural (KNN), Support Vector Machines (SVM), and Generalized Regression Neural Networks (GRNN). Because KNN advantages by it is simple to execute, training is done in a quicker way; it does well in applications in which a sample can have lots of class labels.29 Advantages SVM via kernel function eases the complexities of almost any type of dataset, compared to other algorithms. Overfitting is less observed; a minor alteration in the data has no influence on the hyperplane and therefore on the SVM. So, the SVM algorithm is stable.30 Advantages GRNN by its Single-pass learning, so no backpropagation needed. It is flexible, requires less data; it is easier to develop, with quick training.31
In this paper, a feature extraction method integrating principal component analysis (PCA) and local binary pattern (LBP) is improved for hyperspectral images. Then the gray wolf optimization (GWO) algorithm with global search capacity is utilized to optimize the parameters of kernel maximum learning machine (KELM) to construct an optimized KELM model, which is used to effectively realize a hyperspectral image classification (PLG-KELM) method,31 utilized a robust pursuit method for unmanned aerial vehicles (UAVs) utilizing dynamic feature weight chosen. This approach is a form of dynamic feature weight selection since the feature weight may be different for each frame. Furthermore, EdgeBoxes is combined with the DSST and can adapt well to the scale and aspect ratio of the tracking box.33 A computation method for road travel time across time terms was designed. A satisfaction mensuration function based on a time window and a mensuration function of the economical cost was employed by considering time-varying vehicle speeds, fuel consumption, carbon emissions, and customers’ time windows. The object of the TDSDGVRPMTW model is to minimize the sum of the economic setback and maximize average customer satisfaction.34 In the PF3SACO, a new dynamic parameter modification mechanism by the PSO and the fuzzy method is designed to adaptively regulate the pheromone significance factor, pheromone volatilization coefficient and the heuristic function significance factor to accelerate the convergence, perfect the search ability, enhance the local search capacity and avoid prematurely.35
The main goal of the paper is to devise machine learning algorithms to detect and classify brain tumors automatically into different types (meningioma, glioma, and pituitary tumors). This work helpmates to doctors with pre-surgery decision action. The features are extracted from the images using the Gray Level Co-occurrence Matrix (GLCM) and geometric features, followed by classification using classifiers KNN, GRNN, and SVM.
The main contributions to the paper are the following:
Implementing of KNN, SVM, and GRNN algorithms to classify brain tumors;
Reaching minimum execution/training time of the algorithms on a central processing unit;
Evaluating the performance of the proposed algorithms utilizing the confusion matrix metric with dataset consists of 3064 MRI images
Enhancing the performance of the proposed machine learning algorithms via the k-fold cross-validation technique.
The remnant of the paper is marshalled you follow: in section 2, the proposed work is explained, while in section 3 the results are presented, section 4 presents the discussion about the results, then section 5 contains the conclusion.
Proposed Work
The proposed work for tumor detection of MRI brain images is shown in Fig. 1. It includes feature extraction, pre-processing, Bayesian optimization, and classification. A system is designed to be utilized easily by creating a Graphical User Interface (GUI). The steps are described as follows:
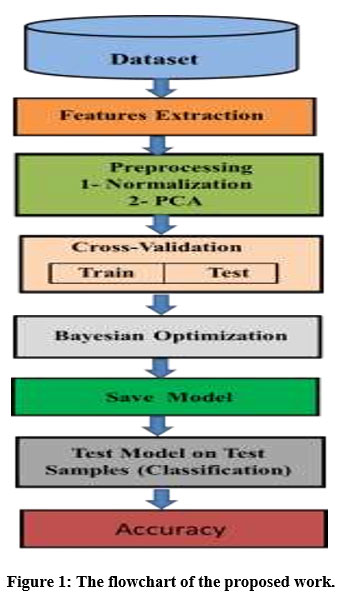 |
Figure 1: The flowchart of the proposed work. |
Dataset
The brain tumors dataset consists of 3,064 MRI slices belonging to 233 patients. These images contain three genders of brain tumors, including 708 meningioma, 1426 glioma, and 930 pituitary tumors. Image resolution of 512×512 with pixel size 0.49×0.49 mm2 is used in the present study. A slice thickness of 6 mm and a gap of 1 mm are also used, which are publicly available.36
Features Extraction
Features extraction is an important step in building any classification and aims at reducing the original data set by extracting certain features. The extraction feature is useful in identifying the exact location of the brain tumor and helps predict the next stage of the study. Features extraction consists of first and second-order statistics (GLCM) that are utilized as feature extraction. One of the first-order features is skewness. However; some of the second-order features namely energy, entropy, contrast, inverse difference moment, directional moment, and homogeneity.37 The Geometric Features namely area, the width to height Ratio, Perimeter, Solidity. Whereas, each component (i, j) is the sum of the number of times the pixel that has occurred with the value i in the spatial relationship specified by the pixel with the value j in the input image. The features are obtained as follows:
Skewness: is the symmetry measure, where the distribution, or dataset, is symmetrical if the left of the midpoint appears to be the same as its right. The normal skewness distribution is 0, and any similar data must have a skewness close to The negative values of skewness indicate that data is skewed to the left, and the positive values of the skewness indicate that data is skewed to the right.38 Where ΣΣ P(X,Y) represents the summation of all pixel values of the image and M×N is the size of the image.
![]()
Energy: is a feature that measures the smoothness of images and uniformity.39
![]()
Entropy: is the measure of randomness that is utilized to describe the texture of the input images.39
![]()
Contrast: is the measure of differences at the local level and takes high values for high contrast 37 1 and 2 represent description of how frequently two pixels with gray-levels.
![]()
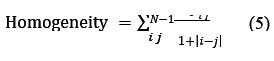
Homogeneity: is a measure of the nearness of elements distribution in gray level co-occurrence matrix to the gray level co-occurrence matrix by returning a value it ranges between 0 & 1.7
Inverse Difference Moment (IDM): is the measure for the texture of images, which means measures local for homogeneity of the image.40 Where Pi j represents the number of occurrences of grey levels i and j within the given window. G is the quantized number of grey levels.
![]()
Area: is a measure of tumor in terms of the actual number of pixels in the Region of Interest (ROI).
Width to height: The width-to-height difference is considered as a feature, the major axis length (height) and the minor axis length (width) of the ellipse are computed for 41
Perimeter: is measures of distance around a boundary of the ROI, whereas E (i,j) is the boundary pixels of a region.42
![]()
Solidity: is a proportion of pixels in the convex hull that are also in the ROI.43
![]()
Correlation: is measures of image linearity which the range between -1 and +1.37
![]()
Directional moment (DM): is a textural property for image computed by considering an alignment of image as the measure in the terms of angle.44
![]()
PID: is an identification of patients, which represents a number for each patient.
Data Pre-processing
After obtaining the resulted dataset from feature extraction, the data are pre-processed by using normalization and a PCA. Normalization is utilized to adjust data to adjust high differences between numbers and to make them all range from 0 to 1 for easy handling. The principal component analysis is the helpful technique of data analysis, that is utilized to decrease the dimensions appropriately, allowed the best imagination of the present variation in the dataset with numerous variables for every sample.
Cross-Validation
It is an important tool that helps in using data better using the K-Fold Cross Validation, the data is divided into 5-Folds from 1: 3 train (P, T) where P is the features and T is the labels, and from 4: 5 tests (P, T) as well. In the KNN and SVM algorithms, 80% is utilized for training and 20% is for testing. However; in the GRNN algorithm, 60% is utilized for training and 40% is for testing. The training group is utilized for the algorithm fitting and hyperparameters setting while the test group is utilized as the unknown test group to estimate the performance of an algorithm on unknown data.
Bayesian Optimization
It is an optimization in general, which is used to define a point that minimizes the objective function. Whereas Bayesian optimization is one for the optimization forms, and the objective function evaluation is utilized to train this algorithm. In the Bayesian optimization using a fit function used to reduce the error in the cross validated response through Bayesian optimization is as follows; the classification is chosen between the fit function, namely fitcecoc for the SVM algorithm, and while the function fitcknn is utilized for the KNN algorithm.
Select the Optimize Hyperparameters, for each fit function, select from the hyperparameters group the ‘all’, this option is utilized to optimize for all available parameters.
Select the Hyperparameter Optimization Options to select ‘Acquisition Function Name’ from which we select ‘expected-improvement-plus’, where this function is utilized to determine the next point for evaluation and a balance in taking samples at points that have a low objective function and discovering areas that were not well designed.
Classification Methods
Classification is a process in which a class is assigned to a specific test sample based on the knowledge that the classifier acquired during training. Some of the types of machine learning used in this proposed work are the following algorithms;
K-Nearest Neighbor (KNN)
Support Vector Machines (SVM)
Generalized Regression Neural Networks (GRNN)
K-Nearest Neighbor (KNN)
K-Nearest Neighbor (KNN) algorithm is one of the easiest machines learning algorithms; it is a simple classification method and supervised learning. The object is categorized by its neighbors by a majority vote for the most common class among the KNN.45 In the proposed work, k=1 by using Bayesian optimization (fitcknn). Used distance is, the city block distance among, two points, i and j, with k dimensions is calculated as follows:46
![]()
Where m is the number of features of the objects i and j. Advantages of KNN are that it is simple to execute; training is done in a quicker way, and it is applicable in which a sample can have lots of class labels29 Disadvantages are it takes up huge storage space, is sensitive to noise, and testing is slow47
Support Vector Machines (SVM)
SVM is from the latest technologies utilized in classification as it has better accuracy and mathematical advantages over some other traditional classification methods, and it is the supervised educational algorithm, utilized for classification and regression patterns, which analyze data and recognize patterns. SVM works by creating hyperplanes in a multidimensional space that separates cases of the various class labels depending on the selected kernel function. Where are kernel functions often utilized in SVM including the linear, the polynomial, the radial basis function, and the sigmoid function.48 This proposed work utilized a polynomial kernel.49
![]()
Where 1 and 2 are vectors in the input space, P is the degree of the polynomial. Advantages of SVM are the kernel function eases the complexities of almost any type of data, compared to other algorithms. Overfitting is less observed, and a minor alteration in the data has no effect on the hyperplane and therefore on the SVM. So, the SVM algorithm is stable.30 Disadvantages it is not easy to choose a ‘good’ kernel function, long training period with big data sets and high computational cost.48
Generalized Regression Neural Networks (GRNN)
GRNN is often times used for function approximation and supervised learning. A major goal of this algorithm is to get a good, mapping with the minimal error between input vector and target vector, GRNN is a single-path network, using a Gaussian activation function in a hidden layer. GRNN Consisting of four layers: the input, the hidden, the summation, and the output layers. It doesn’t need repeated training.50
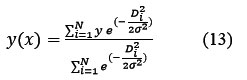
Where 𝐷2 = (𝑥 − 𝑥𝑖)𝑇(𝑥 − 𝑥𝑖), x is an input sample, xi is a training sample, (𝐷𝑖)2 is a City block distance from the x and xi,

is an activation function, y is an estimated output value-based the input x, and T means is the matrix transpose. σ is a spread the constant.51 Fig. 2 shows the structure of GRNN network consists of three layers: the input, the hidden, and the output layers, where input layer is the number of variables in the problem, hidden layer represents the number of training samples, the activation functions used, Gaussian and Linear Activation Function, and the output layer is one neuron. The advantages of GRNN are it is single-pass learning so no backpropagation is needed, it is flexible, requires less data; it is easier to develop, quick training.31 But it has drawbacks, such as its size can be huge, which would make it computationally expensive.51
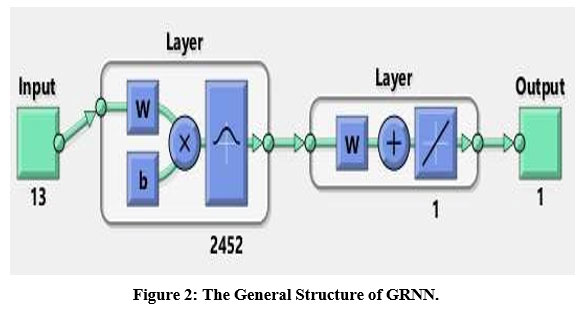 |
Figure 2: The General Structure of GRNN. |
Results
Fig. 3 shows the output of the proposed support vector machine (SVM) algorithm. The red curve represents the estimated minimum objective, while the blue curve represents the minimum observed objective. The minimum objective reaches 0.55 with a function evaluation of 30. The accuracy of this algorithm is 96.24 via Equation (14). The output is implemented using MATLAB R2019a.
![]()
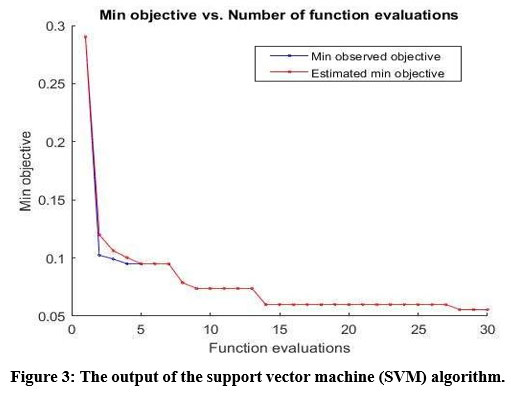 |
Figure 3: The output of the support vector machine (SVM) algorithm. |
Fig. 4 demonstrates the output of the k-nearest neighbors (KNN) algorithm. The number of functions evaluated is 30. The minimum observed objective reaches to 0.059 at a function evaluation of 30. The accuracy of the algorithm is 0.97. The generalized regression neural network (GRNN) algorithm achieves an accuracy of 94.7.
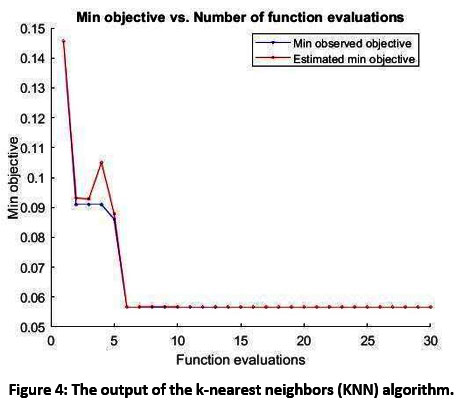 |
Figure 4: The output of the k-nearest neighbors (KNN) algorithm. |
Fig. 5 illustrates how the Bayesian optimization technique minimizes objective function of the KNN algorithm with respect to the number of neighbors k and the method of measuring distance. Various experiments with different types of distances, number of neighbors and objective function were carried out, where the value of k =1 and the city block distance gave the best evaluation result.
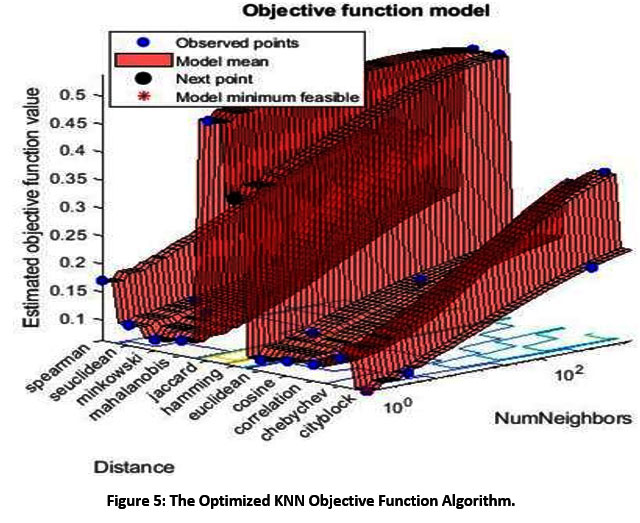 |
Figure 5: The Optimized KNN Objective Function Algorithm. |
Fig. 6 demonstrates the output of the pituitary disease with the SVM algorithm. The size of this output is 512×512. It is clear that the predicted disease matches with the true diagnosis. Fig. 7 shows the glioma disease. There is no tumor as shown in Fig. 8 which illustrates the output of the meningioma disease. In this figure, there is a detected tumor.
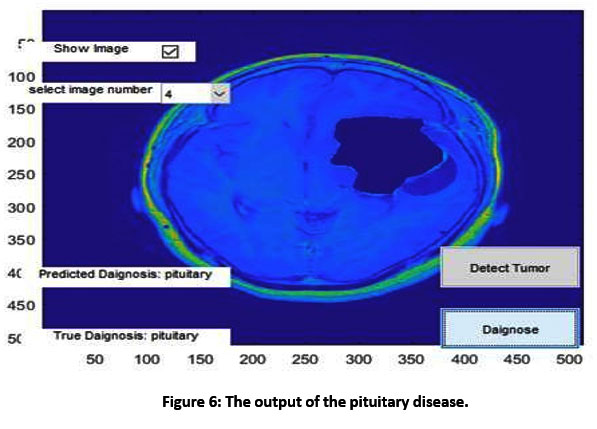 |
Figure 6: The output of the pituitary disease. |
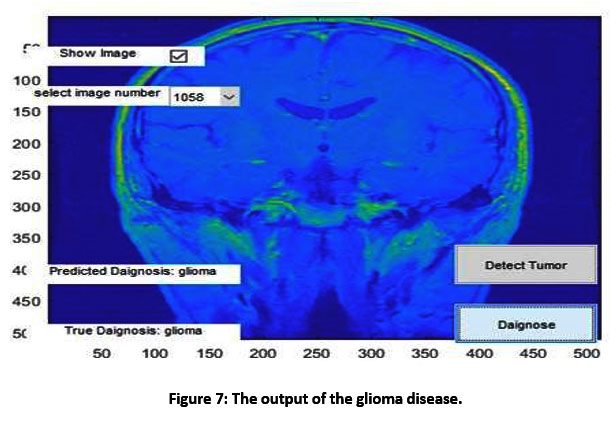 |
Figure 7: The output of the glioma disease. |
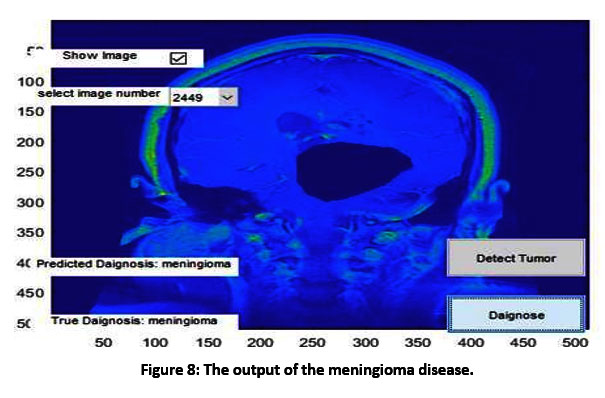 |
Figure 8: The output of the meningioma disease. |
Fig. 9 illustrates the confusion matrix for testing data with the SVM algorithm. This figure displays a maximum accuracy of 96.24% in case the predicted outputs match the targets. If the outputs are different, so the accuracies are reduced to 1 and 3. Fig. 10 shows the confusion matrix with the KNN algorithm. In this figure, the accuracy is 97%. The confusion matrix for testing data with the GRNN algorithm is demonstrated in Fig. 11, which its maximum accuracy, 94.7%.
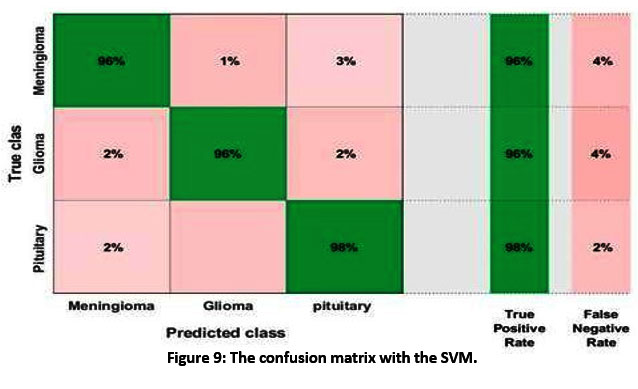 |
Figure 9: The confusion matrix with the SVM. |
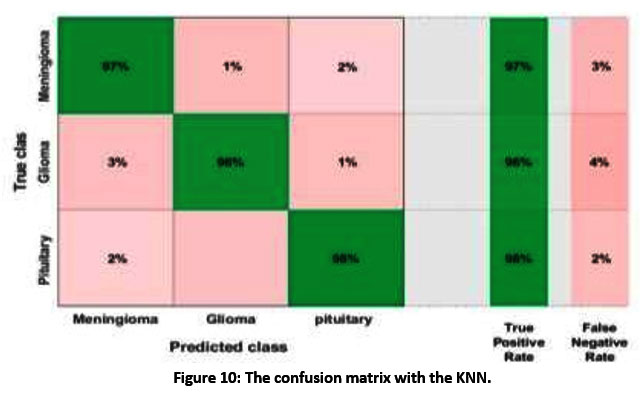 |
Figure 10: The confusion matrix with the KNN. |
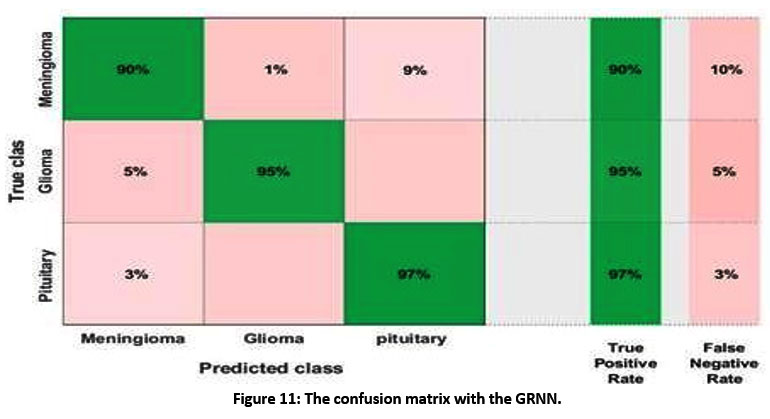 |
Figure 11: The confusion matrix with the GRNN. |
Tab. 1 illustrates the computational time elapsed for each brain tumor diagnostic algorithm in a laptop his processor (AMD A6-5350M APU with Radeon ™ HD Graphics 2.90 GHz), where the GRNN elapsed time is 178.05 seconds, KNN is 173.92 seconds, and SVM is 516.69 seconds. So, the KNN is the fastest algorithm in execution compared to the GRNN and SVM algorithms.
Table 1: Computational Time for Algorithms
| Algorithms | Computational Time (s) |
| KNN | 172.01 |
| GRNN | 178.05 |
| SVM | 493.10 |
Discussion
Diagnosis for brain tumors are made, with relation to the accuracy, methods used, image type, and data set.52-68 In this paper, algorithms for diagnosing brain tumors with MRI images to glioma, meningioma, and pituitary tumor are proposed they are KNN, SVM, GRNN. The results of the accuracy of those algorithms in classifying brain tumors were few and unsatisfactory53, 58, 59, 66-68 as illustrated in Tab. 2. During this paper, the results of the classification accuracy of brain tumors were high and also the error rate was low, because the accuracy reached 97% within the case of using KNN; 96.24% within the case of using SVM, and 94.7% within the case of using GRNN. As for the methods utilized in previous studies, KNN was used only to classify brain tumors into normal and abnormal, SVM used techniques: kernel function (linear), kernel function (RBF), SVM with quadratic kernel function, and SVM with Gaussian kernel, additionally there are other algorithms were also accustomed classify brain tumors, but the results were unsatisfactory. The proposed KNN deals with thirteen different features and used area distance with Bayesian optimization method, the worth of k is 1, while Latha et al, used features; circularity, irregularity, area, perimeter, mean, variance, standard variance, median intensity, skewness, kurtosis, contrast, correlation, entropy, energy, homogeneity, cluster shade, and also the sum of square variance.58 However, they didn’t mention the worth of k, and therefore the distance, or any method within the SVM. KNN with 11 different distances, measurements include Euclidean, Minkowski, Mahalanobis, Cosine, Manhattan, Chebyshev, Correlation, Hamming, Jaccard, Standardized Euclidean, and Spearman to check which distances are best with many datasets for brain tumors and other kinds of tumors.59
Table 2: Accuracy of Algorithms
| Reference | Accuracy (%) | Classification Method | Classification Image type | Image type | Dataset | Issued year | |
| 1 | 52
Hapsari et al. |
97 | En-CNN | Binary | MRI | BraTS 2018 dataset | 2021 |
| 2 | Neelum et al.53 | 91.83 | KNN-Inception- V3 model | Multi | MRI | dataset containing 3,064 brain | 2021 |
| 79.9 | SVM-Inception- V3 model | ||||||
| 3 | Guoliang et al.54 | 96.88 | HMM | Multi | MRI | benchmark dataset divided into training set 538 and testing set
1,571 images |
2021 |
| 4 | Ullah et al.55 | 95.8 | Feed-forward neural
network |
Binary | MRI | 71 MR images | 2020 |
| 5 | 56
Zhiguan et al. |
95.49 | CNNBCN | Multi | MRI | dataset is collected from 233 patients | 2020 |
| 6 | 57
Kalaiselvi et al. |
96 | CNN | Multi | MRI | BraTS2013 | 2020 |
| 7 | 58
Latha et al. |
88.75 | KNN | Multi | MRI | dataset containing 3,064 brain | 2020 |
| 93.32 | SVM | ||||||
| 8 | 59
Rezvan et al. |
96.76 | KNN | Multi | MRI | dataset containing 3,064 brain | 2020 |
| 9 | 60
Sanjeeva et al. |
87.06 | KNN | Binary | MRI | 44 images | 2019 |
| 85.57 | Back Propagation | ||||||
| 10 | Sathees et a 61
l. |
95.67 | SVM | Binary | MRI | BRATS brain tumor
(110 images) 62 . |
2019 |
| 11 | Shaoguo et al.63 | 90 | convolutional neural network | Binary | MRI | 64
BRATS 2015. |
2018 |
| 12 | Gaurav et al.65 | 91.77 | SVM Kernel function(linear) | Binary | MRI | 124 MRI brain images | 2017 |
| 90.01 | Kernel function (RBF) | ||||||
| 13 | Natteshan et al.66 | 85 | SVM with quadratic
kernel function |
Binary | MRI | 83 tumor affected and 9 non tumor | 2015 |
| 83.6 | SVM with RBF kernel function | ||||||
| 14 | 67
Bassam et al. |
86.90 | Feed Forward Neural Networks | Binary | MRI | (41) benign and (66) malignant MRIs | 2014 |
| 15 | 68
Mahajani et al. |
70 | KNN | Binary | MRI | PIONEER diagnostic centre
( brain tumor and normal brain) |
2013 |
| 16 | Proposed Work | 97 | KNN | Multi | MRI | dataset consists of 3,064 32
MRI |
2021 |
| 96.24 | SVM | ||||||
| 94.7 | GRNN |
Conclusions
Diagnosis of brain tumors is a significant affair in the medical field, where it diagnosing them demands high quality and accuracy, which is a time-consuming assignment even for experienced doctors. So, this work has presented a system for automated diagnosis of MRI images of brain tumors into categories a meningioma, a glioma, and a pituitary tumor. Then brain diagnosis automatically replaces cumbersome traditional methods that sometimes lead to errors, and a system is implemented using GRNN, SVM, and KNN. In addition, the algorithms of the GRNN, SVM, and KNN are devoted to classifying MRI images to glioma, meningioma, and pituitary tumors. A graphical user interface (GUI) is designed to facilitate the utilization of the system for users. The SVM achieves 0.9624% accuracy, GRNN 94.7% accuracy; KNN 97% accuracy. Conclude that the KNN algorithm provides the best diagnostic accuracy, due to the diagnostic accuracy of 97% and the error rate of 3%; the minimum observed objective reaches 0.059 at function evaluation of 30; and the computational time of KNN was less than that of SVM and GRNN. In the future, the proposed algorithms can be implemented with more datasets. Although, we have achieved very good diagnosis rates, however, the proposed system in this study requires to be tested on larger scale datasets that include various ages and races to increase its portability and extend it in other medical applications in the future.
Conflicts of Interest
declare that they have no conflicts of interest to report regarding the present study.
Funding Sources
The authors received no specific funding for this study
References
- Veer (Handore) S, Patil P.M. Brain tumor classification using artificial neural network on MRI images. International Journal of Research in Engineering and Technology.2015Dec; 4: 218–226.
CrossRef - Ranjbarzadeh R, Bagherian K, Ghoushchi S.J, Anari S, Naseri M, Bendechache M. Brain tumor segmentation based on deep learning and an attention mechanism using MRI multi-modalities brain images. Sci. Rep. 2021; 11 (1): 1–17.
CrossRef - Cheng J, Huang W, Cao S, Yang R, Yang W, Yun Z, Wang Z, Feng Q. Enhanced Performance of Brain Tumor Classification via Tumor Region Augmentation and Partition. PLoS One. 2015 Oct; 10 (10):1–13.
CrossRef - Hanif F, Muzaffar K, Perveen k, Mehmood Malhi S and Usman Simjee S. Glioblastoma Multiforme: A Review of its Epidemiology and Pathogenesis through Clinical Presentation and Treatment. Asian Pacific Journal of Cancer 2017 Jan; 18 (1) :3-9.
CrossRef - Michel Lemée J, Corniola M. V, Broi M. Da, Joswig H, Scheie D, Schaller K, Helseth E and Meling T. R. Extent of Resection in Meningioma: Predictive Factors and Clinical Sci Rep. 2019 Dec; 9(1).
CrossRef - Chatzellis E, Alexandraki I, Androulakis I. I, Kaltsas G. Aggressive pituitary tumors. Neuroendocrinology. 2015 Jan; 101(2): 87–104.
CrossRef
Lavanyadevi R, Machakowsalya M, Nivethitha J and Niranjil Kumar A. Brain Tumor Classification and Segmentation in MRI Images using PNN. IEEE Int. Electr. Instrum. Commun. Eng. ICEICE. 2017 Decem; 1–6.
CrossRef - Heo S and Lee H. Fault detection and classification using artificial neural networks. IFAC. 2018 Jan; 51(18):470–475.
CrossRef - Bishop Pattern Recognition and Machine Learning, Berlin. Germany: Springer-Verlag.2006.
- ÇELİK Ö. A Research on Machine Learning Methods and Its 2018 Aug; 1(3).
CrossRef - Litjens G, Kooi T, Bejnordi B. E, Setio A. A. A, Ciompi F, Ghafoorian M, van der Laak A. W. M, van Ginneken B and Sánchez C. I. A survey on Deep learning in Medical Image Analysis. Med. Image Anal. 2017 Dec; 42: 60-88.
CrossRef - Rajesh T and Malar R. S. M. Rough Set Theory and Feed Forward Neural Network Based Brain Tumor Detection in Magnetic Resonance in Proc. Int. Conf. Adv. Nanomaterials Emerg. Eng. Technol. (ICANMEET), 2013 Jul; 240-244.
CrossRef - Machhale K, Nandpuru B, Kapur V and Kosta L. MRI brain cancer classification using hybrid classifier (SVM-KNN). in Proc. Int. Conf. Ind. Instrum. Control (ICIC), 2015 May; 60-65.
CrossRef - Shasidhar M, Raja V. S, and Kumar B. V. MRI Brain Image Segmentation Using Modified Fuzzy C-means Clustering Algorithm, in Int. Conf. Commun. Syst. Netw. Technol. (CSNT). 2011 Jun; 473-478.
CrossRef - Hossam Sultan H, Nancy Salem M and Al-Atabany W. Multi-Classification of Brain Tumor Images Using Deep Neural Network, IEEE Access, 2019 May; 7:2169-3536.
CrossRef - Abd Alreda B, Khalif H and Saeid Automated Brain Tumor Detection Based on Feature Extraction from The MRI Brain Image Analysis, Iraqi J. Electr. Electron. Eng., 2020; 16 (2) 1–10.
CrossRef - Arunkumar N, AbedMohammed M, Mostafa A, Ahmed Ibrahim D, Rodrigues J. J.P.C, and Hugo V de Albuquerque C. Fully automatic model- based segmentation and classification approach for MRI brain tumor using artificial neural networks. 2018.
CrossRef - Aziz A, Attique M, Tariq U, Nam Y, Nazir M, Jeong Ch, mostafa R, Sakr R.H. An ensemble of optimal deep learning features for brain tumor classification, Comput. Mater. Contin. 2021; 69 (2): 2653–2670.
CrossRef - Gokila Brindha P, Kavinraj M, Manivasakam P, and Prasanth P. Brain tumor detection from MRI images using deep learning techniques, IOP Conf. Ser. Sci. Eng., 2021; 1055(1), 012115.
CrossRef - Hamid M. A. A and Khan N. A. Investigation and classification of MRI brain tumors using feature extraction technique. J. Med. Biol. Eng., 2020; 40 (2): 307–317.
CrossRef - Mzoughi H et al. Deep Multi-Scale 3D Convolutional Neural Network (CNN) for MRI Gliomas Brain Tumor Classification, J. Digit. Imaging, 2020; 33 (4): 903–915.
CrossRef - Latif G, Butt M, Khan A. H, Butt O and Iskandar D. N. F. A. Multiclass brain Glioma tumor classification using block-based 3D Wavelet features of MR images. 4th Int. Conf. Electr. Electron. Eng. ICEEE 2017; 333–337.
CrossRef - Kohir V and Karaddi H. S. Detection of Brain Tumor Using Back Propagation and Probabilistic Neural Network. 19th IRF International Conference Chennai, 2015Jan; 74-80.
CrossRef - Jain S and Mishra ANN Approach Based on Back Propagation Network and Probabilistic Neural Network to Classify Brain Tumor. International journal of innovative technology and exploring engineering, 2013 Aug; 3(3) :101-105.
CrossRef - Hajmeer M, Basheer A Probabilistic Neural Network Approach for Modeling and Classification of Bacterial Growth/no-Growth Data. Journal of Microbiological Methods 51, 2002 Nov; 217 – 226.
CrossRef - Rekha V, Sudha S, Sangeetha J and Anantharajan S. C.A.D.S., for Classification of MRI Brain Tumour Using Decision Tree. 2014 Mar; 3(3):10509–10516.
CrossRef - Kumar Singh N, Singh Automatic Detection of Brain Tumor Using K-Means Clustering. Int. J. Res. Appl. Sci. Eng. Technol. 2017Nov; V(XI): 114–121.
CrossRef - Mohammed M, Sree Nalluru S, Tadi S, Samineni R. Brain Tumor Image Classification Using Convolutional Neural Networks, J. Adv. Sci. Technol., 2020; 29 (5): 928-934.
CrossRef - Sayali Jadhav D, Channe H. P. Comparative Study of K-NN, Naive Bayes and Decision Tree Classification Int. J. Sci. Res. 2016 Jan; 5(1): 1842– 1845.
CrossRef - Myint Oo M, Kamolphiwong S, Kamolphiwong T and Vasupongayya Advanced Support Vector Machine- (ASVM-) Based Detection for Distributed Denial of Service (DDoS) Attack on Software Defined Networking (SDN). 2019; Article ID 8012568.
CrossRef - Jobran Al-Mahasneh A, Anavatti G and Garratt M. A. Review of Applications of Generalized Regression Neural Networks in Identification and Control of Dynamic Systems. 2018.
CrossRef - Chen H, Miao F, Chen Y, Xiong Y, and Chen A Hyperspectral Image Classification Method Using Multifeature Vectors and Optimized KELM. IEEE
- Sel. Top. Appl. Earth Obs. Remote Sens. 2021; 14: 2781–2795.
CrossRef
- An Z, Wang X, Li B, Xiang Z and Zhang Robust visual tracking for UAVs with dynamic feature weight selection. Appl. Intell 2022; 1–14.
CrossRef - Wu D. and Wu C. Research on the Time-Dependent Split Delivery Green Vehicle Routing Problem for Fresh Agricultural Products with Multiple Time Agriculture. 2022; 12 (6) 793.
CrossRef - Zhou X, Ma H, Gu J, Chen H, and Deng W. Parameter adaptation-based ant colony optimization with dynamic hybrid Eng. Appl. Artif. Intell.2022; 114: 105139.
CrossRef - Cheng Brain Tumor Dataset. 2017Apr; 2, Distributed by Figshare. Accessed: February.
CrossRef - NYEIN NYEIN HLAING K. First Order Statistics and GLCM Based Feature Extraction for Recognition of Myanar Paper Currency. IIER Int. Conf., 2015 Aug; 2011: 1–6.
CrossRef - Ravichandran D, Nimmatoori R, Dhivakar MR A. A study on Image Statistics and Image Features on Coding Performance of Medical Images. Int. J. Adv. Eng. Commun. Technol. 2016; 5(1): 1–6.
CrossRef - Shilpa Sanghavi B, Shelke R. J. Brain Tumor Classification and Segmentation using PNN & FCM Clustering, International Journal of Innovative Research in Computer and Communication Engineering, 2018 Apr; 6(4): 3221–3227.
CrossRef - Pergad D, Shingare K. V. Brain MRI Image Classification Using Probabilistic Neural Network and Tumor Detection Using Image Segmentation, International Journal of Advanced Research in Computer Engineering & Technology (IJARCET). 2015 June; 4(6):2278 – 1323.
CrossRef - Selvan S, Kavitha M, Shenbagadevi S and Suresh S. Feature Extraction for Characterization of Breast Lesions in Ultrasound Echography and 2010; 6(1): 67–74.
CrossRef - Kumar S Dharun P.S, V.S. Extraction of Texture Features Using GLCM and Shape Features Using Connected Regions, International Journal of Engineering and Technology (IJET). 2017 Dec; 8 (6).
CrossRef - Mohammad Alawad D, Mishra A and Tamjidul Hoque Md. AIBH: Accurate Identification of Brain Hemorrhage Using Genetic Algorithm Based Feature Selection and Stacking. 2020; 2(2): 56–77.
CrossRef - Chaddad A, Tanougast C, Dandache A, Bouridane A. Extracted Haralick’s Texture Features and Morphological Parameters from Segmented Multispectrale Texture Bio-Images for Classification of Colon Cancer Cells. 2011 April; 8(2).
CrossRef - Chao Li, Zhang Sh, Zhang H, Pang L, Lam K, Hui Ch and Zhang Using the K-Nearest Neighbor Algorithm for the Classification of Lymph Node Metastasis in Gastric Cancerc. 2012; Article ID 876545.
CrossRef - Paul S and Maji City Block Distance for Identification of Co-expressed MicroRNAs. Springer International Publishing Switzerland. 2013; 387–396.
CrossRef - Wang J and Xia An improved KNN algorithm for text classification. ICINA, IEEE. 2010; 2: 436–439.
CrossRef - Roy K, Narayan Das R. Selected Statistical Methods in QSAR, Understanding the Basics of QSAR for Applications in Pharmaceutical Sciences and Risk 2015 Dec; 191-229.
CrossRef - Muhammad Asraf H, Nooritawati M. T, Shah Rizam M.S.B. A Comparative Study in Kernel-Based Support Vector Machine of Oil Palm Leaves Nutrient IRIS 2012; 41(Iris): 1353–1359.
CrossRef - Kumar G, Malik Generalized Regression Neural Network Based Wind Speed Prediction Model for Western Region of India. ICACC, 2016Sep; 93(September): 26–32.
CrossRef - Ding L, Rangaraju P, Poursaee Application of generalized regression neural network method for corrosion modeling of steel embedded in soil. Soils and Foundations 59, 2019; 474–483.
CrossRef - Peni Agustin Tjahyaningtijas H, Julianensi Rumala D, Very Angkoso C, Zainal Fanani N, Santoso J, Dwi Sensusiati A, A van Ooijen P, Eddy Purnama I. K, Hery Purnomo M. Brain Tumor Classification in MRI Images Using En-CNN. International Journal of Intelligent Engineering and Systems. 2021 Aug; 14(4): 437–451.
CrossRef - Noreen N, Palaniappan S, Qayyum A, Ahmad I and Alassafi O. Brain Tumor Classification Based on Fine-Tuned Models and the Ensemble Method. 2020 Dec; 67(3): 3967–3982.
CrossRef - Guoliang Li, Sun J, Song Y, Junfeng Qu, Zhiyu Zhu, Khosravi R. Real‑time classification of brain tumors in MRI images with a convolutional operator‑based hidden Markov model. 2021Aug; 18(4):1207–1219.
CrossRef
Ullah Z, Farooq M.U, Lee S.H and Hybrid D. A. Image Enhancement Based Brain MRI Images Classification Technique. Med. Hypotheses 2020 Oct.; 143 (109922).
CrossRef - Huang Z, Xiaohao DU, Iangming Chen L, Yuhe Li, Mei Liu, Chou Yao, and Long Jin. Convolutional Neural Network Based on Complex Networks for Brain Tumor Image Classification with a Modified Activation Function. IEEE 2020; 8: 89281–89290.
CrossRef - Kalaiselvi T, Padmapriya S. T, Sriramakrishnan P, Somasundaram. Deriving Tumor Detection Models Using Convolutional Neural Networks from MRI of Human Brain Scans. 2020 Jun;12(2): 403–408.
CrossRef - Latha S, Sreekanth G. R, Akash P, Dinesh B, Deepak kumar S. Brain Tumor Classification Using SVM And KNN Models for Smote Based MRI Images. 2020; 7 (12): 1–4.
CrossRef - Ehsani R, and Drabløs Robust Distance Measures for KNN Classification of Cancer Data. 2020 Sep; 19: 1–9.
CrossRef - Polepaka S, Srinivasa Rao Ch, and Chandra Mohan IDSS-based Two stage classification of brain tumor using SVM. Springer Nature. 2019; 10:249–258.|
CrossRef - Sathees kumar Identification and Classification of Brain Tumor Images Using Efficient Classifier, 2019 Aug; 8(6): 2249 – 8958.
CrossRef - Bakas S, Akbari H, Sotiras A, Bilello M, Rozycki M, Kirby S, Freymann J.B, Davatzikos Ch. Identifying the Best Machine Learning Algorithms for Brain Tumor Segmentation. Progression Assessment, and Overall Survival Prediction in the BRATS Challenge. arXiv preprint arXiv:1811.02629, 2018.
CrossRef - Cui Sh, Mao L, Jiang J, Liu Ch, and Xiong Automatic Semantic Segmentation of Brain Gliomas from MRI Images Using a Deep Cascaded Neural Network. J. Healthc. Eng. 2018.
CrossRef - Menze B. H, Jakab A, Bauer S et al. The Multimodal Brain Tumor Image Segmentation Benchmark (BRATS). IEEE Transactions on Medical Imaging, 2015; 34 (10): 1993– 2024.
CrossRef - Gupta G, singh Brain Tumor Segmentation and Classification Using Fcm and Support Vector Machine. 2017 May; 4 (5)
CrossRef
- Natteshan V.S and Angel Arul Joth J. Automatic Classification of Brain MRI Images Using SVM And Neural Network Classifiers, © Springer International Publishing Switzerland. 2015.
CrossRef - Al-Naami B, Abu Mallouh M, Abdel Hafez E. A. Performance Comparison of Adaptive Neural Networks and Adaptive Neuro- Fuzzy Inference System in Brain Cancer Classification. 2014 Oct; 8(5): 305–312.
CrossRef - Mahajani S. Detection and Classification of Brain Tumor in MRI Images. 2013 July; 5(1): 2320–9569.
CrossRef

