
Manuscript accepted on :26-09-2022
Published online on: 19-10-2022
Plagiarism Check: Yes
Reviewed by: Dr. Digamber Singh, Dr. Sumayah Faruq
Second Review by: Dr. Hiren B. Soni
Final Approval by: Dr. Eman Refaat Youness
Abeer Nawaf Albqoor1*, Mohammad Y. Alzaatreh2 and Mohammad K. I. Almatari1
1Department of Physics, Faculty of Science, Al-Balqa Applied University, Salt 19117, Jordan.
2 Prince Al Hussein Bin Abdullah II Academy for Civil Protection, Department of applied medical sciences, Al-Balqa Applied University, Al-Salt, Amman, 41111, Jordan.
Corresponding Author E-mail: abeerabobaquar@bau.edu.jo
DOI : https://dx.doi.org/10.13005/bpj/2533
Abstract
Lung Cancer is the most common cancer diagnosed worldwide. It causes a higher amount of deaths. For the survival of cancer patients, early detection and treatment are beneficial and effective. Computer-aided diagnosis (CAD) is one of the most effective techniques utilized for image processing for lung cancer detection. Also, it’s the best image-based method for locating tiny nodules which facilitate early diagnosis of lung cancer. In this paper, the authors implemented a proposed CAD model. The proposed model successfully detected a very small tumor sized between 500 -1000 sq mm and can detect a smaller lung tumor than 500 sq mm if present which will enable physicians to early detect and appropriately stage lung cancer.
Keywords
Computed Tomography; CAD; Lung Cancer
Download this article as:| Copy the following to cite this article: Albqoor A. N, Alzaatreh M. Y, Almatari M. K. I. A Novel Method of Segmentation and Analysis of CT Chest Images for Early Lung Cancer Detection. Biomed Pharmacol J 2022;15(4). |
| Copy the following to cite this URL: Albqoor A. N, Alzaatreh M. Y, Almatari M. K. I. A Novel Method of Segmentation and Analysis of CT Chest Images for Early Lung Cancer Detection. Biomed Pharmacol J 2022;15(4). Available from: https://bit.ly/3s4DtWn |
Introduction
One of the most important health issues in the world is CANCER 1. Among all types of cancer, lung cancer has the greatest fatality rate 2. Lung cancer is one of the most serious cancers in the world, as its signs and symptoms don’t appear until it reached a late stage, spreads rapidly, and low survival rate after a late diagnosis 3. In 2022, it’s estimated that About 236,740 new cases of lung cancer and about130,180 deaths from lung cancer in the United States alone 4.
The Growth of lung cancer at the time of identification is directly correlated with survival, the earlier the detection is, the higher the chances of successful treatment are 5. Early lung cancer detection improves the chances of successful therapy 6. Unfortunately, in the era of COVID-19, most elective procedures such as screening efforts for cancer decreased which led to a further decrease in early lung cancer detection which significantly affects the prognosis of lung cancer 7.
Several radiological methods were used to diagnose lung cancer. However, Chest radiographs are no longer used to investigate the presence of the disease, but CT scans can reveal the disease’s spread and source 2. In a CT scan, a bump is identifiable as a rounded, bumpy, thick number with a diameter of up to 30mm. Each skim contains hundreds of descriptions that a radiologist must analyze, which is a laborious process. Because of this, using a Computer-Aided Detection (CAD) system can help radiologists scan more efficiently than before while also potentially improving bump detection 8.
CAD is a relatively recent technique that combines digital image processing with the foundations of CPU vision, which is a relevant area of artificial intelligence. Applications of CAD include nuclear medicine, coronary artery disease, a hereditary flaw in the nucleus, and the discovery of lung, breast, and colon corruption. According to CAD in radiology, the radiologist will employ the results of a predetermined evaluation of a corrective image 9. The fundamental idea is to increase overall sensitivity detection evaluation more quickly than simply providing a diagnosis to a CAD system that has been deployed by automating the identification of problematic objects. As a result, the coupled compensation is varied. CAD promotes therapeutic success in the challenge of early illness detection and may avoid unnecessary biopsies. Additionally, it lowers the likelihood of errors in vetting scenarios with a massive stack of medical descriptions 10. In this article, we aim to assess the ability of the proposed CAD model to detected a very small tumor size between 500 -1000 sq mm and appropriately stage the lung cancer according to its size
Background of Study
Several studies have utilized CAD models to facilitate the early diagnosis of cancer. As an example, the work of Shamala B. Terdale and K. V. Kulhalli (2012) 11. They proposed a CAD system for lung county identification by artificial neural connection. The method used in the past to locate lung protuberances is effective for locating lung bumps larger than 2 mm in diameter. The five main processes of the intended CAD system are lung state extraction, lung segmentation, protuberance identification, piece extraction, and piece extraction using a neural network. The ANN technique is outdated for identifying honest and dishonest contestant nodules. The three central layers in an ANN setup are the contribution layer, the unseen layer, and the output layer. The Go Backward Broadcast Algorithm is used to qualify the arrangement (BPA). BPA has been around for a while to lessen errors caused by discrepancies between actual output and expected results. The characteristic interaction parameters, such as covert nodes, the guiding percent for instruction ANN, the number of epochs, etc., are used to generate the effective ANN. Following the successful meeting of the people, the categorization procedure is set up. In this essay, the accuracy, sensitivity, and specification characteristics are used to calculate the occurrence of the CAD system. The major borough of hobby provides the polite segmentation conclusion in this work in a little amount of time. On the whole principal return of this system is it can learn in rank in data.
Similarly, in 2013, Naveed Ejaz and his collaborative 9 research team published their findings on the future contour detection strategy for the identification of lung disease protuberance and how to use CAD sorting for lung cancer diagnosis. The lung protuberance is installed in the regular, pronounced channel of the contour detection technique, and the discarded extra region is furthermore displayed in that. Consequently, a novel technology known as Contour Detection with Circumstance Removing has been devised to remove this unwelcome expanse. The maximum Density Algorithm is used to detect applicant bumps. The newly designed property solidity has a complex origin in determining the nodule’s identification. To identify an applicant’s bump as a lump or non-nodule, the highlight datasheet is used. Two tasks are often involved with CAD systems. The first is identification, where we identify the lung threat protuberance from the examination image. The second task is classification, which has two stages: the first stage is a protuberance that is additionally categorized as benign or malignant, while the second stage is a protuberance that is classed as a bump and non-protuberance from the selected contestant protuberance. Contour detection methodology is a new technique for identifying lung sarcoma protuberances in CT inspection images. The counter definition does not apply to the little range nodules. The assembly update in the definition of the contour addresses this flaw.
Another example is the work of Noriyasu Homma 12 who lead the development of CAD technology based on a CT scan for the identification of lung scourges. The diagnosis of lung protuberance in an earlier stage is achievable because of CAD technology. The n-Quite filter is utilized for the identification of inaccessible pulmonary nodules. The non-isolated nodules associated with the chest blockade are not found, and only the lone nodules are observed. The lung illness nodule was discovered using a full-zip contour type. A masking issue may result from the opening fall and no single bump connected to the partition. With the use of a proposed algorithm, this might be resolved. The original shape features a very much curved, fast surround. The capable sharp contour prototype can put up a brilliant pin-down line. The non-isolated nodules attached to the chest’s border are transformed into isolated nodules in the improved approach, so they may be seen more clearly by the traditional CAD method. The cutting-edge CT image will be used to extract the lung neighbourhood, transferring knowledge to be accomplished.
Methods
The CAD system that will be utilized in this paper for the detection of lung nodules in the raw 3D-CT chest is shown in Figure 1. The phases of the CAD system that will be used in this study for the detection of lung nodules in raw 3D-CT chest CT images will be discussed below.
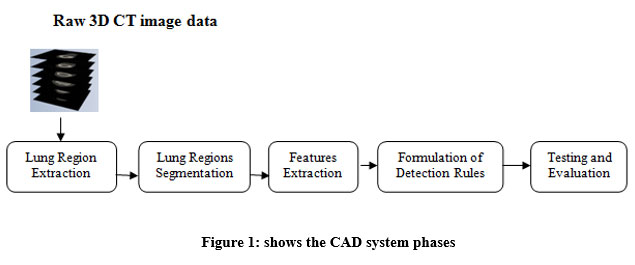 |
Figure 1: shows the CAD system phases. |
Lung Region Extraction
The lung area extraction module is our CAD system’s first module. Basically, many fundamental image processing methods are applied to extract the lung area. As shown in figure 2, the steps are as follows: 1) Bit plane slicing, 2) Erosion, 3) Median filter, 4) Dilation, 5) Outlining, 6) Lung boundary extraction and 7) Flood fill. Each plane of the image is divided during the bit plane slicing procedure to analyse the significance of each bit in the image. This procedure is used to calculate the appropriate number of bits to employ to quantize each pixel. Decay is a helpful and essential input for picture compression. It is not difficult to program that the (binary) image for bit-plane 7 is known to be acquired by dealing out effort picture with a thresholding grey level transformation function at this time of bit plane extraction for an 8-bit image.
 |
Figure 2: Lung region extraction process. |
One of the two core procedures in morphological image processing is erosion. Erosion is simply the act of compressing or reducing the original picture with the aid of a structural component. The operator’s primary impact on a binary picture is to blur the borders of the pixels’ foreground region (i.e. white pixel and typically). The primary principle of erosion is that every pixel in the key and its vicinity must have a minimum value. If any of the pixels in a double image are set to 0, the output pixel is also set to 0. The median filter process comes next.
A non-linear digital filtering method called the median filter is used to eliminate noise. Salt and pepper noise is one type of noise that is occasionally applied to images. Therefore, median filtering is employed to eliminate certain kinds of noise. The term “median filter” refers to a method where we assume a single empty mask for all sides and overlap it with the first three values. If the mask size is 3*3, all of the overlapping picture pixels are organized in either ascending or descending order, and then the midpoint of the array is selected as the first pixel of the new output image. This filter won’t add a blurring effect to the image’s edges.
Another essential component in morphological image processing is dilation. This is the exact opposite of how erosion works. It widens the original image’s bounds during dilatation. A binary image’s primary impact is to gradually extend the borders of the pixel foreground region (i.e. white pixel and typically). The primary principle of dilation is that the rate of the output pixels is equal to the total maximum value of all the pixels in the vicinity of the important pixels. In a binary picture, the output pixel is set to 1 if any of the pixels are set to the value 1.
We obtain the original image’s outline throughout the outlining process. The bwboundaries trace boundary function and borders function are used for outlining. The row and column coordinates of each pixel along an object’s border of an image are returned by the bwboundaries trace boundary function. The object’s boundary pixel position must be specified as the trace’s starting point. The row and column coordinates of each object’s border pixel are returned by the bwboundaries function. The binary image’s nonzero pixels are associated with an object in both functions, whereas pixels with a value of 0 (zero) make up the backdrop.
A lung border can be extracted by using various border extraction algorithms. Some of them are listed below.
Border = (A-A Erosion B)
Flood fill is the final step in the lung area extraction process. Flood fill, also known as seed fill, is a method that identifies the region in a multidimensional array that is associated with a certain node. It is used in games like Go and Minesweeper to determine which pieces are cleared as well as in paint applications’ “bucket” fill tool to fill linked, similarly colored regions with a distinct color. It is also known as boundary fill when used on an image to fill a certain defined region with color. At the last lung, the region is extracted with the help of all the above morphological methodologies
Lung Regions Segmentation
Segmenting the lung region to look for potential nodules follows the detection of the lung region. By doing so, a new area of interest (ROI) that aids in the detection of the cancer region will be identified. The division of a picture is what segmentation is all about. Typically, segmentation is employed to identify objects and picture boundaries.
Based on the information included in the raw CT pictures, which is the intensity of each pixel of each tissue supplied by the employed CT scan, the segmentation procedure of the extracted lung regions is created. The screening of medical imaging greatly benefits from image segmentation. In this case, inaccurate segmentation of the lung parenchyma would significantly reduce the accuracy of algorithms for identifying lung nodules or classifying lung illnesses. According to a recent review on adaptive segmentation of the pulmonary lobes and tumor identification from chest CT scan images, some segmentation techniques are classified as semi-automatic algorithms that require some user interaction, while others are fully automatic and limit the user’s role to verification.
Based on the information included in the raw CT pictures, which is the intensity of each pixel of each tissue supplied by the employed CT scan, the segmentation procedure of the extracted lung regions is created. The screening of medical imaging greatly benefits from image segmentation. In this case, inaccurate segmentation of the lung parenchyma would significantly reduce the accuracy of algorithms for identifying lung nodules or classifying lung illnesses. According to a recent review on adaptive segmentation of the pulmonary lobes and tumor identification from chest CT scan images, some segmentation techniques are classified as semi-automatic algorithms that require some user interaction, while others are fully automatic and limit the user’s role to verification.
Feature Extraction
It is a crucial step in the picture processing process. It locates the required area or form inside an image. The categorization procedure is built on the extracted characteristics. To create diagnostic guidelines to find cancer nodules, these characteristics are employed to find cancer nodules. The number of impacted circles, tumor area size and total time elapsed in seconds are the characteristics that were considered in this investigation.
After the segmentation process, we get the circles with different boundary colors. These circles are nothing but regions affected by cancer. The total number of circles denotes the total number of affected circles by lung cancer.
The area in which the number of affected circles is present is given by the area size of the tumor. This area shows how much area is affected by cancer nodules. It calculates the total area of affected nodules.
The last feature is time. Time is a very important parameter in every field, in every process. The time to complete the entire process is given by total time.
Formulation of Detection
After the necessary features are extracted, the following detection rules are applied. These rules are applied to the segmented lung region.
Rule 1
If the number of circles is smaller than or equal to 10 (i.e. Number of circles<=10), then a small tumor is detected in the lung region. That means the cancer is at its initial stage. Stage 1 is detected. And the total area affected by this is between 500 to 1000 sq. mm.
Rule 2
If the number of circles is greater than 10 and smaller than or equal to 15 (i.e. Number of circles>10 and Number of circles<=15), then cancer is confined to the lung. That means stage 2 is detected. The total area affected by cancer is between 1001 to 5000 sq. mm.
Rule 3
If the number of circles is greater than 15 and smaller than or equal to 20 (i.e. Number of circles>15 and Number of circles<=20), then cancer is confined to the chest. That means stage 3 is detected. The total area affected by cancer is between 5001 to 8000 sq. mm.
Rule 4
If the number of circles is greater than 20 (i.e. Number of circles>20), then cancer has spread from the chest to other parts of the body. That means stage 4 is detected. The total area affected by cancer is between 8001 to 10000 sq. mm.
Testing and Evaluation
In testing and evaluation, we are going to analyze the results for different images using our proposed CAD system
Results
In the result analysis, we are going to test and evaluate all rules of our proposed system on selected images. In this paper, we will use MATLAB (Matrix Laboratory) software for processing the image: It allows matrix manipulation and plotting of functions and data. MATLAB (matrix laboratory) is a multi-paradigm numerical computing environment. A proprietary programming language developed by Math Works, MATLAB allows matrix manipulations, plotting of functions and data, implementation of algorithms, creation of user interfaces, and interfacing with programs written in other languages, including C, C++, C#, Java, Fortran and Python through this software. We will check all rules formulated to define the stage of cancer and the results as seen in the figures below. As shown in Figure 3.1 and Table 1, the number of affected circles and the area size of the tumor is 0 (Zero). That means the lung is not affected by any cancerous cells. Hence the Lung is normal.
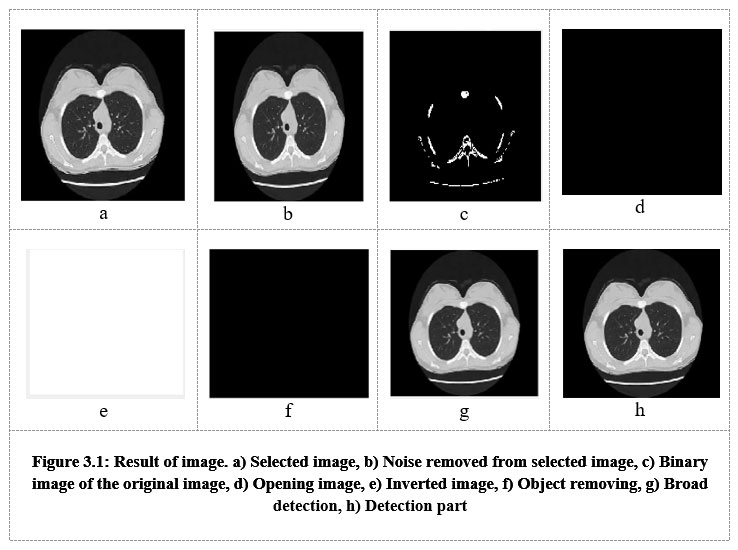 |
Figure 3.1: Result of image. a) Selected image, b) Noise removed from selected image, c) Binary image of the original image. |
Table 1: Parameters of image 1
| Parameters of image 1 | ||
| No. | Parameter | Value |
| 1 | No. of affected circle | 0 |
| 2 | Area size of Tumor | 0 sq mm |
| 3 | Total time elapsed | 0.315219 sec |
Testing and evaluation of rule number 1 are shown in Figure 3.2. In this image, the number of affected circles is 8, and the area size of the tumor is between 500 to 1000 sq mm (Table 2). Hence, the initial stage (stage 1) of cancer is detected in the lung. Testing and evaluation of rule number 2 appear in Figure 3.3 below. The parameters of the images are: no. of the affected circle is 1, and the area size of the tumor is 1175 sq mm. As we know that if the area size of the tumor is between 1001 and 5000 sq mm (Table 3), then stage 2 is detected. The tumor is represented by an 1175 sq. mm area in this image. Hence stage 2 of lung cancer is detected. Testing and evaluation of rule no. 3 is shown in Figure 3.4. The parameters of the images are: the number of the affected circle is 1 and the area size of the tumor is 3971 sq mm. As we know that if the area size of the tumor is between 5001 and 8000 sq mm (Table 4), then stage 3 is detected. For this image, we get a 3971 sq. mm area size of the tumor. Hence, stage 3 of lung cancer is detected. And this cancer has been confined to the chest. Testing and evaluation of the final rule are described in Figure 3.5. In this image, no. of affected circles is 26, and the area size of the tumor is between 8001 to 10000 sq mm (Table 5). As we know that if the area size of the tumor is between 8001 and 10000 sq mm, then stage 4 is detected. Hence, here (stage 4) stage 4 of lung cancer is detected. And this Cancer has spread from the chest to another part of the body.
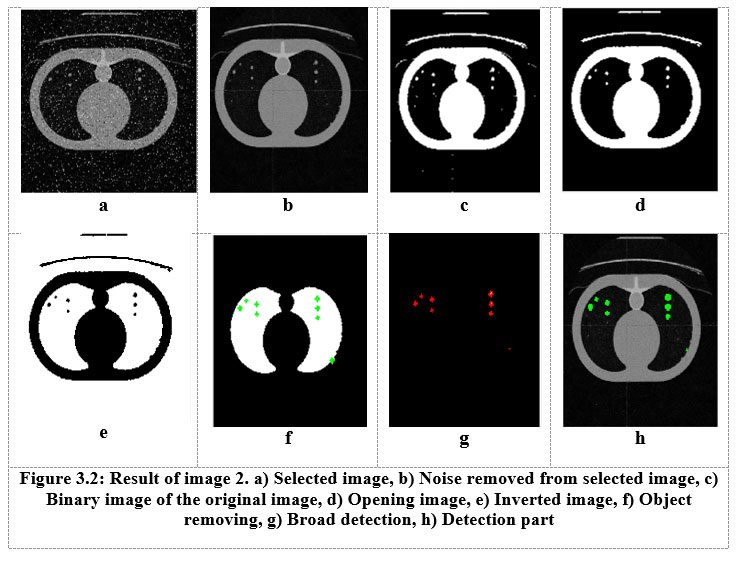 |
Figure 3.2: Result of image 2. a) Selected image, b) Noise removed from selected image, c) Binary image of the original image. |
Table 2: Parameters of image 2
| Parameters of image 2 | ||
| No | Parameter | Value |
| 1 | No. of affected circle | 8 |
| 2 | Area size of Tumor | 500 to 1000 sq mm |
| 3 | Total time elapsed | 31.9023 sec |
 |
Figure 3.3: Result of image 3. a) Selected image, b) Noise removed from selected image, c) Binary image of the original image. |
Table 3: Parameters of image 3
| Parameters of image 3 | ||
| No | Parameter | value |
| 1 | No. of affected circle | 1 |
| 2 | Area size of Tumor | 1175 sq mm |
|
3 |
Total time elapsed |
2.54712 sec |
 |
Figure 3.4: Result of image 4. a) Selected image, b) Noise removed from selected image, c) Binary image of the original image, |
Table 4: Parameters of image 4
| Parameters of image 4 | ||
| No | Parameter | value |
| 1 | No. of affected circle | 1 |
| 2 | Area size of Tumor | 3971 sq mm |
| 3 | Total time elapsed in | 8.85801 sec |
 |
Figure 3.5: Result of image 5. a)Selected image, b)Noise removed from selected image, c) Binary image of the original image. |
Table 5: Parameters of image 5.
| Parameters of image 5 | ||
| No. | Parameter | value |
| 1 | No. of affected circle | 26 |
| 2 | Area size of Tumor | 8001 to 10000 sq mm |
| 3 | Total time elapsed | 32.0801 sec |
Conclusion
Of all cancer types, lung cancer is the most lethal. Today, we are aware that sickness is the leading cause of mortality. The number of those passing away from lung tumors increases gradually. The key components of the suggested CAD system are pre-handling and division. The stages of the CAD model start with selecting a CT image, then a custom filter is used to remove the noise from the input image, and then the morphological process contains multiple sub-processes like Segmentation, Erosion, Dilation, Outlining, Border Extraction, and finally, the detection of the cancerous region in the image and Enhance cancerous region from the status of candidate of false or true positive status. With the aid of the patient’s electronic record, the number of false positives decreased. The proposed model successfully detected a very small between 500 -1000 sq mm and can detect a smaller lung tumor than 500 sq mm which will enable physicians to early detect and appropriately stage lung cancer.
Conflict of Interest
There is no conflict of interest.
Funding Sources
There is no funding source.
References
- Zugazagoitia J, Guedes C, Ponce S, Ferrer I, Molina-Pinelo S, and Paz-Ares L. Current challenges in cancer treatment. Clin. Ther., 2016;38(7):1551-66.
CrossRef - Al Mohammad B, Brennan PC, and Mello-Thoms C. A review of lung cancer screening and the role of computer-aided detection. Clin. Radiol., 2017;72(6):433-42.
CrossRef - Tracer H, and Pierre J. Screening for Lung Cancer. Am. Fam. Physician. , 2021;104(1):79-80.
- Giaquinto AN, Miller KD, Tossas KY, Winn RA, Jemal A, and Siegel RL. Cancer statistics for African American/Black People 2022. CA Cancer J. Clin., 2022;72(3):202-29.
CrossRef - Barta JA, Powell CA, and Wisnivesky JP. Global epidemiology of lung cancer. Ann. Glob. Health., 2019;85(1).
CrossRef - Dabade S, Chaudhari S, Jadhav S, and Nichal A, editors. A review paper on computer aided system for lung cancer detection. 2017 International Conference on Big Data, IoT and Data Science (BID); 2017: IEEE.
CrossRef - Knudsen KE, Wiatrek DE, Greenwald J, McComb K, and Sharpe K. The American Cancer Society and patient navigation: Past and future perspectives. Cancer. , 2022;128:2673-7.
CrossRef - Bodhey H, and Sable GS. Review on: Adaptive Segmentation of the Pulmonary Lobes and Tumor Identification from Chest CT Scan Images. Int .j. .adv .res .comput .commun .eng., 2013;2(10):4068-71.
- Ejaz N, Javed S, and Sajid Z. Implementation of Computer Aided Diagnosis System for Lung Cancer Detection. Lecture Notes on Software Engineering. , 2013;1(4):364.
CrossRef - Deshpande AS, Lokhande DD, Mundhe RP, and Ghatole JM. Lung cancer detection with fusion of CT and MRI images using image processing. Int. j. adv. res. comput. sci. eng. inf. technol., 2015;4(3).
- Shamala BT, and Kulhalli K. CAD system for lung cancer detection using ANN. J. Electron. Commun. eng. , 2012:11-5.
- Homma N. CT Image based computer-aided lung cancer diagnosis. Theory and applications of CT imaging and analysis. , 2011:3-14.
CrossRef

