
Manuscript accepted on :20-06-2022
Published online on: 15-07-2022
Plagiarism Check: Yes
Reviewed by: Dr. Karol Wróblewski
Second Review by: Dr. Bhavana Gundavarapu
Final Approval by: Dr. Ayush Dogra
Abhijit S. Salokhe1,2 , Shubham Malkar1, Shubham Mangule1, M. S. Palled1, Shailendra S. Suryawanshi1*and Panchaxari M. Dandagi2
1Department of Pharmaceutical Chemistry, KLE College of Pharmacy, Belagavi, KLE Academy of Higher Education and Research, Belagavi- 590010, Karnataka, India.
2Department of Pharmaceutics, KLE College of Pharmacy, Belagavi, KLE Academy of Higher Education and Research, Belagavi- 590010, Karnataka, India.
Corresponding Author E-mail: shailendrasuryawanshi@klepharm.edu
DOI : https://dx.doi.org/10.13005/bpj/2470
Abstract
The objectives of present research work was to develop simple, precise, accurate, specific, cost effective, validated UV-spectrophotometric method for quantification of Agomelatin (AGM) in bulk and pharmaceutical tablets dosage form by Area Under Curve (AUC) and Zero Order Spectroscopic (ZOS) methods. Both methods involve the use methanol: millipore water (50:50 %v/v) as solvent for estimation. The area between 212-237 nm was used to measure the AUC for first method and 229 nm was used to measure the absorbance for second method. The developed technique was optimized and standardized as per ICH guidelines in terms of specificity, selectivity, linearity, ruggedness, solution stability, quantification and detection limits, precision, robustness, and accuracy. Both methods showed linearity between the amount ranges from 0.5 – 2.5μg/mL. The % RSD for all the validation parameters was found to be less than 2%. Both methods were found to accurate with recovery values. The results obtained by proposed method showed that method is linear, specific, selective, rugged, precise, stable, robust, and accurate and can be employed for the quality control of AGM in bulk and tablet formulation.
Keywords
Agomelatine; Area under curve; ICH guidelines; Validation; Zero Order Spectroscopy
Download this article as:| Copy the following to cite this article: Salokhe A. S, Malkar S, Mangule S, Palled M. S, Suryawanshi S. S, Dandagi P. M. Validated Area Under Curve and Zero Order Spectroscopic Methods for Estimation of Agomelatine in Bulk and Pharmaceutical Tablet Dosage Form. Biomed Pharmacol J 2022;15(3) |
| Copy the following to cite this URL: Salokhe A. S, Malkar S, Mangule S, Palled M. S, Suryawanshi S. S, Dandagi P. M. Validated Area Under Curve and Zero Order Spectroscopic Methods for Estimation of Agomelatine in Bulk and Pharmaceutical Tablet Dosage Form. Biomed Pharmacol J 2022;15(3). Available from: https://bit.ly/3uPwORL |
Introduction
AGM, chemically “N-[2-(7-methoxy napthalen-1-yl) ethyl] acetamide” (Figure 1) and used as antidepressant agent which was approved in 2009 for treatment of depressive disorders by the European Medicines Agency. The molecular formula of AGM is C15H17NO2 and molecular weight is 243.301gm/mol. AGO is a sleep modulating antidepressant and is a novel antidepressant, acts as melatonergic receptor agonist and serotonergic receptor antagonist. AGM also used as anxiolytic agent and used in the treatment of anxiety 1,2. The binding studies suggest that it has no effect on monoamine uptake and no affinity for histaminergic, dopaminergic, cholinergic, α, β adrenergic, and benzodiazepine receptors 3,4. It showed significant advantages over paroxetine due to the complete absence of side effects including the associated sexual effect that are troublesome with some antidepressant. Due to its action on the melatonine receptors, it gives a marked improvement on sleep. AGM has anxiolytic activity and hence it is very useful in the management of anxiety and related disorders 5,6.
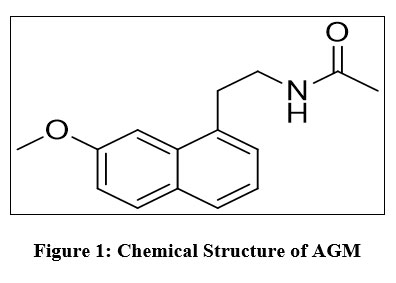 |
Figure 1: Chemical Structure of AGM. |
Quality control of AGM is very much essential in the pharmaceutical industries as it is consumed by large number of population in the form of tablet dosage forms. In order to analyse the drug and formulations various methods have been reported by researchers 7-10 The scientific studies and literature reports few analytical methods used to estimate AGM in different forms. Few of these analytical methods were highlighted and reviewed. The AGM is estimated using chromatographic method and also impurities in its bulk and formulations were reported by few analytical methods 11-13. The analytical method are reported for analysis of AGM include quantification by RP-HPLC 14 and the chromatographic methods also were reported for separating and analyzing AGM and its intermediates and final formulations 15. The validated LC-MS/MS technique for quantification of AGM in human plasma and its application in a pharmacokinetic study also was reported 16.
Few of the other reports found in the literature for AGM determination discussed mainly on chromatographic techniques. The reported techniques used for quantification of AGM in bulk form and pharmaceutical formulations by HPLC with UV detection17. It has been also quantified along with some other antidepressants and also along with vitamin B12 in formulations and biological samples 18. As we discussed earlier mass chromatographic assays were reported for determination of AGO and other antidepressants in biological samples 19,20. The UHPLC-DAD-MS/MS was also used to analyze the photostability of AGM 21. The capillary liquid chromatography-mass spectrometry was also used for determination of AGM in blood plasma 22. The stability indicating chromatographic assays also were reported for quantification of AGM and its degradation products 23,24. Literature survey also revealed very important techniques such as ultra-high performance super critical fluid chromatography and ultra-high performance liquid chromatography (UHPLC) were utilized successfully for quantification of AGM and its impurities 25. Apart from these methods assessment of AGM stability under various stress conditions using HPLC with fluorescence detection was reported 26. The Gas chromatography–mass spectrometry quantification was used for assay of AGM and other antipsychotic drugs in biological fluids 27. The UV Spectrophotometric estimation was carried out for determination of AGM at 299 nm in bulk and pharmaceutical formulations 28 and also the spectrofluorimetric analysis was reported for AGO quantification in marketed tablets 29. AGM was also estimated by using assays based on the formation of a charge transfer complex methods and its estimation using spectroscopic methods 30.
Very few methods involve the use of UV spectroscopic principles and reported methods used of costly solvents in analysis. The literature review also revealed that AGM was analysed by measuring the absorbance no methods were reported based on measurement using area under curve spectroscopic method. Hence there is need for estimating the AGM by economic as well as by measuring the AUC method. In the present research we have made the attempt to develop, optimize and validate the AUC and ZOS methods using cost effective solvent system.
Methods and Materials
Instruments, reagents and chemicals
Electronic analytical balance was used to weigh the drug; UV-Spectrophotometer was used to measure the AUC and absorbance, Ultrasonic bath Sonicator was used to sonicate and enhance the solubility of Agomelatine. Agomelatine was obtained as a gift sample from SYMED LABS LIMITED Hyderabad. The reagent solutions and chemicals used were of AR grade and collected from the store of KLE College of Pharmacy, Belgaum.
Optimization of Methods
Preparation of stock solution
AGM standard stock solution containing 500μg/ml was prepared in 10ml volumetric flask (VF) by dissolving 5mg and then diluted to volume with methanol: water (50:50%v/v) as solvent system (SS). From this stock further 1ml was taken in 10mL VF and volume was made up to mark using SS. From this stock serial dilution were made to prepare 0.5 μg/ml to 2.5 μg/ml.
Selection of solvent and wavelength of analysis
The solubility analysis and literature survey revealed that the AGM was soluble in methanol. Many trials were performed in different proportions of water and methanol. Finally SS composed of methanol: water (50:50%v/v) was chosen for UV analysis of AGM. In order to identify the wavelength for analysis, solution containing 0.5 μg/ml was analysed in the UV region of 200 – 400nm and spectrum was obtained and wavelength for maximum absorbance was identified which was found to be 229nm.
Measurement of area under curve for AUC and absorbance for ZOS methods
For area under curve method the two wavelengths 212-237nm were selected and AUC between these two was used for measurement 31,32. For ZOS method absorbance of solutions at 229 nm was measured.
Validation
The developed techniques were standardised as per ICH guidelines in terms of selectivity, precision, linearity, robustness, specificity, LOD, LOQ, ruggedness, solution stability, and accuracy 33,34.
Selectivity and Specificity
It was performed to exclude the chances of interference of solvent in the region of maximum absorbance of AGM. The specificity and selectivity was evaluated by running the solvent and comparing the spectrum of AGM 35.
Standard calibration curve
The series of dilutions were made from the standard stock solution of AGM to obtain the amount of 0.5μg/ml – 2.5μg/ml. For AUC method the two wavelengths 212-237nm was selected for determination. The calibration plot was constructed as AUC vs concentration. For ZOS method Absorbance of the above solution was measured at 229nm and calibration curve of concentration vs absorbance was prepared and the r2 was calculated 36.
Detection and Quantification Limits
The Detection and Quantification Limits of AGM by proposed method were estimated using calibration standard. Detection limit of AGM by AUC and ZOC method was found to 0.1457 μg/ml and 0.4799 μg/ml respectively. Quantification Limits of AGM by AUC and ZOC method was found to be0.0973 μg/mland0.2951 μg/ml respectively 37.
Precision
Precision was studied to evaluate the preciseness of methods. The system precision was evaluated by measuring AUC and Absorbance’s of Agomelatine solution at three different concentrations. Same way intraday and interday precision was evaluated by performing analysis on same day at two different intervals and on three different days. After each analysis percentage “relative standard deviation” (% RSD) was calculated.
Ruggedness
The ruggedness presents the variation within the laboratory conditions (different analyst and different instrument). It was done by repeating the same analysis by different analyst on one more instrument. After analysis percentage relative standard deviation (% RSD) was calculated.
Robustness
Robustness was evaluated by measuring the absorbance’s at different wavelengths and calculating the %RSD for ZOS.
Solution Stability
The solution was preserved at ambient room temperature and analysed at different day intervals .The responses for the older solutions were compared against freshly prepared standard solution.
Accuracy
The accuracy of techniques was estimated by recovery experiments at 3 different levels. The samples were spiked with 50%, 100% and 150% of mixed standard solution the mixture were analysed and recoveries were estimated.
Assay
Twenty marketed tablets of AGM were weighed and average weight was calculated. Tablets are made into powder form and then powder equivalent to 10 mg of AGM was weighed and transferred to 10 mL VF. Agomelatine was extracted from powder using SS and sonicated for 15 minutes. After extraction serial dilutions were made in beers range and absorbance was measured and used for calculating assay.
Results
Development
Solvent development step involves the use of methanol: water (50:50) in which AGM showed spectrum with maximum absorbance at 229nm. Specifications of developed techniques were presented in Table 1.
Table 1: Specifications of ZOS and AUC Spectroscopic Method.
| Sr. No. | Parameters | Specification |
| 1 | Method | Spectrophotometric |
| 2 | Instrument | UV-Spectrophotometer |
| 3 | Model | Shimadzu |
| 4 | Make | UV-1800 |
| 5 | Software | UV-Probe |
| 6 | Analyte | Agomelatine |
| 7 | Solvent | Methanol :Water (50:50) |
| 8 | Lambda Max. | 229nm |
Validation
Specificity Selectivity
Solvent spectrum obtained showed no interference of absorbance 229nm which show the specificity and selectivity of method. The spectrum of solvent and AGM were presenetd in Figure 2 and Figure 3.
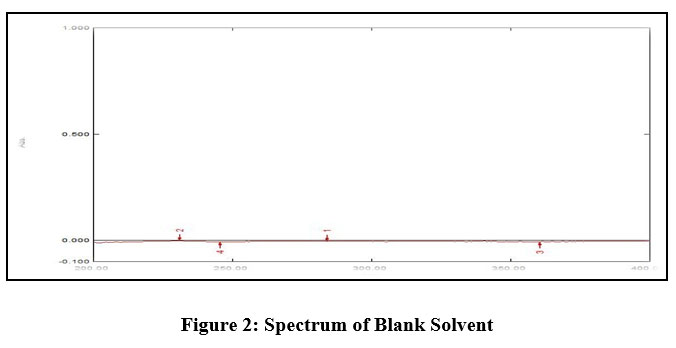 |
Figure 2: Spectrum of Blank Solvent. |
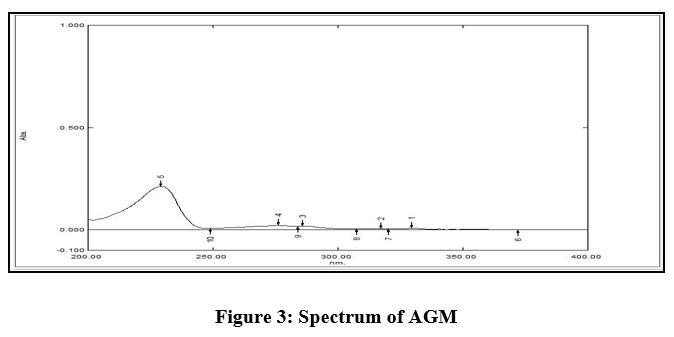 |
Figure 3: Spectrum of AGM |
Linearity and Range
Standard calibration curve was plotted using absorbance vs concentration obtained by linear dilution of AGM. Each concentration show linear absorbance range between the amounts of 0.5,1.0,1.5,2.0,2.5μg/ml with regression equation of 0.9998 for AGM. The linearity data was presented in Table 2. Standard calibration curve was presented in Figure 4 and Figure 5.Overlay spectrum was showed in Figure 6 and AUC graphs was presented in Figure 7.
 |
Figure 4: Standard calibration curve for AUC method. |
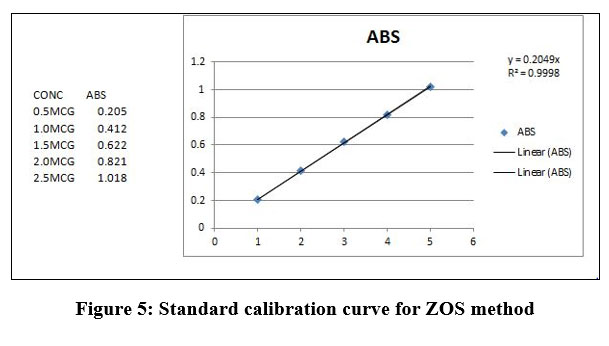 |
Figure 5: Standard calibration curve for ZOS method. |
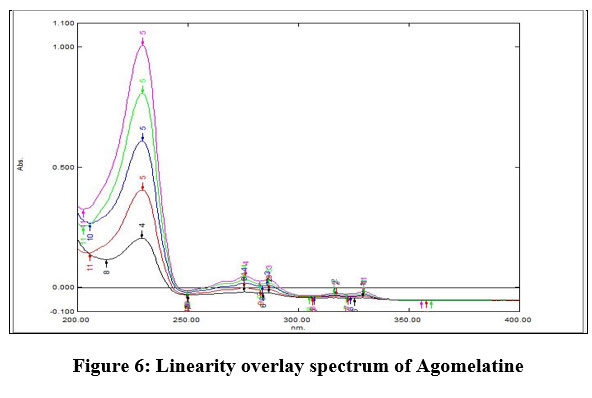 |
Figure 6: Linearity overlay spectrum of Agomelatine. |
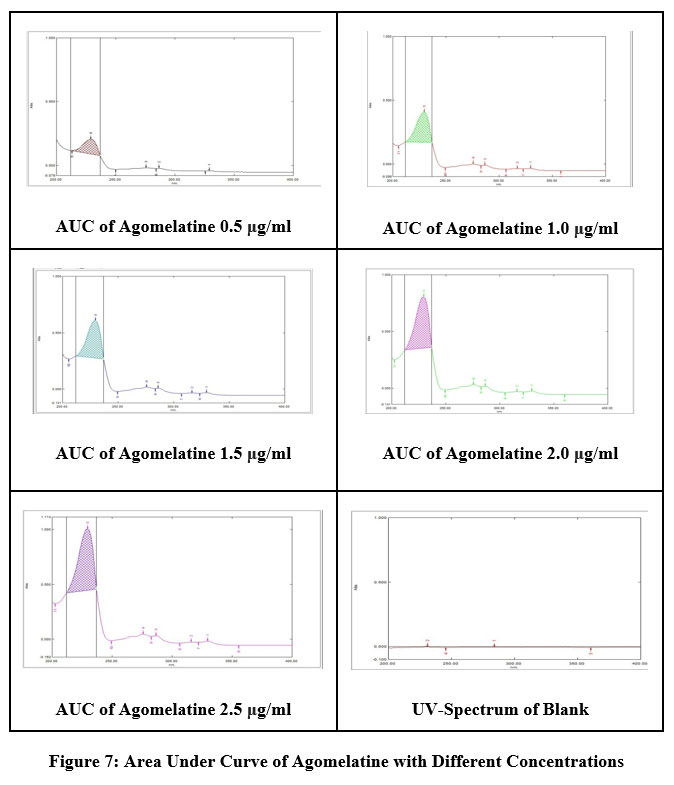 |
Figure 7: Area Under Curve of Agomelatine with Different Concentrations. |
Table 2: Linearity and range data of Agomelatine.
| Sl. No. | Concentration (μg/ml) | Area Under Curve(212 237) | Absorbance at 229nm |
| 1 | 0.5 | 1.482 | 0.205 |
| 2 | 1.0 | 3.139 | 0.412 |
| 3 | 1.5 | 4.444 | 0.622 |
| 4 | 2.0 | 6.127 | 0.821 |
| 5 | 2.5 | 7.584 | 1.018 |
| r2 | 0.999 | 0.9998 | |
| % Curve Fitting | 99.9% | 99.98% | |
| LOD | 0.1457 μg/ml | 0.0973μg/ml | |
| LOQ | 0.4799 μg/ml | 0.2951μg/ml | |
Precision
Method was found to be precise as the % RSD calculated for six replicates solution of AGM at each precision level was found to be less than 2%. Data of precision presented in Table 3.
Table 3: Precision Data of Agomelatine.
| Precision | %RSD of AUC method | %RSD of ZOS method | ||||
| Concentration | 0.5μg/ml | 1.5μg/ml | 2.5μg/ml | 0.5μg/ml | 1.5μg/ml | 2.5μg/ml |
| System precision | 0.651 | 0.444 | 0.293 | 0.48 | 0.09 | 0.15 |
| Method Precision | 0.825 | 0.231 | 0.086 | 0.744 | 0416 | 0.100 |
| Inter day 1 | 1.940 | 1.643 | 0.504 | 0.740 | 0.415 | 0.317 |
| Interday 2 | 0.806 | 0.690 | 0.634 | 0.739 | 0.593 | 0.199 |
| Interday 3 | 0.917 | 0.359 | 0.692 | 0.736 | 0.342 | 0.250 |
| Intraday-1 | 0.449 | 0.211 | 0.237 | 1.558 | 0.436 | 0.199 |
| Intraday-2 | 0.953 | 0.041 | 0.304 | 1.214 | 0.592 | 0.263 |
Robustness
% RSD values calculated for AGM was found to be less than 2% which indicates method was robust with slight change in nm and also found to be rugged. The data of Robustness presented in Table 4.
Table 4: Robustness Data of Agomelatine.
| Robustness | %RSD of ZOS Method | ||
| Conc (μg/ml) | 0.5 | 1.5 | 2.5 |
| 227nm | 1.012 | 0.167 | 0.270 |
| 228nm | 0.998 | 0.094 | 0.251 |
| 229nm | 0.952 | 0.162 | 0.248 |
| 230nm | 0.732 | 0.093 | 0.261 |
| 231nm | 0.746 | 0.095 | 0.209 |
Ruggedness
The % RSD obtained for absorbance of each replicate of solution was within the acceptance by change in the analyst and instrument. Ruggedness data is presented in Table 5.
Table 5: Ruggedness data of Agomelatine.
| Ruggedness | % RSD of AUC Method | %RSD of ZOS method | ||||
| Concentration
μg/ml |
0.5 | 1.5 | 2.5 | 0.5 | 1.5 | 2.5 |
| Change analyst | 1.676 | 0.097 | 0.097 | 0.966 | 0.686 | 0.099 |
| Change instrument | 0.758 | 0.135 | 0.309 | 1.691 | 0.489 | 0.058 |
Solution and Standard Stock Solution Stability
The % RSD for absorbance obtained by fresh and old dilution containing Agomelatine was found to be within the acceptance and data obtained show the standard stock solution and solvent shows stability of 3 days. The data is presented in Table 6.
Table 6: Solution stability of Agomelatine.
| Solution stability | % RSD of AUC Method | %RSD of ZOS method | ||||
| Concentration (μg/ml) | 0.5 | 1.5 | 2.5 | 0.5 | 1.5 | 2.5 |
| Stability Day 1 | 1.368 | 0.041 | 0.259 | 1.214 | 0.592 | 0.263 |
|
Stability Day 2 |
0.421 | 0.108 | 0.165 | 0.744 | 0.416 | 0.100 |
Accuracy
Accuracy of Agomelatine was found to be well within the acceptance for both methods and data was presented in Table7.
Table 7: Accuracy of Agomelatine.
| Level | Standard added
(μg/ml) |
Sample added
(μg/ml) |
Total conc.
(μg/ml) |
% Recovery of
AUC |
% Recovery of ZOS |
| 50% | 0.5 | 0.25 | 0.75 | 98.37 -99.75% | 93.71 – 95% |
| 100% | 0.5 | 1.0 | 1.5 | 99.13 – 99.68% | 98.79-100.72% |
| 150% | 0.5 | 1.75 | 2.25 | 99.03 -99.32% | 98.44-99.14% |
Assay
The assay values of Agomelatine by AUC and ZOC methods were found to be 96.37-97.64 and 98.23-102.25 % respectively.
Discussion
The literatures reports that AGM was estimated by few chromatographic techniques and the reported techniques used for quantitative analysis of AGM in bulk form and pharmaceutical preparations with the help of HPLC. The UHPLC-DAD-MS/MS was also used to analyse the photo stability of AGM. The capillary liquid chromatography-mass spectrometry was also used for determination of AGM in blood plasma. The stability indicating chromatographic assays also were reported for quantification of AGM and its degradation products. Literature survey also revealed very important techniques such as ultra-high performance super critical fluid chromatography and ultra-high performance liquid chromatography (UHPLC) were utilized successfully for quantification of AGM and its impurities. Apart from these methods, the assessment of AGM stability under various stress conditions using HPLC with fluorescence detection was reported. The Gas chromatography–mass spectrometry quantification was used for assay of AGM and other antipsychotic drugs in biological fluids.
UV-Visible spectrophotometry is one of the commonly used analytical method in analysis pharmaceutical preparations. It involves measuring the amount of visible or ultraviolet light absorbed by analyte in suitable solution. The absorbance is quantitatively measured as it is based on amount of drug present in solution. Usually spectrum of analyte is taken and maximum wavelength of absorbance is measured for further quantitative estimation. The area under curve or spectrum also can be measured and used for the quantitative analysis of drugs, as it is very rarely used in most of reported literatures. The UV Spectrophotometric estimation was carried out for determination of AGM at 299 nm in bulk and pharmaceutical formulations. AGM was also estimated by using assays based on the formation of a charge transfer complex methods and its estimation using spectroscopic methods. The literature review also revealed that AGM was analysed by measuring the absorbance no methods were reported based on measurement using area under curve spectroscopic method. In the present research we have made the attempt to develop, optimize and validate the AUC and ZOS methods using cost effective solvent system.
The present research was aimed to develop simple, precise, accurate, specific, cost effective, validated UV-spectrophotometric method for quantification of Agomelatin (AGM) in bulk and pharmaceutical tablets dosage form by Area Under Curve (AUC) and Zero Order Spectroscopic (ZOS) methods. The area between 212-237 nm was used to measure the AUC for first method and 229 nm was used to measure the absorbance for second method. Both methods involve the use methanol: millipore water (50:50 %v/v) as solvent for estimation. The developed technique was optimized and standardized as per ICH guidelines in terms of specificity, selectivity, linearity, ruggedness, solution stability, quantification and detection limits, precision, robustness, and accuracy. Both methods showed linearity between the amount ranges from 0.5 – 2.5μg/mL. The % RSD for all the validation parameters was found to be less than 2%. Both methods were found to accurate with recovery values. The assay values of Agomelatine by AUC and ZOC methods were found to be 96.37-97.64 and 98.23-102.25 % respectively.
Conclusion
Quality control of AGM is very much essential in the pharmaceutical industries as it is consumed by large number of population in the form of tablet dosage forms. In order to analyse the drug and formulations various methods have been reported by researchers. The reported methods involve the use of UV spectroscopic methods and also the use of costly solvents such as methanol. Hence new UV-spectroscopic methods have been developed, optimized and validated in present research work. The proposed Area Under Curve and Zero Order Spectroscopic methods was found to be simple, precise, accurate and stable for the quantification of Agomelatine in bulk and its marketed tablet dosage forms. The reported method can be hence used for the quality control analysis of Agomelatine.
Acknowledgement
The Authors are thankful to Dr. Sunil S. Jalalpure, Principal KLE College of Pharmacy, Belagavi, for providing all the necessary facility to carry out research work. Authors are also thankful to Mr. Onkar Supe, Miss. Sushmita Hiremath and Miss. Snehal Tavade for helping during research activities.
Conflict of Interest
There is no conflict of interest.
Funding Sources
There is no funding Source.
References
- Rupareliya RH, Joshi HS. Development and validation of UV spectrophotometric method for estimation of Agomelatine in bulk and pharmaceutical dosage form. International Letters of chemistry, physics and astronomy. 2015;56:113-119.
CrossRef - Singh SP, Singh, V, Kar N. Efficacy of agomelatine in major depressive disorder metaanalysis and appraisal. International Journal of Neuropsychopharmacology, 2012; 15: 417-428.
CrossRef - Girish, MB, Bhuvana K, Nagesh RG, Sarala, N. A novel atypical antidepressant drug: Agomelatine – A review. International Journal of Pharmaceutical and Biomedical Research, 2010; 1(3): 113-116.
- Girstaute D, Paul L, Tim J, Cecilia G, Elisabeth M, Johan D. Chronic Stress and Antidepressant Agomelatine Induce Region-Specific Changes in Synapsin I Expression in the Rat Brain. Journal of Neuroscience Research, 2011; 89: 1646-1657.
CrossRef - Patil SR, Nerukar KK, Kalamkar AM, Pukale V, Mangaonkar KV, Pingale SG. Validated LC-MS/MS method for quantification of agomelatine in human plasma and its application in a pharmaceutical study. Journal of Mass Spectrometry, 2012; 47: 23-28.
CrossRef - Rao VP, Prabhakar T, Naveen RC, Ramakrishna S, Trinath G. Clinical and pharmacological review on novel melatonergic antidepressant: Agomelatine. Research Journal of Pharmaceutical, Biological and Chemical Sciences, 2010; 1(2): 446-450.
CrossRef - Ratnam VN, Sankar DG, Sindhu P, Teja T. Development and validation of UV spectrophotometric method for estimation of Agomelatine in bulk and pharmaceutical dosage form. Der Pharmacia Lettre. 2016; 8 (20): 41-46.
- Powalkar T, Mastiholimath VS, Mannur VS, Rajput P. Validated UV-Spectrophotometric method for Estimation of Agomelatine in Bulk powder. International Journal of Pharma Research and Health Science.2019; 7(6): 3090-3094.
CrossRef - Barbosa F, Rodrigues VC, Volpato NM, Schapoval E, Steppe M, Garcia C. UV-Spectrophotometric method for quantitative determination of Agomelatine in coated tablet .Drug Analytical Research. 2017; 01(2): 24-29.
CrossRef - Rashed NS, FouadM, Attia AK, Wasfy A .Validated stability- indicating spectroscopic methods for determina tion of Agomelatine. J Global Trends Pharm Sci. 2016; 7(2): 3117-3124.
- Sagar PV, Shivani P, Sushma E, Rani SS. Stability indicating RP-HPLC method for estimation of agomelatine in tablete dosage form. Int J Pharm Biol Sci. 2015; 5: 74 – 81.
- Liu Y, Chen L, Ji Y. Quantification and structural elucidation of potential impurities in agomelatine active pharmaceutical ingredient. J Pharm Biomed Anal. 2013; 81: 193 – 201.
CrossRef - Sagar PV, Shivani P, Sushma E, Rani SS. Stability indicating RP-HPLC method for estimation of agomelatine in tablete dosage form. Int J Pharm Biol Sci. 2015; 5: 74 – 81.
- Xue-jun H, Ren Z, Wang J, Liu J, Du Y, Quio H. Determenation of Agomelatine by RPHPLC. Huaxi Yaoxue Zazhi, 2010; 25(2): 204-205.
- Ning M. HPLC method for separating and analyzing agomelatine intermediate and final product thereof. Faming Zhuanli Shenquing Gongkai Shuomingshu, 2008; CN 101206200 A 20080625.
- Rao VP, Prabhakar T, Naveen RC, Ramakrishna S, Trinath G. Clinical and pharmacological review on novel melatonergic antidepressant: Agomelatine. Research Journal of Pharmaceutical, Biological and Chemical Sciences, 2010; 1(2): 446-450.
CrossRef - Harika B, Srikalyani V, Buchi NN, Lakshmi V. Development and validation of RPHPLC method for the estimation of Agomelatine in bulk drug and pharmaceutical dosage forms, Journal of Chemical and Pharmaceutical Research. 5 (2013) 1162-1167.
- Mohamed GG, Fekry AM, Abou Attia FM, Ibrahim NS, Azab SM. Simultaneous determination of some antidepressant drugs and vitamin B12 in pharmaceutical products and urine sample using HPLC method, Journal of Chromatography B. (2020) 122178.
CrossRef - Sistik P, Urinovska R, Brozmanova H, Kacirova I, Silhan P, Lemr K. Fast simultaneous LC/MS/MS determination of 10 active compounds in human serum for therapeutic drug monitoring in psychiatric medication, Biomedical Chromatography. 30 (2016) 217-224.
CrossRef - ElKady EF, Farouk F. Optimized bio-analytical methods development and comparative pharmacokinetic studies of four antidepressants in Egyptian population based on gender difference, Journal of Chromatography B. 1102 (2018) 135-142.
CrossRef - Trawiński J, Skibiński R. Photostability study of agomelatine using UHPLC-DAD-MS/MS method. Kinetics, identification of the transformation products and in silico evaluation of toxicity, Journal of Liquid Chromatography & Related Technologies. 42 (2019) 63-73.
CrossRef - Murtada K, Andrés F, Ríos A, Zougagh M. A simple poly (styrene-co-divinylbenzene)- coated glass blood spot method for monitoring of seven antidepressants using capillary liquid chromatography-mass spectrometry. Talanta. 188 (2018) 772-778.
CrossRef - Abdelrahman MM, Naguib IA, El Ghobashy MR, Ali NA. Stability-Indicating HPLC and HPTLC Methods for Determination of Agomelatine and its Degradation Products, Journal of chromatographic science. 56 (2018) 317-326.
CrossRef - Annapurna MM, Venkatesh B, Narendra A. Forced Degradation Studies of Agomelatine: Development and Validation of Stability Indicating RP-HPLC Method using Internal Standard, Research Journal of Pharmacy and Technology. 10 (2017) 703-707.
CrossRef - Plachká K, Chrenková L, Douša , Nováková L. Development, validation and comparison of UHPSFC and UHPLC methods for the determination of agomelatine and its impurities, Journal of pharmaceutical and biomedical analysis. 125 (2016) 376-384.
CrossRef - El‐Shaheny R. Evaluation of agomelatine stability under different stress conditions using an HPLC method with fluorescence detection: application to the analysis of tablets and human plasma, Luminescence. 29 (2014) 920-928.
CrossRef - Chen X, Zheng S, Le J, Qian Z, Zhang R, Hong Z, Chai Y. Ultrasound-assisted low-density solvent dispersive liquid–liquid microextraction for the simultaneous determination of 12 new antidepressants and 2 antipsychotics in whole blood by gas chromatography–mass spectrometry, Journal of pharmaceutical and biomedical analysis. 142 (2017) 19-27.
CrossRef - atnam NV, Sankar DG, Sindhu P, Teja T. Development and Validation of UV Spectrophotometric Method for Estimation of Agomelatine in Bulk and Pharmaceutical Dosage Form, Der Pharmacia Letter 8(2016) 41- 46.
- Ibrahim F, El‐Deen A, Shimizu K. Application of quinone‐based fluorophore and native fluorescence for the spectrofluorimetric determination of agomelatine in dosage form: Identification of acidic and alkaline‐induced degradation products by LC–MS/TOF, Luminescence. 33 (2018) 225-231.
CrossRef - Ansari S, Ansari MS, Devnani H, Satsangee S, Jain R. CeO 2/gC 3 N 4 Nanocomposite: A Perspective for Electrochemical Sensing of Anti-Depressant Drug, Sensors and Actuators B: Chemical. 273 (2018) 1226-1236.
CrossRef - Jain S P, Bhadane V P, Chaudhari H P, Surana S J. Area under curve method development and validation of Midodrine Hydrochloride . International journal of pharmaceutical chemistry and analysis. 2015; 2(4): 154-160.
- Sayed M, Bapat G, Inamdar N. Development and validation of UV- spectrophotometric method and validation for estimation of tramadol hydrochloride in bulk and tablet dosage form by absorbance maxima and Area Under Curve Method. Journal of Applied 2014; 6(2): 210-216.
CrossRef - Karajgi S, Kulkarni R, Metri S, Wadekar A. Area Under Curve UV Spectrophotometric method for the determination of CefpodoximeProxetil in single component tablets. Indian Journal of Medical Research and Pharmaceutical Science. 2016; 3(9): 28-35
- Gahandule M B, Dhobale S M. Development and validation of UV- spectrophotometry area under curve method for estimation of Cefixime trihydrate in pure and tablet dosage form. 2017; 2(2): 04-07.
- Mali AD, Jadhav S, Mane P, Tamboli A. Development and validation of UV- spectrophotometric Estimation of diclofenac sodium bulk and tablet dosage form using area under curve method. Magazine Pharmatutor.org. 2015; 3(4):21-25.
- Pawar S, Tamboli A. Development and validation of UV- spectrophotometric Estimation of hydrochlorothiazide in bulk and tablet dosage form using area under curve method. J.Bio.innov. 2017;6(6):945-951.
- Suryawanshi SS, Zaranappa, Chaluvaraju K. C, Sarvesh, Nagesh K P. Validated UV-Spectrophotometric method for simultaneous analysis of Aceclofenac and Pantoprazole in bulk and pharmaceutical dosage form. Journal of Pharmacy and Chemistry. 2015; 9(4): 13-19.

