
Manuscript accepted on :08-07-2022
Published online on: 04-08-2022
Plagiarism Check: Yes
Reviewed by: Dr. Flavio Palmieri
Second Review by: Dr. Narasimha Murthy
Final Approval by: Dr. Ian James Martin
K. V. Archana1*  and R. Vanithamani2
1Department of Electronics and Communication Engineering, Avinashilingam Institute for Home Science and Higher Education for Women, Coimbatore, India.
2Department of Biomedical Instrumentation Engineering, Avinashilingam Institute for Home Science and Higher Education for Women, Coimbatore, India.
Corresponding Author E-mail: archana_ece@avinuty.ac.in
DOI : https://dx.doi.org/10.13005/bpj/2492
Abstract
Cardiovascular Diseases (CVDs) are the leading cause of deaths, and adverse CVDs are related to Coronary Artery Disease (CAD). CAD is caused due to the accumulation of fatty lesions called plaques on the vessels that nourish the heart with blood. The Intravascular Ultrasound (IVUS) imaging modality has captured considerable attention in the diagnosis of CVDs in recent years. Generally coronary artery consists of three distinct regions: Media, Intima and Luminal region. Intima-Media Thickness (IMT) is perceived as a significant indicator in the risk evaluation process, tracking the amount of atherosclerosis development. In this paper, IVUS image is preprocessed using Total Variance Regularization for speckle noise removal and the contrast is improved by Contrast Limited Adaptive Histogram Equalization (CLAHE) technique. Region of Interest (RoI) is extracted using segmentation techniques such as Multi-Level Set Based, Otsu’s segmentation, Active Contour and Watershed segmentation and their performances are compared. The performance metrics used are Jaccard Index (JAC), Dice Coefficient (DC), Cohen Kappa Coefficient (KAP), Variation of Information (VOI), Global Consistency Error (GCE), and Rand Index (RI). From the analysis, it is observed that the Multi-Level Set based technique has a high JAC, DICE, KAP and RI. These values indicate the similarity between the segmented and ground truth image. Also the value of GI, indicates the less error measurement between segmented image and ground truth image. The significance of using Multi- level set based technique is that it uses the B-spline function-based curvature updation. This function is less dependent on the degree, smoothness and domain partition of the image, resulting in increased segmenting accuracy.
Keywords
Cardiovascular Disease; Common Carotid Artery; Dice coefficient; Intima-Media Thickness; Intra-Vascular Ultra Sound Imaging; Jaccard Index
Download this article as:| Copy the following to cite this article: Archana K. V, Vanithamani R. Segmentation of Intima – Media Thickness in Intravascular Ultrasound Images for Detection of Atherosclerosis. Biomed Pharmacol J 2022;15(3). |
| Copy the following to cite this URL: Archana K. V, Vanithamani R. Segmentation of Intima – Media Thickness in Intravascular Ultrasound Images for Detection of Atherosclerosis. Biomed Pharmacol J 2022;15(3). Available from: https://bit.ly/3d7QoTe |
Introduction
Atherosclerosis arises due to accumulation of fats or plaque in the walls of the arteries. The oxygenated blood from the heart is supplied to the brain and neck by the Common Carotid Artery (CCA). This study is mainly focused on CCA as it supplies blood to the brain, blockage of which may lead to strokes and premature heart attacks. The external artery is separated from the internal artery by bifurcation, highly susceptible to atherosclerosis 19. The identification of CVD’s is done by analyzing the structural variations in the thickness of the artery.
Adipose tissues are anatomically distributed along the different parts of the human body. Their distribution depends upon the various factors such as sex, age, diet, hormonal levels and medication of the individuals. Body fat tissue is traditionally distributed into two main compartments with different metabolic characteristics: Subcutaneous Adipose Tissue (SAT) and Visceral Adipose Tissue (VAT). While both of these tissue types are important, particular attention has been directed to visceral adiposity owing to its association with various medical pathologies.
The visceral fats are highly inflamed in obese patients. Also, a patient with metabolic syndrome gets highly affected. Additionally, they are capable of secreting large quantities of pro-inflammatory cytokines and free fatty acids. There is a direct involvement of these regional adipose tissue deposits in the development of atherosclerosis and related events need to be reviewed extensively 1. Fig.1 shows the schematic representation of carotid artery. The innermost layer is the lumen, middle layer is the atherosclerotic plaque together with media, and the outer layer is adventitia. These layers are separated by luminal border, and media-adventitia border. Intima-Media thickness (IMT) is considered as the evaluation strategy, it is the measure of distance between the lumen to the boundary of adventitia. In ultrasound imaging, the IMT value is taken. The normal range of value is of at least 5 mm. The measurement of intima media thickness is difficult, as it is very thin 19. The epidemiology studies revealed that the thickening of the major arteries was considered as marker for the onset of cardiovascular disease 20.
Intra Vascular Ultrasound Imaging (IVUS)
The diagnosis and treatment of the disease require visualizing the blood vessel and the level of plaque deposition. IVUS imaging modality has captured considerable attention in the diagnosis of CVD’s. The ultrasound imaging is considered as the best method for imaging, as it is non-invasive, safe, and widely used for evaluating CVD’s [19]. IVUS is a catheter-based imaging technique that provide the cross-sectional view of the blood vessels in real time and reveal more information about the plaque deposition. Very high frequency sound waves called ultrasound are emitted by the transducer. These ultrasounds wave bounces off the various tissue structures of the heart vessel and the backscattered waves are converted into images.
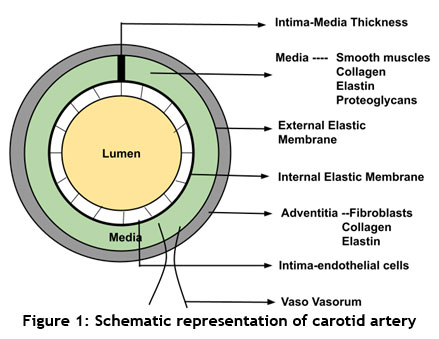 |
Figure 1: Schematic representation of carotid artery. |
The information regarding the degree of vessel obstruction and the amount of plaque deposited is obtained through the segmentation of Intima- Media region of the IVUS image. This information is important to determine how to treat the disease. In general, manual analysis using visual interpretation of IVUS images is difficult because each components of plaque shows complicated patterns. Also if the deposition is not recognized properly, it will lead to misdiagnosis of the disease. Hence, an automatic segmentation technique needs to be developed for identification of the level of plaques for proper treatment. There are several factors which reduce the accuracy of segmentation and ultimately cause difficulty in interpretation of the disease level.
The remaining sections of this work are structured as follows: Section II examines some of the existing work related to research area. Section III provides a comprehensive explanation of the segmentation techniques used in the analysis. Section IV presents the performance results of the segmentation methods implemented. Finally, the paper ends with the conclusion and future work in Section V.
Related Work
The modern developments in the imaging of the coronary arteries were surveyed. This paper described the benefits of intravascular imaging used in the visualizing of percutaneous coronary. Atherosclerosis imaging used for the indication of the developing plaque deposition was highlighted. The composition of tissue images was also essential for analyzing the lesion occurrence. Also, the modern inventions which were used for the unstable atherosclerotic plaque imaging was discussed 3.
Four kinds of classification algorithms such as Support Vector Machine with Linear Kernel, Support Vector Machine with Radial Basis Function Kernel, Ada Boost and Random Forest to effectively integrate the features from the ultrasound images were used 4. They iteratively estimated and calculated the probability maps for pixel-wise classification. The plaque segmentation was identified from the generated probability maps.
In 5, the authors studied about the atherosclerotic disease in the peripheral arteries, which provides the better idea about the elusive multifaceted disease. A comparison of various imaging modalities available for visualizing the process of atherosclerosis, confirming and expanding “in vivo” mechanism was studied. There were many restrictions that hamper the translatability of the presently existing imaging modalities even in the level of peripheral arteries. The contribution of ultrasound to detect atherosclerosis through earlier and prior prediction of plaques was discussed in 6. Evaluation of the biomechanical consequences of atherosclerosis in the vessel walls was done. The molecular imaging technique was used to express the disease-relevant molecules present in the vessel walls. The main drawback with the molecular imaging is its inability to distinguish attached microbubbles from those of freely circulating.
A deep learning framework, which had the capability to discriminate the different plaque constituents such as lipid core, fibrous cap and calcified tissue area was analyzed 7. A convolutional neural network has been proposed which repeatedly extracted the information from the images essential for the various kind of plaque constituent’s identification. Fast edge detection method based on random forest classifier for the efficient measurement of Intima Media Thickness for analyzing the development of atherosclerosis in the artery wall was discussed 8.
Computer aided methods for diagnosing Myocardial Infraction, Carotid Atherosclerosis and Coronary Artery Diseases (CAD) using thoracic and Intravascular Ultrasound (IVUS) Images were investigated 9. For the CAD, the IVUS have been found used frequently than the thoracic US. A study using subjects without cardiac, cerebral or peripheral vascular symptoms and normal carotid ultrasound to determine the vascular risk factors was made 10. The research revealed the presence of plaques in subclavian arteries for detection of subclinical atherosclerosis.
The prevalence of Nano Obstructive Carotid Atherosclerosis (NOCA) in the adults with Cryptogenic Stroke (CS) was investigated 11. Plaque thickness, length and volume is estimated to identify the symptomatic NOCA. A comparison of the Magnetic Resonance Imaging (MRI) with B Mode Ultrasound technique in detecting carotid artery plaques was done and evaluated the extent of atherosclerosis 12. The estimated plaque height using ultrasound and MRI showed the similarity estimation when the height was greater than 2.5 mm. Small structured plaques were detected well in ultrasound then the MRI.
Investigation of the endothelium-targeted panel Microbubbles (MB) ultrasound contrast agents was done13. The behavior of a minor peptide ligands was used especially for analyzing the high-risk atherosclerotic plaque. These molecular targets have been presented on the surface of the plague deposited wall. This work concluded that the ultrasound contrast agents which were bearing tiny peptide ligands showed the possible plague deposition areas. This was aimed over the molecules of the endothelial cell adhesion for the inflammatory cells for imaging the innovative atherosclerotic disease. An innovative method of fusing the intravascular ultrasound and optical coherence tomography was proposed 14.
The information acquired by incorporation of the two kind of imaging techniques improved the quality of the images. The proposed technology gave additional data about the plague deposition to support better diagnosis. In15, the authors deliberated the PAI principles and the current PAI growths which was used to develop the imaging of the cardiovascular. This work also discussed the possible areas for the research. The lipid content of atherosclerotic plaques in the PAI was utilized for the purpose of the plaque rupture correlation and also the morphology. A review paper was presented on various segmentation methods for the identification of intima-media in IVUS images. The study included techniques like edge tracking and gradient based methods, active contours, Hough transform, statistical modelling, Nakagami modelling, dynamic programming, and the integration methods. Different evaluation metrics were also taken into consideration. The review was based on two approaches namely, Computer aided measurement of IMT, and user independent methods for carotid artery segmentation. Concluded that iterative techniques (snakes / Active contour) were slower when compared to computational methods (gradient-based) 20.
Methodology
The study of existing research work mainly focuses on the efficient way to segment the plaque deposited region for deciding the type of treatment to be given at the right time. The flow of the proposed work is depicted in Fig.2. In this method, the data set consists of 100 B mode IVUS images. The first step is pre-processing of IVUS Image for noise removal and image enhancement for sharpening the edges. Further, morphological operation is performed for Intima-Media region detection. Following the detection, segmentation of ROI is done using techniques such as Multi-Level set based technique, Otsu’s segmentation, Active Contour method and Watershed segmentation.
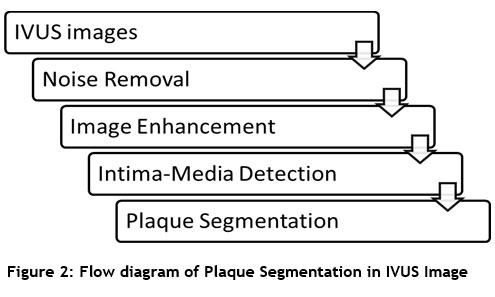 |
Figure 2: Flow diagram of Plaque Segmentation in IVUS Image . |
Pre-Processing
Pre-processing is an essential step in image processing. Input images is taken from the database and pre-processed to enhance its quality by removing the noise. The input IVUS image is shown in Fig.3. Total Variance Regularization is used to remove the speckle noise. This method is based on the principle that images with excessive and spurious details have high total variance. Thus, by reducing the total variance of the image, the unwanted details are removed with edge preservation. The mathematical equation of Total Variance Regularization is given as:
![]()
Where F is the data fidelity term, which depends on the noise model, λ is the regularization parameter. The multiplicative model is represented as:
![]()
A is the observation operator, u is the noise free data and is the noise. Assuming that u and are independent random variables with the probability density function fu and fz, then for

 |
Figure 3: Input IVUS Image. |
The filtered image is shown in Fig.4.
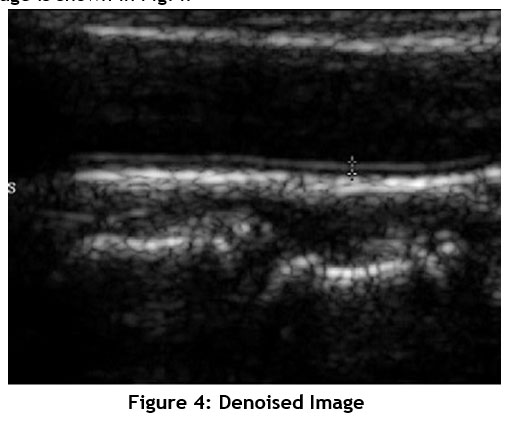 |
Figure 4: Denoised Image. |
Further, image enhancement technique is applied to sharpen the pixel intensity of the input image. In this method Contrast Limited Adaptive Histogram Equalization (CLAHE) is used to the increase the contrast. CLAHE belongs to special type of Adaptive Histogram Equalization (AHE) technique which operates on the small region of the image called tiles. The general AHE technique amplifies the contrast of the image in near- constant regions. This tends to cause the noise also to be amplified. CLAHE is a variant Adaptive Histogram Equalization method which limits the contrast by clipping the histogram at a predefined value before performing the Cumulative Distribution Function (CDF). The enhanced image is shown in Fig.5.
 |
Figure 5: Enhanced Image. |
Intima – Media Detection
The detection of Intima – Media (IM) layers in the IVUS image is of prime importance in identifying the quantity of plaque deposition. Though the IMT measurement does not directly helps in visualizing the coronary arteries, it assists in indicating the presence of coronary atherosclerosis. The variation in its thickness helps in predicting the deposition level of plaques. In this work Morphological Operation is performed in determining the IM borders. Morphology is a broad set of image processing operations implemented to process the images based on shapes. The borders of the Intima- Media region are identified using the morphological operation. The output image identifying the IM region is shown in Fig.6.
 |
Figure 6: Detection of Intima – Media region. |
Segmentation
Image segmentation is the process of partitioning a digital image into multiple segments. The goal of segmentation is to simplify and/or change the representation of an image into something that is more meaningful and easier to analyze. At first the Region of Interest (ROI) is extracted from the enhanced image. It is shown in Fig.7.
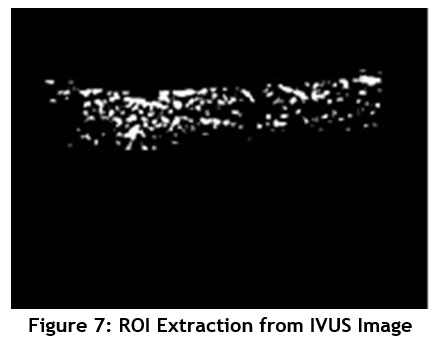 |
Figure 7: ROI Extraction from IVUS Image. |
Once the thick region is detected, the plaque quantity is estimated using an Intima-Media Thickness (IMT) measurement algorithm. Segmentation techniques such as Multi-Level set based technique, Otsu’s segmentation, Active Contour method and Watershed segmentation are implemented to identify the plaque deposition in the coronary artery.
Multi – Level Set Based Segmentation
The multi-level set algorithm descried below is implemented for extracting the plaque region [18]. To estimate the plaque, the ROI extracted image is taken as input image I with a mask region MK. The Multi-level set algorithm is detailed below.
Multi-Level Set Segmentation Algorithm
Input: Input image I, Mask region MK and Iteration R
Output: Segmented region S
Step 1: Initialize the φ, outer region Lout and inner region Lin
Step 2: Update the position for all elements which are presented in the φ ,
for i =1 to incrstep // incrstep – incremental speed steps
for p =1 : size(I)// each pixel I in Lout
If MK == 1
Switch the I(p) from Lout region to Lin region. Φ Lout Lin
B-spline function-based curvature Updation
Remove the Lout at I(p)
for i =1 to incrstep // incrstep – incremental speed steps
for p =1 : size(I) //each pixel I in Lout
If (φ (p) < 0)
Switch the I(p) from Lout region to Lin region.
B-spline function-based curvature Updation

Remove the Lout at I(p)
for i =1 to incrstep // incrstep – incremental speed steps
for p =1 : size(I) //each pixel I in Lout
If (φ (p) > 0)
Switch the I(p) from Lin region to Lout region.
B-spline function based curvature Updation
Remove the Lin at I(p).
Step 3: Final segmented result, S = I(p).
In this work B-spline function is implemented for updating random curve. When performing the numerical analysis, B-spline function is less dependent on the degree, smoothness and domain partition. Also, any spline function of the given degree can be expressed as a linear combination of B-splines of that degree. Since the heart vessels are curve shaped, the accuracy of the segmentation is increased by a high margin. The Fig.8 shows the segmented region by implementing Multi – Level Set based algorithm.
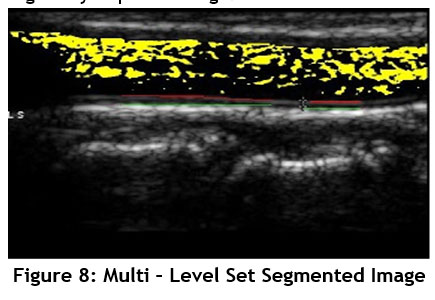 |
Figure 8: Multi – Level Set Segmented Image. |
Otsu Thresholding
The Otsu’s segmentation technique used in several image processing applications employs histogram-based image thresholding technique to segment the ROI. The algorithm assumes that the image consists of bimodal histogram (foreground and background pixel) and evaluates the optimum threshold value by partitioning the image into two classes. This partitioning technique reduces the inter class variance of the image. The optimum threshold value evaluated will minimizes the inter class variance of the image. The variance equation after thresholding is determined using weighted sum of variances of two classes. It is given as
![]()
where ω0 (t) and ω1 (t) are the probabilities of two classes separated by threshold t.
σ0 2 (t) and σ1 2 (t) are the variances of two classes [16]. The Otsu’s segmented output is shown in Fig.9.
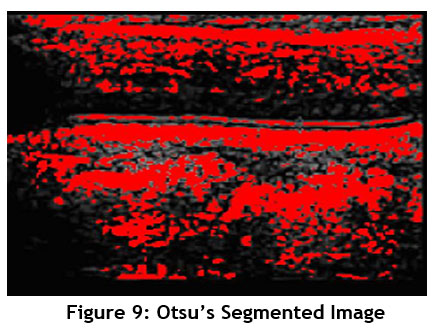 |
Figure 9: Otsu’s Segmented Image. |
Active Contour Based Segmention
It is used for delineating the object boundaries from a noisy 2D input image. This technique is also called as snakes’ model, widely used in applications such as object tracking, shape recognition, segmentation, edge detection and stereo matching. Snakes model generally matches the deformable curve to the image boundaries by means of energy minimization. The energy formulation of the snake model is given as the sum of its internal energy and external energy. The equation is given as

Einternal is the internal elastic energy which is used to control the deformation made to snake, and Eexternal is the external energy that controls the fitting of contour to the image. It is the combination of the forces due to the image Eimage and the constrain force exerted on the image Econ. The segmented plaque region using Active Contour technique is shown Fig.10.
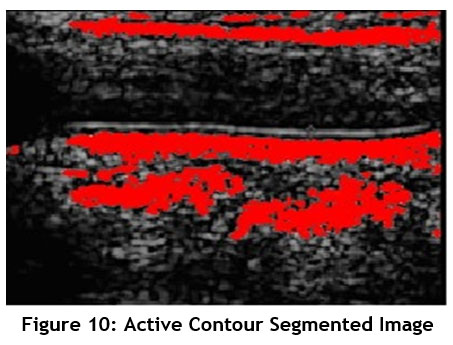 |
Figure 10: Active Contour Segmented Image. |
Watershed Segmentation
Geologically a watershed is a dividing technique that separates the adjacent basins. In watershed segmentation algorithm the image is considered as a topographic map, with the brightness of each point representing its height and identifies the lines that run along the tops of ridges. The aim of the watershed technique in image processing is to segment two regions that are close to each other specifically when their edges touch each other. There are two approaches used in implementing the watershed transformation:
The watershed marker is chosen from the local minima of the gradient of the image. In some applications this method produces over segmentation of image.
Marker positions are either explicitly defined by the user or determined automatically with morphological operators.
In this analysis the second approach of watershed technique is implemented to segment the IVUS image. The segmented image from watershed algorithm is shown in Fig.11.
 |
Figure 11: Watershed Segmented Image. |
Results and Discussion
The segmentation methods considered in this study are implemented in MATLAB environment using an Intel Core i3 processor @ 3.40 GHz. The performance metrics used for the analysis are Jaccard index, DICE, Kappa, Rand Index (RI), Variation of Information (VOI) and Global Consistency Error (GCE).
Calculation of Overlap based Metrics
DICE coefficient is commonly used metric in validating the image volume segmentation. DICE is a measure of reproducibility as a statistical validation of manual annotation. The pairwise overlap of the repeated segmented region is calculated using DICE 16.

Jaccard Index (JAC) between two sets is defined as the intersection between test segmented region to ground truth 16.
![]()
Global Consistency Error (GCE) is an error measurement between two segmentations [16]. Let R (S, x) be defined as set of all voxels residing in the segmented region. Then the error between two segments S1 and S2 at the voxel x is given as

Calculation of pair counting based metrics
Rand Index (RI) is the measure of similarity between clusters 16. It is one of the important properties that is not based on the labels and thus can be used to evaluate the clusters as well as the classifications.
Information theoretic based metrics: Variation of Information (VOI) measures the amount of information lost or gained when changing from one variable to other. It is defined using Entropy and Mutual Information between two segments. The VOI is given as
![]()
Probabilistic Metrics: Cohen Kappa Coefficient (KAP) measures the agreement between two samples 16. KAP is given as

The table 1, shows the comparison of performance metrics for the segmentation methods considered in this work.
Table 1: Comparison of Performance Metrics.
| Metrics | Multi -Level | Otsu’s | Active Contour | Watershed |
| JAC | 0.2474 | 0.1716 | 0.1208 | 0.3117 |
| DICE | 0.3966 | 0.2929 | 0.2156 | 0.2323 |
| KAP | 0.3608 | 0.1750 | -0.0271 | -0.0070 |
| RI | 0.8152 | 0.6767 | 0.7081 | 0.7400 |
| GCE | 0.0537 | 0.2270 | 0.1569 | 0.0680 |
| VOI | 0.6027 | 0.1478 | 0.1841 | 0.1740 |
The presence of plaque is identified by segmenting the RoI from the IVUS image for analyzing the level of deposition. From the performance metrics calculated JAC, DICE, RI and KAP gives the similarity level between the segmented image and the ground truth region. The values indicate that the Multi – level set based technique shows better results compared to other techniques such as Otsu’s, Active Contour and Watershed. Also, the Global Consistency Error value is less in Multi – level set based technique. The plot of the metrics is shown in the Fig.12. The main advantage of using Multi- level set based technique is that it uses the B-spline function-based curvature updation. This function is less dependent on the degree, smoothness and domain partition of the image. Since the heart vessels are highly curved in structure, Multi – level set based shows an increased segmentation accuracy compared to other methods.
The limitations of the work are that it considers a limited data set for analysis, also it is a semi-automatic segmentation technique which involves the initializing the parameters for appropriate segmenting. Future work can implement deep learning techniques for improving the segmentation for larger dataset.
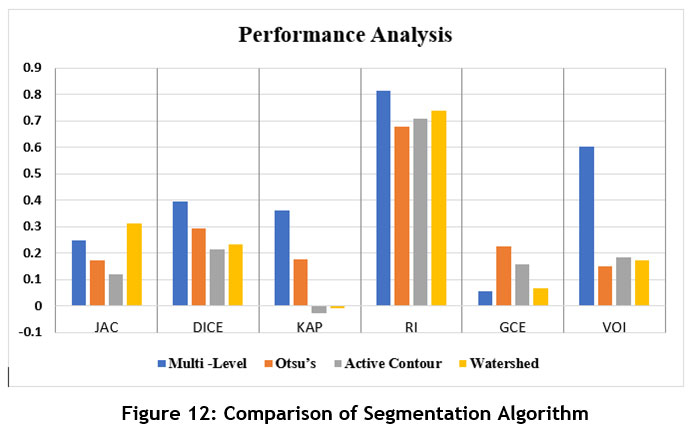 |
Figure 12: Comparison of Segmentation Algorithm. |
Conclusion
The paper focuses on detecting the plaque deposition in the coronary arteries for treating cardiovascular diseases. IVUS images of coronary artery is considered for the analysis of plaque. At first, pre-processing is performed for denoising and enhancing the overall contrast of the image. Then morphological operation is performed to detect the thickness of intima-media region. Further, segmentation is performed for ROI extraction and detection of plaque region using Multi – Level set algorithm. Other existing segmentation technique included in the analysis are Otsu’s, Active Contour and Watershed methods. Performance evaluation is done to identify the efficiency of the segmentation algorithms in this work. Performance metrics such as Jaccard index (JAC), DICE, Kappa, Rand Index (RI), Variation of Information (VOI) and Global Consistency Error (GCE) is calculated. Based on the experimental results, it can be concluded that Multi – Level Set Based Segmentation technique outperforms the other existing methods in a huge margin.
Conflict of Interest
All authors disclose no conflict of interest.
Funding Sources
There are no funding Source.
References
- Alexopoulos, D. Katritsis, and P. Raggi. Visceral Adipose Tissue as a Source of Inflammation and Promoter of Atherosclerosis. Atherosclerosis, 233: 104-112. (2014).
CrossRef - Yang, J. Zheng, A. Nofal, J. Deasy, and I. M. El Naqa. Techniques and Software Tool for 3D Multimodality Medical Image Segmentation. Journal of Radiation Oncology Informatics, 1:1-22. (2017)
- Van Soest, L. Marcu, B. E. Bouma, and E. Regar. Intravascular Imaging for Characterization of Coronary Atherosclerosis. Current Opinion in Biomedical Engineering, 3: 1-12. (2017)
CrossRef - Qian and X. Yang. An integrated Method for Atherosclerotic Carotid Plaque Segmentation in Ultrasound image. Computer Methods and Programs in Biomedicine, 153:19-32. (2018)
CrossRef - Cattaneo, R. Wyttenbach, R. Corti, D. Staub, and A. Gallino. The Growing Field of Imaging of Atherosclerosis in Peripheral Arteries. Angiology, 70(1):20 -34. (2019)
CrossRef - Steinl and B. Kaufmann. Ultrasound Imaging for Risk Assessment in Atherosclerosis. International Journal of Molecular Sciences, 16: 9749-9769. (2015)
CrossRef - Lekadir, A. Galimzianova, À. Betriu, M. del Mar Vila, L. Igual, D. L. Rubin. A Convolutional Neural Network for Automatic Characterization of Plaque Composition in Carotid Ultrasound. IEEE J. Biomedical and Health Informatics, 21: 48-55. (2017)
CrossRef - Nagaraj, C. Asha, and A. Narasimhadhan. Carotid Wall Segmentation in Longitudinal Ultrasound Images Using Structured Random Forest, Computers & Electrical Engineering, 69: 753 -767. (2018)
CrossRef - Faust, U. R. Acharya, V. K. Sudarshan, R. San Tan, C. H. Yeong, F. Molinari. Computer Aided Diagnosis of Coronary Artery Disease, Myocardial Infarction and Carotid Atherosclerosis Using Ultrasound Images: A Review. Physica Medica, 33: 1-15. (2017)
CrossRef - R. Lucci, E. Schvartz, R. Lagos, L. F. Cisneros, V. P. Lereis, and S. F. Ameriso. Detection of Subclinical Atherosclerosis in Subclavian Arteries of Subjects with Vascular Risk Factors and Normal Carotid Ultrasound. Journal of Stroke and Cerebrovascular Diseases, 27(9):2418 -2422.(2018)
CrossRef - Buon, B. Guidolin, A. Jaffre, M. Lafuma, M. Barbieux, N. Nasr. Carotid Ultrasound for Assessment of Nonobstructive Carotid Atherosclerosis in Young Adults with Cryptogenic Stroke. Journal of Stroke and Cerebrovascular Diseases, 27: 1212-1216. (2018)
CrossRef - Hjelmgren, C. Schmidt, L. Johansson, and G. M. Bergström. Comparison Between Magnetic ResonanceIimaging and B‐mode Ultrasound in Detecting and Estimating the Extent of Human Carotid Atherosclerosis. Clinical Physiology and Functional Imaging, 38: 296-303. (2018)
CrossRef - Moccetti, C. C. Weinkauf, B. P. Davidson, J. T. Belcik, E. R. Marinelli, E. Unger. Ultrasound Molecular Imaging of Atherosclerosis Using Small-Peptide Targeting Ligands Against Endothelial Markers of Inflammation and Oxidative Stress. Ultrasound in Medicine & Biology, 44: 155-1163. (2018)
CrossRef - Huang, Y. Xie, Y. Lan, Y. Hao, F. Chen, Y. Cheng. A New Framework for the Integrative Analytics of Intravascular Ultrasound and Optical Coherence Tomography Images,” IEEE Access, 6: 36408 – 36419. (2018)
CrossRef - Zafar, M. Leahy, W. Wijns, M. Kolios, J. Zafar, N. Johnson. Photoacoustic Cardiovascular Imaging: A New Technique for Imaging of Atherosclerosis and Vulnerable Plaque Detection. Biomedical Physics & Engineering Express, 4:032002. (2018)
CrossRef - Abdel Aziz, Allan Hanburr. Metrices for Evaluating 3D Medical Image Segmentation : Analysis, Selection and Tools. BMC Medical Imaging, 15:28. (2015)
CrossRef - P. Loizou , C.S. Pattichis , M. Pantziaris , A. Nicolaides. An Integrated System for the Segmentation of Atherosclerotic Carotid Plaque. IEEE Trans. Inf. Tech- nol. Biomed. 11(6): 661–667. (2007)
CrossRef - SaifDawood Salman Al-Shaikhli, Michael Ying Yang, Bodo Rosenhahn. Medical Image Segmentation Using Multi – level Set Partitioning with Topological Graph Prior. Image and Video Technology – PSIVT Workshops, 157 – 168. (2013)
CrossRef - , Sudha, K B Jeyanthi, C Rajasekaran, Nirmala Madian and Sundar T. Convolutional Neural Network for Segmentation and Measurement of Intima Media Thickness. J Med Syst42 (8):154. (2018). https://doi.org/10.1007/s10916-018-1000.
CrossRef

