
Manuscript accepted on :08-09-2022
Published online on: 19-09-2022
Plagiarism Check: Yes
Reviewed by: Dr. Debarshi Kar Mahapatra
Second Review by: Dr. Dewi Syahidah
Final Approval by: Dr. Eman Refaat Youness
Mohd. Maroof Siddiqui1* , Ruchin Jain2, Mohd. Suhaib Kidwai3 and Mohammad Zunnun Khan4
1College of Engineering, Dhofar University, Sultanate of Oman.
2College of Engineering, RBCET, India.
3College of Engineering, Integral University, Lucknow, U.P., India.
4University of Bisha, KSA.
Corresponding Author E-mail: maroofsiddiqui@yahoo.com
DOI : https://dx.doi.org/10.13005/bpj/2479
Abstract
Electroencephalogram (EEG) is a recording of the electrical movement of the brain from the scalp. For sleep disorder analysis the EEG test is done while the subject is sleeping. In this paper discuss about recording of brain signal (EEG) and how these signal play major role to finding in different brain diseases. EEG data can be different when subjects are asleep or when exhausted or when some sort of action takes place. When the patient is awake standard EEG test can be taken, but it may not demonstrate any unusual electrical action. During the sleep, brainwave patterns alter and may show more unusual electrical action.
Keywords
Electroencephalogram(EEG); Electrode Positioning System(EPS); Montage; Polysomnography; Stages of sleep Montage;
Download this article as:| Copy the following to cite this article: Siddiqui M. M, Jain R, Kidwai M. S, Khan M. Z. Recording of Eeg Signals and Role in Diagnosis of Sleep Disorder. Biomed Pharmacol J 2022;15(3). |
| Copy the following to cite this URL: Siddiqui M. M, Jain R, Kidwai M. S, Khan M. Z. Recording of Eeg Signals and Role in Diagnosis of Sleep Disorder. Biomed Pharmacol J 2022;15(3). Available from: https://bit.ly/3qOI12A |
Introduction
A sleep EEG test is generally done in the laboratory, using a standard machine of EEG. Before the test patients may be given a medicine to make him go to sleep. Tests usually last for 1-2 hours and the person can go to routine work normally after the test 1,2. EEG waveforms represent the movement of the surface brain waves. This movement is subjective to the electrical action from the brain structures.
 |
Figure 1: EEG traces 37 |
MONTAGES
Montage is defined as the process of the placement of the electrodes over the scalp for EEG recording. The basic montage can be either bipolar or typically uses six exploring electrodes and two reference electrodes. In case of seizure it may need more electrodes to be applied. The exploring electrodes are mounted on the scalp near the frontal, central and occipital parts of the brain. The visual record of the sleep brain activity is provided by these electrodes that can be segmented into different stages of sleep (N1, N2, N3 as NREM, REM).15,4-7 The current that is flowing throughout synaptic excitation of the dendrites of a number of pyramidal neurons in the cerebral cortex is calculated by EEG.
Since EEG is capable of reflecting regular and irregular electrical action of the brain, therefore, it is considered to be a dominant tool in the field of clinical neurophysiology and neurology.
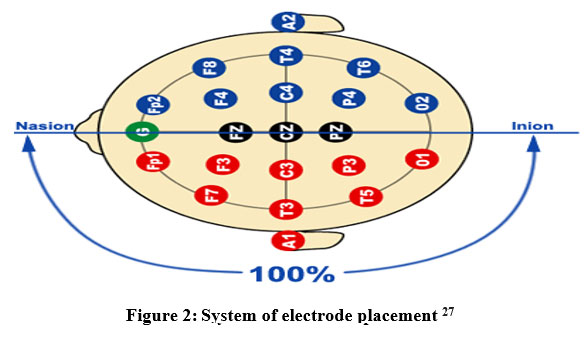 |
Figure 2: System of electrode placement 27 |
Bipolar Montage
Bipolar montage system consists of two electrodes per channel. There is a reference electrode for every channel. Bipolar Montage is further classified into two types which are mentioned as:
Longitudinal Bipolar (LB)
Transverse Bipolar(TB)
The entire montage contains a sequence of these channels. These channels represent difference in voltages of different electrodes, such as
“F3-C3” presents the diversity in voltage among the F3 electrode & the C3 electrode.
“C3-P3,” presents the voltage diversity between C3 and P3, and so on from side to side array of electrodes.
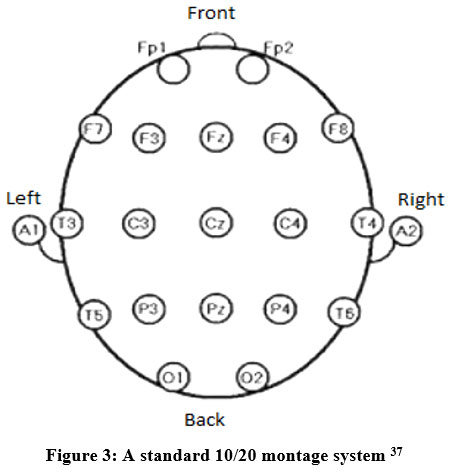 |
Figure 3: A standard 10/20 montage system 37 |
Referential Montage
For all of the channels in the referential montage, a single generic reference electrode is used. Every channel in this system reflects the divergence between a fixed electrode and a chosen reference electrode. Due to the fact that they do not amplify the signal in only one hemisphere when compared to another, midline locations are employed as references. The location of the linked ears serves as another typical reference electrode position27-33. These are the electrodes of two earlobes and mastoids’ physical or mathematical averages.
Average Reference Montage
Every amplifier’s output is added together, the average of which is then taken as a reading and utilized as the general reference for every channel.
Laplacian Montage
All channels show the variation between a single electrode and the weighted average of its nearby electrodes. The term source current density montage is another name for it. Its name is taken from the Laplace mathematical function. The radial current density determines the Laplace of the scalp potential.5 The current per unit volume travelling radically into a region of scalp from the sources underneath is known as the radial current density. When there is no underlying current source, the Laplacian is zero, and when it is directed at the source, it is maximum.
Electrode Positioning System
The 10-20 system is a widely used technique for placing electrodes across the scalp. It is a system that illustrates the relationship between the sites of an electrode and the critical region of the cerebral cortex. The numerals 10 and 20 indicate the separation between the neighboring electrodes. Here,11,14 “10/20” refers to 10% to 20% of the whole front-to-back or right-to-left head detachment. The five primary places where the skull is researched are as follows:
Frontal Lobe
Temporal Lobe
Central Lobe
Parietal Lobe
Occipital Lobe
We divide the brain into two sections for measuring purposes. Right and left hemispheres make up the first and second parts, respectively. Each lobe in the measurement is designated with a letter. To determine the type of hemisphere, a number is also employed along with the lobe. The quantity can be
Even number
Odd number.
Electrodes in the right hemisphere are indicated by even numbers. Examples are 2, 4, 6, 8, etc. Odd numbers indicate where the electrodes are located in the left hemisphere. Examples are 1, 3, 5, 7, etc. A “z” subscript indicates the electrodes’ midline location. This system aids in the positioning of electrodes. Which are:
Nasion
Inion
Pre-auricular points anterior to the ear
A point between the forehead and the nose is referred to as the nasion. The term “inion” refers to a noticeable hump on the back of the head. From the rear side of the head, it is the lowest point.
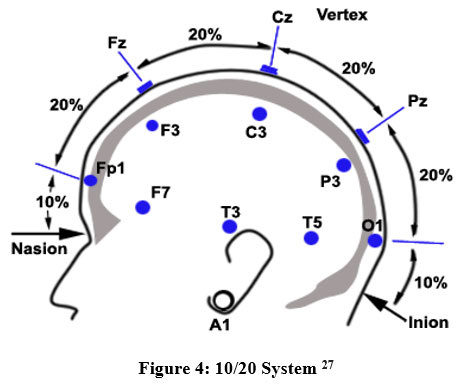 |
Figure 4: 10/20 System 27 |
Polysomnography
Polysomnography (PSG) is also called the sleep study. It is an examination used in the study of sleeps and can be helpful for diagnosis of sleep disorder. The test result obtained is called a polysomnogram abbreviated as PSG.
Polysomnography records the bio-physiological changes that occur while a person is fully asleep. This test is usually performed at night when the person suffering from the sleep disorder is sleeping. The PSG monitors and records the patient’s heart rate (ECG), eye movements (EOG), brain waves (EEG), and muscle activity or skeletal muscle activation while they are sleeping at a sleep lab or hospital 15-19.
Discussion and Conclusion
This study discusses the use of EEG signals to identify sleep disorders. Its goal is to foster technological innovation in order to produce a reliable and efficient result from sleep disorder diagnosis and differentiation throughout all phases of sleep disorder. I will continue to work on it and communicate with specialists in order to obtain more information that may aid in the diagnosis of sleep disorders. To completely execute the suggested vision, more research and development is required.
Acknowledgement
none
Conflict of Interest
There is no conflict of interest.
Funding Sources
There is no funding sources
References
- Tzallas, A. T., Tsipouras, M. G., & Fotiadis, D. I. In Engineering in Medicine and Biology Society, 2007. EMBS 2007. 29th Annual International Conference of the IEEE (pp. 3-6). IEEE.(2007)
CrossRef - Tzallas, A. T., Tsipouras, M. G., & Fotiadis, D. I. Epileptic seizure detectionin EEGs using time–frequency analysis. IEEE transactions on information technology in biomedicine, 13(5), 703-710(2009).
CrossRef - Parhi, K. K., & Ayinala, M. IEEE Transactions on Circuits and Systems I: Regular Papers, 61(1), 172-182. (2014).
CrossRef - Siddiqui M. M, Srivastava G, Saeed S. H. Diagnosis of Nocturnal Frontal Lobe Epilepsy (NFLE) Sleep Disorder Using Short Time Frequency Analysis of PSD Approach Applied on EEG Signal. BiomedPharmacol J 2016;9(1)
CrossRef - Siddiqui, Mohd Maroof, et al. “Detection of rapid eye movement behaviour disorder using short time frequency analysis of PSD approach applied on EEG signal (ROC-LOC).”Biomedical Research 26.3(2015): 587- 593.
CrossRef - Diykh, M., Li, Y., & Wen, P. IEEE Transactions on Neural Systems and Rehabilitation Engineering, 24(11), 1159-1168. (2016).
CrossRef - Malinowska, Urszula, et al. “Micro-and macrostructure of sleep EEG.” IEEE engineering in medicine and biology magazine 25.4 (2006).
CrossRef - Khandoker, Ahsan H., Marimuthu Palaniswami, and Chandan K. Karmakar. “Support vector machines for automated recognition of obstructive sleep apnea syndrome from ECG recordings.” IEEE transactions on information technology in biomedicine 1 (2009).
CrossRef - Henelius, Andreas, Jussi Korpela, and Minna Huotilainen. “Individualising EEG frequency bands for sleep deprivation studies.”Engineering in Medicine and Biology Society, EMBC, 2011 Annual International Conference of the IEEE, (2011).
CrossRef - Quine, L. “Sleep problems in children with mental handicap.”Journal of Intellectual Disability Research4 (1991).
CrossRef - Stores, Gregory. “Children’s sleep disorders: modern approaches, developmental effects, and children at special risk.”Developmental Medicine & Child Neurology8 (1999).
CrossRef - Liu, Derong, Zhongyu Pang, and Stephen R. Lloyd. “A neural network method for detection of obstructive sleep apnea and narcolepsy based on pupil size and EEG.”IEEE Transactions on Neural Networks2 (2008).
CrossRef - Iasemidis, Leon D. “Epileptic seizure prediction and control.”IEEE Transactions on Biomedical Engineering5 (2003).
CrossRef - Siddiqui M. M, Srivastava G, Saeed S. H. Detection of Sleep Disorder Breathing (SDB) Using Short Time Frequency Analysis of PSD Approach Applied on EEG Signal. Biomed Pharmacol J 2016;9(1)
CrossRef - Siddiqui, Mohd Maroof, et al. “EEG Signals Play Major Role to diagnose Sleep Disorder.” InternationalJournal of Electronics and Computer Science Engineering (IJECSE) 2.2 (2013): 503-505.
- Goldberger, A. L., Amaral, L. A., Glass, L., Hausdorff, J. M., Ivanov, P. C., Mark, R. G., … & Stanley, H. E. (2000). Physiobank, physiotoolkit, and physionet. Circulation, 101(23), e215-e220
CrossRef - Srivastava, S. K., Ahmed, S., & Siddiqui, M. M. (1992). Analysis of Brain Signal for the Detection of Epileptic Seizure. American Sleep Disorders Association (ASDA). EEG arousals: scoring rules andexamples. Sleep, 15, 173-184.
CrossRef - Siddiqui, Mohd Maroof, et al. “Detection of Periodic Limb Movement with the Help of Short Time Frequency Analysis of PSD Applied on EEG Signals.” Extraction 4.11 (2015)
- Siddiqui, Mohd Maroof, et al, “Diagnosis of narcolepsy sleep disorder for different stagesof sleep using Short Time Frequency analysis of PSD approach applied on EEG signal,” 2016 International Conference on Computational Techniques in Information and Communication Technologies (ICCTICT),New Delhi, 2016, pp. 500-508.
CrossRef - Siddiqui, Mohd Maroof, et al . “Detection of Rapid Eye Movement Behaviour Sleep Disorder using Time and Frequency Analysis of EEG Signal Applied on C4-A1 Channel”. Communication and Power Engineering, edited by R. Rajesh and B. Mathivanan, Berlin, Boston: De Gruyter, 2017, pp. 310- 326. https://doi.org/10.1515/9783110469608-031
CrossRef - Siddiqui MM, et al. Diagnosis of insomnia sleep disorder using short time frequency analysis of PSD approach applied on EEG signal using channel ROC-LOC. Sleep Science (2016)
CrossRef - Becq, G., Charbonnier, S., Chapotot, F., Buguet, A., Bourdon, L., & Baconnier, P. (2005). Comparison between five classifiers for automatic scoring of human sleep recordings. Classification and Clustering for Knowledge Discovery, 113-127.
CrossRef - Charbonnier, S., Zoubek, L., Lesecq, S., & Chapotot, F. (2011). Self-evaluated automatic classifier as a decision-support tool for sleep/wake staging. Computers in biology and medicine, 41(6), 380-389.
CrossRef - Siddiqui M. M, Srivastava G, Saeed S. H.(2017). Alzheimer: A Neurological Disorder. Research and Reviews: Journal of Medicine. 7(1)
- Diagnostic, D. S. M. V. (2013). statistical manual of mental health disorders: DSM-5. 5.
- Siddiqui, M. M., Srivastava, G., & Saeed, S. H. (2019). Diagnosis of Sleep Disorders using EEG Signal. LAP LAMBERT Academic Publishing.
- Malnivuo, J.,Plonsey R.(1995). Bioelectromagnetism, Oxford University Press.
- Siddiqui M. M,”Electronics Instruments Play Major Role In Diagnosis Processes” International Journal Of Computing And Corporate Research(IJCCR)2.1(2012)
- Siddiqui M. M, “Electronics Signal Help In The Treatment of Paralysis” International Journal of Electronics Signal & System(IJESS)1.2(2012)63-67
- Siddiqui M. M, Jain R. Prediction of REM (Rapid Eye Movement) Sleep Behaviour Disorder using EEG Signal applied EMG1 and EMG2 Channel. Biomed Pharmacol J 2021;14(1).
CrossRef - Wahab, A., & Siddiqui, M. M. ELECTRONIC INSTRUMENTS HELP IN DIAGNOSIS OF SLEEP DISORDERS.
- Akhtar, M., Abbas, K., & Siddiqui, M. M. (2015). NOCTURNAL FRONTAL LOBE EPILEPSY (NFLE): MEDICAL SLEEP DISORDER. In International Conference on Emerging Trends in Technology, Science and Upcoming Research in Computer Science, DAVIM, Faridabad, 25th April (pp. 1168-1172).
- Cipani, E., & Schock, K. M. (2010). Functional behavioral assessment, diagnosis, and treatment: A complete system for education and mental health settings. Springer Publishing Company.
- Agarwal, R., Takeuchi, T., Laroche, S., & Gotman, J. (2005). IEEE Transactions on biomedical engineering, 52(8), 1390-139
CrossRef - Pandey, V., Agarwal, A., & Siddiqui, M. M. (2015). Sleep disorders and EEG recording. International Journal of Electronics and Computer Science Engineering (IJECSE), 4, 206-210.
- Anas, A., & Siddiqui, M. M. (2015). Advent of Biometric Sensors in Field of Access Control. International Journal of Electronics and Computer Science Engineering (IJECSE), 4, 326-329.
- Smith E J (n.d.) Our mandate. Retrieved http://www.ebme.co.uk/articles/clinical-engineering/56-introduction-to-eeg.

