
Manuscript accepted on :08-07-2022
Published online on: 04-08-2022
Plagiarism Check: Yes
Reviewed by: Dr. Ana Golez
Second Review by: Dr. Grigorios Kyriakopoulos, Dr. Harilal Parasuram
Final Approval by: Dr. Patorn Piromchai
Ajay N Paithane1* and Mukil Alagirisamy2
Lincoln University College Malaysia and Professor at JSPMs Rajarshi Shahu College of Engineering, Pune, India.
Lincoln University College, Wisma Lincoln, Jalan SS, Petaling Jaya, Selangor Darul Ehsan, Malaysia.
Corresponding Author E-mail: ajaypaithane@gmail.com
DOI : https://dx.doi.org/10.13005/bpj/2471
Abstract
The human stress is a mental condition that can abnormally change the brain electrical activity, thus, electroencephalogram (EEG) signal measurements can detect and quantify those brain cognitive changes that are differentiated from the normal state. In this research work, EEG signals are used for the analysis and detection of the level of human stress. The EEG signals are collected from the human being called it as a subject under test. The stroop colour test has been used as a stressor to induce stress in the subjects under test. The various levels of stress in the stroop test have been verified to low, moderate, and high levels of stress in the subject. The input signals are then decomposed into the number of a narrowband signal using wavelet transform. During the experimentation important features are also extracted from EEG signal to identify normal and abnormal signals. The SVM classifier has been used in our research work for the classification of stress and non stress signals. The performance of the proposed system using SVM is comparatively good in dependent and independent systems. The highest accuracy achieved in this study is 90% (Standard Deviation = 0.015) for user-dependent systems and 72.3% (SD = 0.08) for user-independent systems. The results show that the proposed system is reliable for detecting stress and normal levels respectively.
Keywords
Alpha; Beta; EEG; ECG; Gamma; SVM; Theta
Download this article as:| Copy the following to cite this article: Paithane A. N, Alagirisamy M. Electroencephalogram Signal Analysis Using Wavelet Transform and Support Vector Machine for Human Stress Recognition. Biomed Pharmacol J 2022;15(3). |
| Copy the following to cite this URL: Paithane A. N, Alagirisamy M. Electroencephalogram Signal Analysis Using Wavelet Transform and Support Vector Machine for Human Stress Recognition. Biomed Pharmacol J 2022;15(3). Available from: https://bit.ly/3QhYIxP |
Introduction
In this advanced world of medicinal technology, various newly developed techniques are required to diagnose the disease. Electrocardiography (ECG) is required for analyzing the heart related disease, the human muscular contractions can be identified by using electromyography (EMG) signals. Similarly, human brain activity can be identified using electroencephalography & magneto encephalography. During the literature survey, it has been noticed that numerous research studies have focused on a variety of ways to identify the mental stress level of human beings using various biomedical signals 30. The list of biomedical signals used to identify stress level may include ECG, EEG, EMG, skin temperature and magneto encephalogram 2, 28. In medical signal and image analysis, the electrical activity generated by various organs such as the brain, the heart, and muscles is observed 1, 27. However, the change in human activity gives an idea of the abnormality in human beings. By analyzing the electrical signals generated by the respective organs, the actual status of the respective organs can be used to predict the level of human mental stress. The non stress or stress status of human beings can be observed from the electrical signals generated by the brain, heart, and muscles when the status of a person changes10. EEG, ECG, EMG, and skin conductance signals have become a popular tools for finding a person’s stress by balancing the electrical activity of the brain, heart, muscles, and body temperature 12. Nowadays, in this lifestyle, human stress has become a vital part of day-to-day life. However, it has become very essential to detect human stress in its early stages. The level of human stress depends on human behaviour as well as the tendency of the human body to react to the present situation or the way of handling the situation 28. Every human being experiences stress in life in any possible situation. That situation may be in day to day work, at the office or in any situation in life. The level of stress may be low, high or medium. This level of stress may create a health issue in healthy human beings. People who are experiencing high-level stress may feel negative emotions, which will lead to major depression in human beings27. In many situations, human stress plays a positive role also. Although high-level stress-prone to depression, medium level stress improves the productivity of human beings, hence it is beneficial in some crucial situations19. So the early detection of mental stress may lead to protecting human beings from this situation.
This Paper proposes a level of human stress detection using EEG signals, with the help of support vector classifier. The proposed system gives an idea about the high, low, and medium level of human stress during working environment which is very useful for real time applications. The experimental study shows that the accuracy of 90% and 72.3% for subject dependent and independent system can be achieved.
Section 2 of this paper consists of survey related to human stress detection, Section 3 consists of process for database generation and details of the experiments for validation, Section 4 has described the complete system in detail. Finally, the paper has been end with conclusion.
Literature Review
In 3, the author has been claimed 79.2% recognition of two human states. The techniques used for classification and feature selection are support vector machine and genetic algorithms, respectively.
An extensive structure for the initial identification of mental stress by breaking down varieties in EEG and ECG signals has been proposed in 20. Prediction of treatment efficacy compared to accuracy had been emphasized. Model explained in the paper defined the stress in 4 classes. Results had shown significant difference in the stress and the control conditions.
In 22, the k-nearest neighbours (k-NN) method has been suggested for better recognition. The stimulation method is used to persuade appropriate stress. Similarly, a neural network algorithm has been proposed for feature extraction and better recognition.
In 23, a system for stress recognition using the k-NN method has been proposed for better accuracy. The accuracy proposed by the author is almost 74%. To achieve this accuracy, the author has used very important features like band power of theta, alpha, and beta waves.
In work 18,21, a very accurate stressor called stroop colour test has been proposed for inducing the stress, also the HRV signals has been proposed for identification of normal/abnormal signals.
The support vector machine is proposed in 25 for classification. However, it has a problem in the training process during sampling .
The author proposed a real time system for stress recognition in 26. The headset, stroop colour test, and k-NN has been used for capturing signals, as a stressor, and for classification respectively.
The artifacts removing technique is proposed in 13 using statistical methods.
The artifacts removing technique using DWT and ICA is suggested in 14 and the effectiveness of the proposed system is verified with existing methods.
The human stress levels such as level 1, 2, & 3 has been classified in 17 using SVM binary classifier. The author portrayed the effectiveness of the proposed system.
Author suggested various technique for stress detection, such as phonocardiography, interbeat interval and Wallis test for feature extraction in 18, and classification using least square SVM
In 20, a multimodal system using EEG & ECG signals has been proposed for stress recognition. The focus of this research was on the accuracy and the efficiency for mental stress treatment.
In 21, a research is carried out for the stress detection at work place. The database consist of Cortisol, stress harmone for level identification using frequency and time domain features.
The proposed research in 22 is about the stress detection during driving using EEG signals. Supervised classifiers are used to classify the signals. such as, SVM, neural networks, and Random Forest.
In 25, a system has been proposed by the author for stress state detection. Author suggested a STCWT for stress elicitation and the maximum accuracy can be achieved using k-NN classifier but unable to perceive for real time system.
Methodology
The proposed system is about to detect human stress at the early stage of generation. In this system, we have proposed multiple modes as inputs to the system, such as electroencephalogram and electrocardiogram ( EEG & ECG). Human Stress gives an idea about the mental situation of any human being 4, 5. The main aim of the proposed system is to detect high, medium, and low levels of stress present in human beings during activity. For the validation of the system, the Stroop colour-word test or any significant method as stimuli are required to induce various levels of stress[]. Stress is a vital part of the daily routine of human beings. From the survey, it has been identified that facial expression, speech, and physiological signals can be used to detect human stress. Although facial signals and speech signals are used for human stress detection, they have some drawbacks. Human stress can be hidden in facial expressions as well as in speech signals. However, stress cannot be hidden in physiological signals like EEG signals and ECG 3. Hence, a stress detection technique using EEG signals is proposed for the early detection of human stress in this research work.
In this work, the first and foremost step is to collect EEG signals. In the experimentation, Electrodes are placed on the scalp of a person under test. The electrodes capture the brain signals in the form of alpha, beta, gamma, and theta in the range of microvolts 15,34. However, the amplifiers used in the experiment convert the EEG signals to the correct range required for further processing 20. The second step in this research work is to identify hardware components for the collection of EEG signals from reusable electrodes. To make it simpler, a system with an Arduino controller is used for converting the signals. Once the signals are collected, then these signals are analysed to extract important features by using an appropriate feature extraction technique. The last step in this research work is to classify the mental states of human beings. Therefore, by using the SVM classifier, the stress and normal state of human beings have been classified.
The data flow diagram as shown in Fig. 1 mainly consists of signal acquisition, pre-processing, feature extraction, classification, and finally recognition. The EEG dataset has been collected in the research laboratory and a cost effective system using Arduino has been developed for the data acquisition. Moreover, the standard database is also used in this work for cross verification of the dataset developed. The results achieved using both types of dataset are satisfactory. The first step in the flow diagram is pre-processing, in which the bandpass filter is used to remove motion artefacts as well as the unwanted noise added during the signal acquisition process 27. The EEG electrodes are used to collect the electroencephalogram signals.
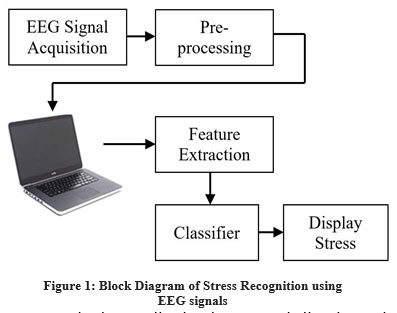 |
Figure 1: Block Diagram of Stress Recognition using EEG signals. |
EEG Dataset Acquisition
In the EEG dataset acquisition process, our own laboratory has been used to collect the EEG signal database. The people or subjects under test are chosen from a group of people who have not been in any type of accident or injury, as well as those who are in good health and do not have any mental disorder 29. Total 50 healthy people were chosen for data collection. Of these, 25 subjects were male and 25 subjects were female in the age group of 20 to 35 years. The total number of signals collected from 50 healthy subjects is 200. Out of the collected 200 signals, “10 samples” were rejected as the subject under test was found in an abnormal state. Taking note of the accuracy to be maintained, we rejected those signals. The actual placement of EEG electrodes during acquisition is as shown in Fig. 2. The exact placement of the electrodes are the left channel 1 (Fp1), the right channel 2 (Fp2) and the ground location (Fpz) for the accurate acquisition of the signal.
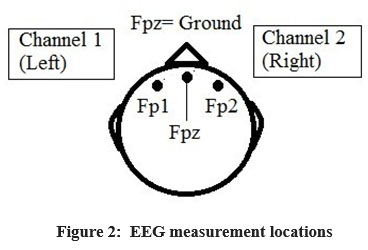 |
Figure 2: EEG measurement locations. |
Accurate database collection is a very challenging task in this research. However, this challenging work is well managed by developing a laboratory at the research centre with full acoustics. Moreover, the selection of the stressor for the targeted stress level is a very tough task in this dataset development process. During a literature survey, it has been observed that the accuracy and effectiveness of the stroop colour test as a stressor is significant. So, the Stroop colour-word test is used in our work to induce the level of stress in the individual subjects 12,15. The level of stressor is managed in accordance with the needs of individual subjects. The methodology adopted in the stroop colour test is divided into two sections. In the first section, the subject under test is allowed to relax for 30 minutes before the dataset collection. The second section of the stroop colour test consists of the total time duration of the test, so the time duration for the test allowed for each subject is 10 seconds. The main feature of having two sections in the stroop colour test is to induce the correct stress levels in individual subjects. Human stress is one of the human emotions that occurs when a stimulus to the human brain is negative, and hence human stress belongs to negative valence and high arousal 30. The placement of EEG electrodes on the scalps of human beings is very important to capture the right EEG signals.
Stroop colour test sections
The stroop colour test is a very important step in this stress test recognition system. The basic concept of the stroop colour test is to induce stress in the subject under test 6,12. The basic objective of the stroop colour test in this research is to provide different levels of the stressor to induce stress. The stroop colour test is divided into several sections, including the introductory section (IS), the congruent Section(CS), and incongruent section1 and 2 (ICS-1/ICS- 2). The levels of the questionnaire are different in different sections. The levels depend on the level of stress. The experiment is designed to induce three different stress levels in sections CS, ICS-1, and ICS-2. The level of the stress can be discriminated against based on the intensity of the stressor15. In the data collection process, the subject under stress has a choice to select the stroop colour test based on its levels. The lower level of the stroop colour test has a very low level of the stroop stress and strain, whereas the moderate level and high level stroop colour test have a higher stress and strain than the previous level.
In our experiment, we are using the Stroop colour-word test as the stressor to induce various levels of stress. The Stroop colour-word test reliably induces stress in subjects. Each subject is subjected to individually targeted levels of the stress 6. Test duration is 10 seconds for each section. The test includes several sections to induce various levels of stress. The prefrontal area was selected in this study because the brain signals in this area are related to human emotions, where stress belongs to negative valence and high arousal 9,31.
Introductory Section (IS): The introductory section of the stroop colour test is to make the subject under test aware of the steps required to be followed by the subject under test during experimentation for the collection of stress signals. Moreover, it is a guideline for the subject on the stroop test and the answers to be given on the questionnaire during the test. The introductory part of the stroop test is mainly useful for maintaining the state of mind of the subject under test and improving the level of dataset, which will definitely improve the accuracy level of the system15.
Congruent Section (CS): The congruent section of the stroop test is as shown in Fig. 3. This is the beginner’s level of the test. In this section, the level of the stress induced due to the task is very low. The reason behind the low level of stress is due to the simplicity of the task. The pattern of the questions in this section is to recognise text colours given in this test which match with the actual colour of the word. For example, the word given in the test is RED, so the word RED should have a red colour (RED).
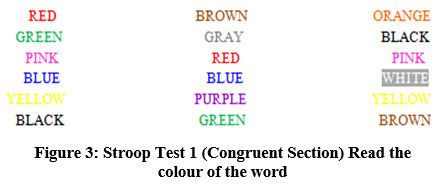 |
Figure 3: Stroop Test 1 (Congruent Section) Read the colour of the word. |
Incongruent Section 1 (ICS-1): The Incongruent section I (ICS-I) of the stroop test, as shown in Fig. 4, is the moderate level of the test 15. In this section, the level of the stress induced due to the task is moderate. The reason behind the moderate level of stress is due to the level of the task. The pattern of the questions in this section is to recognise words given in this test which differ in the actual colour of the word. For example, the word given in the test is RED, so the word RED may be written in any colour like blue, red, black, etc. (RED). Hence, the level of stress expected in the subject due to the incongruent section I (ICS-I) of the stroop test is moderate 12.
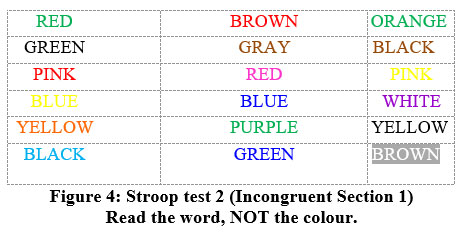 |
Figure 4: Stroop test 2 (Incongruent Section 1) Read the word, NOT the colour. |
The Incongruent section I (ICS-I): The incongruent section 2 (ICS-2) of the stroop test, as shown in Fig. 5, is the very high level of the test. In this section, the level of the stress to be induced due to the task should be moderate. The reason behind the high level of stress is due to the level of the task. The pattern of the questions in this section is to recognize the colour of the word given in this test, which differs from the actual meaning of the word. For example, the word given in the test is RED, so the word RED may be written in any colour like blue, red, black, etc. (RED). Hence, the level of stress expected in the subject due to the incongruent section 2 (ICS-2) of the stroop test is very high.
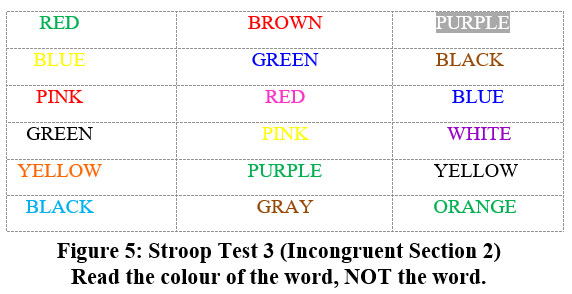 |
Figure 5: Stroop Test 3 (Incongruent Section 2) Read the colour of the word, NOT the word. |
The laboratory setup used for recording the dataset meets all the necessary requirements like acoustics, good quality electrodes, high signal to noise ratio (SNR), electrical interference and electrical grounding 27. However, the electro-encephalogram (EEG) signals recorded in the lab are raw signals. The movements during acquisition generate huge artefacts in the raw electro-encephalogram (EEG) signals 28 and hence, reduce the quality of the dataset. However, identifying artefacts in real time signals and their causes by observation is a very difficult and challenging task. In our research work, a pre-processing technique is used for the removal of redundant frequencies and artefacts generated due to neck movements, eye blink, and jaw movements.
Pre-processing and Feature Extraction
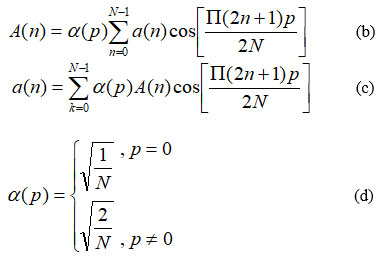
The first and foremost step in this research is Pre-processing of input signal to avoid unwanted noise and artifacts [31].
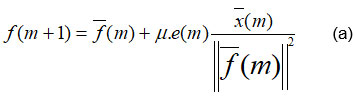
The equation (a) is used for preprocessing, and the (m+1) number of iteration required for coefficient update. In this process step size plays very important role in processing, while the larger size prone to instability and time converge becomes worst in small size 17,32. The discrete cosine transform is used to extract best features from the input EEG signals. The optimal features are used to construct a feature vector for concentrating low and high frequency coefficients.
The laboratory setup that has been used for recording the dataset meets all the necessary requirements like acoustics, good quality electrodes, high signal to noise ratio (SNR), electrical interference, and electrical grounding. However, the real time electro-encephalogram (EEG) signals are contaminated with noise, interference and artefacts 26. The pre-processing techniques that have been used in this research are quite impressive for removing the noise, interference, and artefacts. The feature extraction techniques are further required to extract important features from the input signal for accurate recognition and identification of normal/abnormal signals. The performance accuracy of the system is mainly dependent on the feature set. Moreover, appropriate feature extraction and selection play a vital role in the recognition system 32. The existing feature extraction methods have their own importance in recognition. The existing methods in human computer interaction, such as DCT, WPT, and DWT, are used in previous recognition systems 10. Hence, in this research work, the feature extraction technique was adopted for the reduction of dimensional space. The power spectral features such as theta band, alpha band, and beta band are used in this study for stress recognition.
Table 1: EEG waveforms specification.
Signal |
Frequency |
Activity |
Delta(δ) |
Less than 4 Hz |
Increased power during difficult conditions |
Theta (θ) |
4 – 8 Hz |
Power increases during the stress |
Alpha (α) |
8 – 12 Hz |
Power Suppresses during the stress |
Beta (β) |
13 – 31 Hz |
Power varies according to task difficulty |
Gamma (γ) |
>31 Hz |
Power increases during meditation |
Frequency Range selection
The table 1 depicted here is the range of frequencies for various EEG waves. The use and analysis of these EEG waves and their frequency is the primary motive of the research for stress identification 19,20. During the experimental study, the information signal with a frequency range of 1Hz to 60Hz is separated out from the collected dataset. The next step adopted during experimentation is the filtering of unwanted signal from the raw dataset28. The low pass IIR Butterworth filter is the best option to filter out 50Hz frequency elements 3,7. The mathematical model used for the
low pass IIR Butterworth filter with a pass band frequency (fpass) is: fpass=60Hz. Similarly, the mathematical model used for the low pass IIR Butterworth filter with a stop-band frequency (fstop) is: fstop=50Hz
16. In this research, the input EEG signals are decomposed into different frequency bands by using DWT and high-pass and low-pass filtering of the time domain signal. In this process In this process, the EEG signal has been decomposed into 5 frequency bands that are Delta (0–4Hz), Theta (4–8Hz), Alpha (8–16Hz), Beta (16–32Hz), and Gamma (32–64Hz). The experimental verification of the research work is done in MATLAB. The decomposed signal’s power is calculated before giving it to the SVM classifier through Power Spectral Density (PSD). The Power Spectral Density (PSD) depicts the various levels of energy distribution in terms of frequency13. To put it another way, the PSD gives an idea about the meaningful frequency distribution and meaningless frequency distribution available in the decomposed signal. These frequency distributions are used to train SVM along with the frequency distribution levels of the subject under stress identification.
Feature Classification
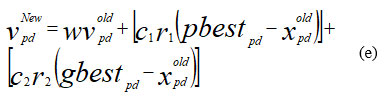
In the proposed system a modified optimization algorithm is adopted, the main crux of the algorithm is the modified technique used for binary value modification11,16. The selective features for identification of the stress level are extracted sophistically using the proposed method.
The classification methods play a crucial role in the human stress recognition system. It consists of two sections, such as a training section and a testing section. In the training section, the mathematical model designed for the classification has a quality of having access to both the defined attribute as well as the predicted attribute. On the other hand, the testing section of the mathematical model has the capability to access the actual class. However, the main objective of adapting the well known classifier in the system is to increase the predictive accuracy. After the feature extraction process, the EEG training data is passed to the classification process. Selection of a classifier is very important to get better results and its capability to compute our signal. The feature set classification for best possible result is finally done using Support Vector Machine. Various classifiers are discussed below.
Table 2: Comparison of signal classification methods8
| Sr.
No. |
Method | Advantages | Disadvantages |
|
1 |
LDA |
1. It has a small computational footprint.
2. Simple to use. 3. It provides good results. |
1. It fails when the discriminatory function
is not in the mean but in the variance of the features. 2. The complex structures may not be preserved in Fornon-Gaussian distributions.. |
|
2 |
SVM |
1. It provides good generalization.
2.It outperforms any other linear classifier in terms of performance. |
1. It has a high level of computational
complexity. |
|
3 |
ANN |
1. Simplicity of use and implementation.
2. Robust in nature. 3. Simple computations are involved. 4. Small training set requirements are required. |
1. It is Difficult to build.
2. Performance depends on the number of neurons in the hidden layer. |
|
4 |
k-NN |
1. Very simple to understand.
2. It is simple to implement and debug. |
1. Inefficient runtime performance when
the training set is large. 2. Susceptible to irrelevant and redundant characteristics |
Results
User Interface: Attempts are being made to detect human stress levels in real time. The efforts are taken to recognize real time human stress levels. This interface contains three distinct sections: real-time data collection, a training/testing module with proper calibration, and a training/testing module with proper calibration. The main focus of this research is to develop real-time subject dependent and subject-independent systems. The data collection phase, as shown in Fig. 6, has a facility to record the signal for a specified time period for better accuracy in the dataset. Moreover, a stimulator is required to induce the level of stress in the subject under test. Hence, a tab is included in the GUI for the stroop colour test.
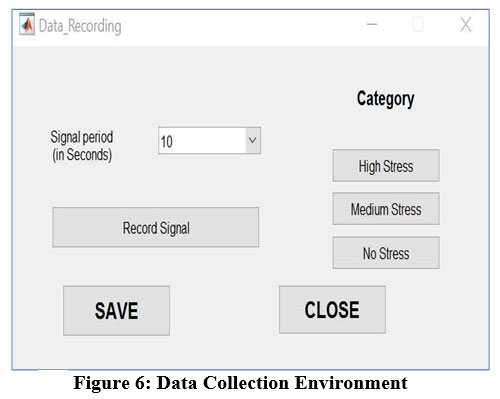 |
Figure 6: Data Collection Environment. |
Numerous EEG signals are collected to train SVM. To achieve maximum accuracy of the proposed system we have collected 135 signals for this experiment. Fig. 7 shows the number of signals in that category of stress levels answered by subjects.
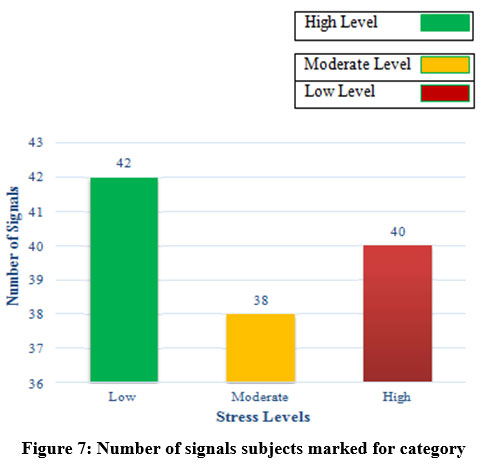 |
Figure 7: Number of signals subjects marked for category. |
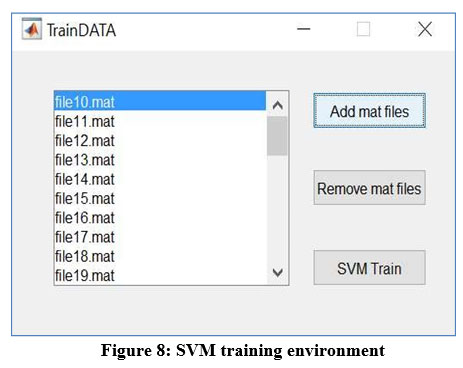 |
Figure 8: SVM training environment. |
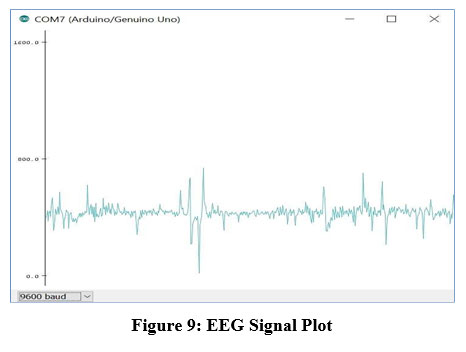 |
Figure 9: EEG Signal Plot. |
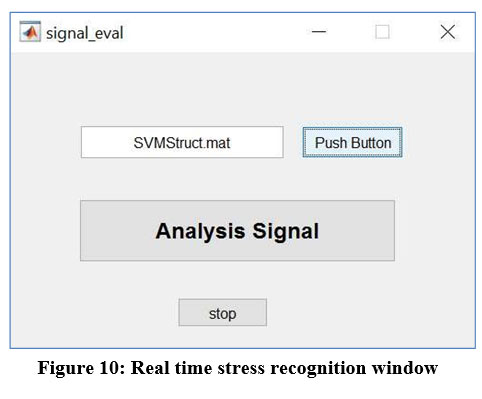 |
Figure 10: Real time stress recognition window. |
A user interface for the real-time stress recognition module has been created. Once training is completed, it can be used to recognise stress levels, which takes reference from a trained algorithm to analyse stress levels. Fig. 10 shows the GUI for signal evaluation. The stress levels are visualised on screen, as shown in the results and discussion chapter. The levels of stress recognised are shown by the graph. Y axis 0 represents low stress, 1 represents moderate stress and 2 represents High stress. This application was developed to give an idea of three possible states, which are Low, Moderate, and High.
Software and Hardware used
EEG signals, being electrical signals, are vulnerable to outside interference and artifacts. Using the signal processing capabilities of MATLAB, these problems can be resolved effectively10. MATLAB R2016B is used for all signal processing and GUI preparation. The EEG signal after hardware processing and passing to the computer after the Arduino is shown in Fig. 11 below.
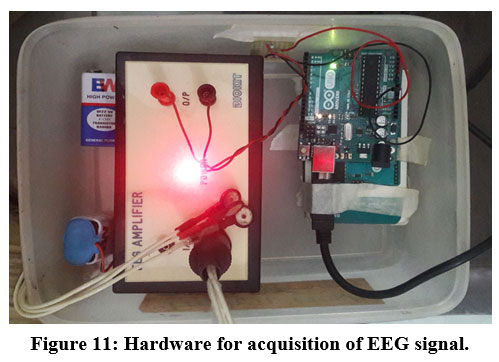 |
Figure 11: Hardware for acquisition of EEG signal. |
The vertical y-axis of the Arduino serial plotter auto adjusts itself as the value of the output varies, i.e. increases or decreases, and the x-axis is a fixed 500 points with each tick of the axis equal to an executed Serial. print ln() command, and it is an auto scrolling x-axis. Fig. 11 shows the hardware setup for acquisition of the EEG signals. We have considered two scenarios before commenting on the results.
Discussion
The prime aim of this research is to provide detailed analysis of the level of human stress under working condition using EEG signals. The cognitive stressor like stroop colour test has been used because of its important feature of automatic reactivity. In this work, we have tested the input signal for subject dependent and independent system for better analysis. In subject dependent system we have used training and testing signals both from available dataset, whereas the independent system required testing signals other that the collected dataset. The importance to subject independent system is to detect correct samples in real time system.
Subject Dependent System
As we have collected 130 signals, we chose 100% of the data collected to train the SVM algorithm. Once the training is done, that is taken as a reference to identify the stress of the inputted real-time/ offline signals. Doing this can give us an accurate idea about the accuracy of the algorithm to meet our requirements. This means the system becomes subject dependent, as we have used signals from the same signals as that of the training signal. the results for subject dependent are shown below. Fig. 12 shows low stress for subject dependent system. As we have the result of that file in hand, we can comment on its accuracy much better. Each type of stress corresponds to a different type of stress, and the power in the sub signals varies accordingly.. Figure shows stress in delta (x-axis 1), theta (x- axis 2), alpha (x-axis 3), beta (x-axis 4) and gamma (x-axis 5) waves, respectively. The Y-axis displays 0 (low stress), 1 (medium stress), and 2 (high stress).
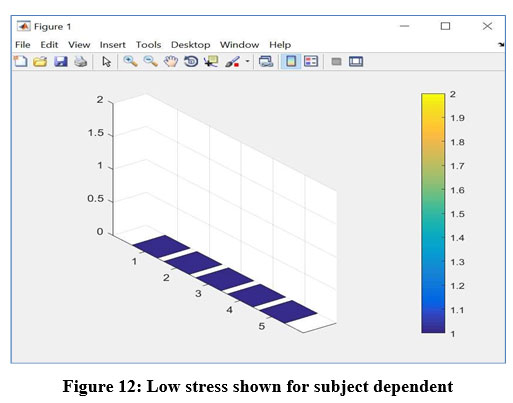 |
Figure 12: Low stress shown for subject dependent. |
Likewise, we tested for all three levels. The remaining two levels are shown in Fig. 13 as moderate stress and Fig. 14 as a high level of stress. It is a but obvious that the accuracy of a subject dependent system is much higher than that of a subject independent system. The accuracy measured for recognition of stress levels is 90% for the subject dependent system. But as our aim is to recognise in real time that goes ahead for a subject independent system.
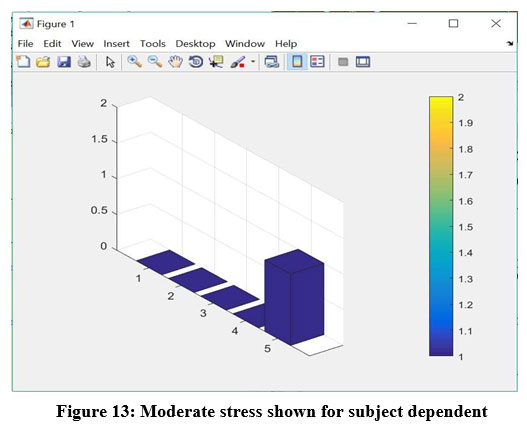 |
Figure 13: Moderate stress shown for subject dependent. |
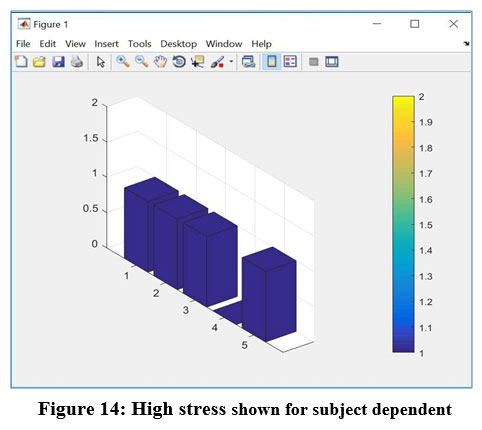 |
Figure 14: High stress shown for subject dependent. |
Subject Independent System
The second scenario is one where we have tested a subject independent system in real-time. Fig. 15 shows that captured signal corresponds to a moderate stress level, while Fig. 16 resembles high stress recognized. As you can see from the above figure, delta (x-axis 1) shows “0”, theta (x-axis 2), alpha (x-axis 3), beta (x-axis 4), also “0” and gamma (x-axis 5) shows “1”. So, we can comment that overall stress felt is low.
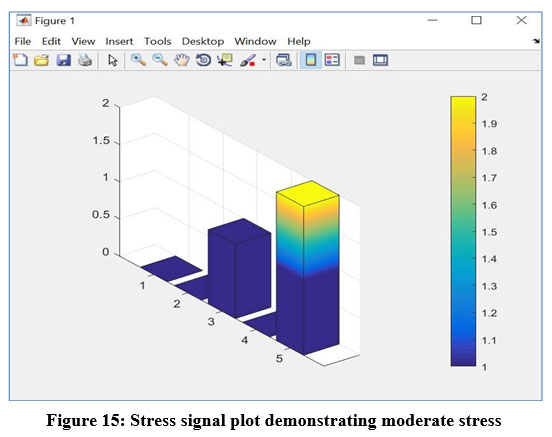 |
Figure 15: Stress signal plot demonstrating moderate stress. |
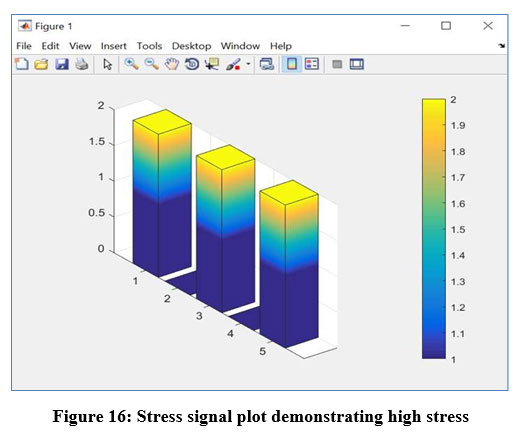 |
Figure 16: Stress signal plot demonstrating high stress. |
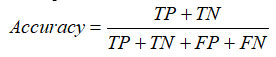
Reading above figure delta (x-axis 1), theta (x-axis 2) shows “0”, alpha (x-axis 3) shows “1”, beta (x-axis 4) as “0” and gamma (x-axis 5) shows “2”. Overall, we can comment that the stress felt is moderate. In the above figure, most of the bars are towards “2”, which corresponds to high stress. Overall, stress levels are high. The accuracy measured from the results obtained is about 72.3 %. Test signal are provided in real time and analysis is done and shown by the graph. The performance analysis is based on the confusion matrix parameters the results are assessed by accuracy.
Conclusion
The average accuracy for a subject dependent and independent model claimed in this research is 90% for dependent system and 72.3% for independent system. Also, the results are verified with the standard dataset collected from various sources, it seems the results which we have achieved are comparable and are up to the standard. From the analysis of the outcome of the proposed system, it has been concluded that the selection of appropriate features could increase the accuracy of the system. Also, the algorithm used with the concept of dependent and independent system suits best to enhance the accuracy.
The hardware used in this setup has a capability to remove the artifacts such as eye blink. In this research we have tried to classify different levels of stress using wavelet transform from EEG signal, we still feel there is scope to improve the accuracy of the system by adding other physiologic signal with EEG signal. Also, if few other features along with ECG, EOG can be added which can detect stress with more accuracy. The researcher those who want to extend the research in this area of stress recognition in future can use recent artificial intelligent techniques to improve the efficiency.
Acknowledgment
This research is supported by Lincoln University college Malaysia and JSPMs Rajarshi Shahu college of Engineering, Pune (India). These institute provided us a resources for completion of the research. We thank a research team of the Lincoln University college Malaysia for sharing their pearls of wisdom with us during the course of this research and also for comments that greatly improved the manuscript. We would also like to show our gratitude to the Dr. D. S. Bormane, Dr. S.D.Shirbahdurkar for their comments on an earlier version of the manuscript.
Conflict of interest
There is no conflict of interest.
Funding Sources
We did not receive any funding for the completion of the research work.
References
- X. Hou, Y. Liu, O. Sourina, Y. R. E. Tan, L. Wang and W. Mueller-Wittig, “EEG Based Stress Monitoring,” 2015 IEEE International Conference on Systems, Man, and Cybernetics, 2015.
CrossRef - Norizam Sulaiman, “Development of EEG-Based Stress Index,” 2012 International Conference on Biomedical Engineering (ICoBE),27-28 February 2012.
CrossRef - S.A. Hosseini, M. A. Khalilzadeh, M. B. Naghibi-Sistani, and V.Niazmand, “Higher Order Spectra Analysis of EEG Signals in Emotional Stress States,” in 2010 Second International Conference on nformation Technology and Computer Science (ITCS), 2010.
CrossRef - N. H. A. Hamid, N. Sulaiman, Z. H. Murat and M. N. Taib, “Brainwaves stress pattern based on perceived stress scale test,” 2015 IEEE 6th Control and System Graduate Research Colloquium (ICSGRC), 2015.
CrossRef - L. Xia, A. S. Malik, and A. R. Subhani, “A physiological signal based method for early mental-stress detection,” Biomedical Signal Processing and Control, vol. 46, pp. 18–32, 2018.
CrossRef - J. H. M. Tulen, P. Moleman, H. G. van Steenis, and F. Boomsma, “Characterization of stress reactions to the Stroop Colour Word Test,” Pharmacology Biochemistry and Behavior, vol. 32, pp. 9- 15, 1989.
CrossRef - Paithane A. N., and D. S. Bormane. “Electrocardiogram signal analysis using empirical mode decomposition and Hilbert spectrum.” Pervasive Computing (ICPC), 2015 International Conference on. IEEE, 2015.
CrossRef - C. Sheldon, T. Kamarck, and R. Mermelstein, “A Global Measure of Perceived Stress,” Journal of Health and Social Behavior, vol. 24, pp.385-396, 1983.
CrossRef - M. Rajya Lakshmi, T.V. Prasad, “Survey on EEG Signal Processing Methods”, International Journal of Advanced Research in Computer Science and Software Engineering, vol. 4, no. 1,pp. 84-91,2014.
- Chetan Umale “Feature Extraction Techniques and Classification Algorithms for EEG Signals to detect Human Stress – A Review”, International Journal of Computer Applications Technology and Research Volume 5– Issue 1, 08 – 14, 2016.
CrossRef - C.-K. A. Lim and W. C. Chia, “Analysis of Single-Electrode EEG Rhythms Using MATLAB to Elicit Correlation with Cognitive Stress,” International Journal of Computer Theory and Engineering, vol. 7, pp. 149-155, 2015.
CrossRef - C. Kirschbaum, K. M. Pirke, and D. H. Hellhammer, “The ‘Trier Social Stress Test’ – A Tool for Investigating Psychobiological Stress Responses in a Laboratory Setting,” Neuropsychobiology, vol. 28, pp. 76-81, 1993.
CrossRef - L. Schwabe, L. Haddad, and H. Schachinger, “HPA axis activation by a socially evaluated coldpressor test,” Psychoneuro endocrinology, vol.33, pp. 890-895, 2008.
CrossRef - C. H. Poh, T. Hershcovici, A. Gasiorowska, T. Navarro-Rodriguez, M.R. Willis, J. Powers, et al., “The effect of antireflux treatment on patientswith gastroesophageal reflux disease undergoing amental arithmeticstressor,” Neurogastroenterology& Motility, vol. 23, pp. e489-e496,2011.
CrossRef - Emil Šiška, “The stroop colour-word test in psychology and biomedicine”, Acta Univ. Palacki. Olomuc., Gymn., vol. 32, pp. 45-50, 2002.
- Paithane A. N., D. S. Bormane, and Ujwala Patil. “Novel Algorithm for Feature Extraction and Feature Selection from Electrocardiogram Signal.” International Journal of Computer Applications 134.9 (2016).
CrossRef - R. Khosrowabadi, Q. Chai, A. Kai Keng, T. Sau Wai, and M. Heijnen, “A Brain-Computer Interface for classifying EEG correlates of chronic mental stress,” in International Joint Conference on Neural Networks (IJCNN), pp. 757-762, 2011.
CrossRef - Ahmad Rauf Subhani “EEG Signals to Measure Mental Stress”, Center for Intelligent Signal and Imaging Research.
- M. Teplan, “Fundamentals of EEG measurement”, Measurement Science Review, Volume 2, Section 2, 2002.
- Noppadon Jatupaiboon, Setha Pan-ngum and Pasin Israsena, “Real-Time EEG-Based Happiness Detection System”, Scientific world journal 2013; 2013: 618649.
CrossRef - L. Schwabe, L. Haddad, and H. Schachinger, “HPA axis activation by a socially evaluated coldpressor test,” Psychoneuroendocrinology, vol. 33, pp. 890-895, 2008.
CrossRef - T. K. Calibo, J. A. Blanco, and S. L. Firebaugh, “Cognitive stress recognition,” in IEEE International Instrumentation and Measurement Technology Conference (I2MTC), pp. 1471-1475, 2013.
CrossRef - C. Kirschbaum, K. M. Pirke, and D. H. Hellhammer, “The ‘Trier Social Stress Test’ – A Tool for Investigating Psychobiological Stress Responses in a Laboratory Setting,” Neuropsychobiology, vol. 28, pp. 76-81, 1993.
CrossRef - S. Lotfan, S. Shahyad, R. Khosrowabadi, A. Mohammadi, and B. Hatef, “Support vector machine classification of brain states exposed to social stress test using EEG-based brain network measures,” Biocybernetics and Biomedical Engineering, vol. 39, no. 1, pp. 199–213, 2019.
CrossRef - J. Blanco, A. Vanleer, T. Calibo, and S. Firebaugh, “Single-trial cognitive stress classification using portable wireless electroencephalography,” Sensors, vol. 19, no. 3, p. 499, 2019.
CrossRef - Sutharsan, V., Swaminathan, A., Ramachandran, S., Lakshmanan, M.K., Mahadevan, B. “Electroencephalogram Signal Processing with Independent Component Analysis and Cognitive Stress Classification Using Convolutional Neural Networks” (2022) Lecture Notes in Networks and Systems, 341, pp. 275-292.
CrossRef - Vaghefi, M., Nasrabadi, A., Hashemi Golpayegani, S., Mohammadi, M., Gharibzadeh, S. “Nonlinear analysis of electroencephalogram signals while listening to the holy Quran” (2019) Journal of Medical Signals and Sensors, 9 (2), pp. 100-110.
CrossRef - Billones, R.K.C., Bedruz, R.A.R., Caguicla, S.M.D., Ilagan, K.M.S., Monsale, K.R.C., Santos, A.G.G., Valenzuela, I.C., Villanueva, J.P., Dadios, E.P. “Cardiac and brain activity correlation analysis using electrocardiogram and electroencephalogram signals”, IEEE 10th International Conference on Humanoid, Nanotechnology, Information Technology, Communication and Control, Environment and Management, HNICEM 2018.
CrossRef - Mafi, M., Hosseini, M.A. “Optimization of PTSD disorder detection based on nonlinear dynamic analysis of electroencephalogram signals”, (2019) Revista Latinoamericana de Hipertension, 14 (3), pp. 320-324.
- Berbano, A.E.U., Pengson, H.N.V., Razon, C.G.V., Tungcul, K.C.G., Prado, S.V. “Classification of stress into emotional, mental, physical and no stress using electroencephalogram signal analysis”, (2017) Proceedings of the 2017 IEEE International Conference on Signal and Image Processing Applications, ICSIPA 2017, pp. 11-14.
CrossRef - Al-Kadi, M.I., Reaz, M.B.I., Mohd Ali, M.A. “Evolution of electroencephalogram signal analysis techniques during anesthesia”, (2013) Sensors (Switzerland), 13 (5), pp. 6605-6635.
CrossRef - Gruner, P., Otto, E., Pietschmann, M. “Activation-dependent characteristics of the electroencephalogram during visual information processing: (1978) Activitas Nervosa Superior, 20 (4), pp. 302-311.

