
Manuscript accepted on :19-08-2022
Published online on: 08-09-2022
Plagiarism Check: Yes
Reviewed by: Dr. A Rawashdeh
Second Review by: Dr. Salah Said
Final Approval by: Dr. H Fai Poon
Salah Eldin Omar Hussein , Abd elgadir Alamin Altoum, Marwan Ismail, Asaad Mohammed Ahmed Babker and Ayman Hussien Alfeel
Department of Medical Laboratory Sciences, College of Health Sciences, Gulf Medical University, Ajman, UAE.
Corresponding Author E-mail: dr.salaheldin@gmu.ac.ae
DOI : https://dx.doi.org/10.13005/bpj/2474
Abstract
Background and aim: Obesity is one of the main factors that lead to development of type 2 diabetes mellitus (T2DM), with the prevalence of both increasing worldwide. Obesity is a modifiable risk factor related with many complications and comorbidities. This study aims to evaluate the level of Resistine, Fasting Blood Glucose and Adiponectin compare with the BMI in Insulin Resistance females with Type2 diabetes. Methods: A descriptive cross-sectional - case-control study, the target population is a total 205 Sudanese females were recruited to participate in this study, aged 35-64 years, venous blood samples were collected. Plasma levels of blood glucose were measured using the particle-enhanced immunoturbidimetric assay method Cobas C-311®.While Adiponectin and Resistine estimated by ELISA Kits. Anthropometric measurements, including height and weight, were taken using standard protocols. BMI was calculated as weight (in kilograms) divided by height (in meters squared). Results: Observed from these results significant difference between the means of fasting blood glucose (FBG), adiponectin, esistine and BMI compared with different group classified according to WHO body mass index (BMI) Classification. FBG in underweight (125 ± 15.9), FBG in healthy weight (127 ± 16.7),FBG in overweight (153 ± 19.2) , FBG in obesity (169 ± 20.7), FBG in sever obesity(189 ± 23.7),, P = 0.037, adiponectin in underweight (12.3 ± 1.1),adiponectin in healthy weight (11.2 ± 1.9), adiponectin in overweight (9.7 ± 1.6), adiponectin in obesity (6.1 ±1.5),adiponectin in sever obesity (6.8 ± 1.9), P = 0.043, resistine in underweight (11.6 ± 1.9) , resistine in healthy weight (12.8 ± 1.1), resistine in overweight (14.2 ± 2.7) resistine in obesity (18.2 ± 2.9), resistine in sever obesity (19.1 ± 3.4) , P = 0.021, BMI in underweight(16.5 ± 1.9), BMI in healthy weight (18.3 ± 1.7),BMI in overweight (26.1 ± 2.2),BMI in obesity (30.4 ± 3.7),BMI in sever obesity (40.1 ± 4.0), P = 0.006). In this study, the results show strong negative Correlation between the levels of serum Adiponectin and Fasting Blood Glucose. (P.value = 0.013, r = -7.9), Adiponectin and Resistine. (P.value = 0.019, r = -6.6). In the other side strong positive Correlation between the levels of serum Resistine and Fasting Blood Glucose. (P.value = 0.015, r = 6.0). Observed from this results negative Relationship between the mean of BMI compared with the history of the patient/ years. Conclusion: This study concluded that BMI effected on Adipocytokines levels and Increased risk of insulin resistance in females with Type2 diabetes by increased the level of resistine, fasting blood glucose and reduced of adiponectin in different groups classified according to WHO body mass index (BMI) Classification.
Keywords
Adipocytokines; Adiponectin; BMI; Insulin Resistance; Resistine
Download this article as:| Copy the following to cite this article: Hussein S. E. O, Altoum A. E. A, Ismail M, Babker A. M. A, Alfeel A. H. Circulating Markers of Adipocytokines levels and BMI in Insulin Resistance Females with Type2 diabetes. Biomed Pharmacol J 2022;15(3). |
| Copy the following to cite this URL: Hussein S. E. O, Altoum A. E. A, Ismail M, Babker A. M. A, Alfeel A. H. Circulating Markers of Adipocytokines levels and BMI in Insulin Resistance Females with Type2 diabetes. Biomed Pharmacol J 2022;15(3). Available from: https://bit.ly/3RsMq6N |
Introduction
Obesity has emerged as a public health crisis in many populations including Sudanese. Adipose tissue produces several adipokines, one of them is adiponectin which has attracted much attention because of its antidiabetic and antiatherogenic effects. Adipose tissue is a key endocrine organ that communicates with brain, muscle, liver, and pancreas, thereby maintaining energy homeostasis. The communication between adipose tissue and other organs is mainly mediated by multiple endocrine substances secreted by adipose tissue, referred to as “adipocytokines 1. Changes in the levels of adipocytokines are suspected to be indicators of dysfunction in adipose tissue 2,3. Adiponectin 4 and resistine 5 hormones are thought to link with obesity and MS with cardiovascular risk. Adipose tissue is no longer considered an inactive organ, which only stores lipids and serves as an energy reservoir. These chemical messengers, known as ‘adipocytokines’ or ‘adipokines’, include tumor necrosis factor α (TNF-α), adiponectin, leptin, resistine and virstatin 6. Adiponectin is an adipocyte-secreted polypeptide hormone with molecular weight 30 kDa (244 amino acids) which modulates several metabolic processes, and regulates insulin sensitivity and energy homeostasis, as well as glucose and lipid metabolism 7. The hormone plays a principal role in the suppression of the metabolic derangements that may result in insulin resistance, obesity, MS, and cardiovascular disease 5, 7, 8. Adiponectin is a protective protein with antidiabetic, anti-inflammatory and anti-atherogenic effects 6. Reduced plasma adiponectin levels have been reported in obese individuals, particularly in those with visceral obesity, and have been negatively correlated with insulin resistance. Recent evidence has also suggested the role of adiponectin in the regulation of insulin action, energy homeostasis, obesity, and insulin resistance. Circulating adiponectin levels and adiponectin gene expression in adipose tissue are reduced in patients with type 2 diabetes 9–10. Available data suggest that adiponectin might reduce hepatic glucose production and increase muscle glucose utilization, perhaps by increasing fat oxidation and thereby reducing circulating NEFA levels and intramyocellular accumulation 11. Studies of adipocytokines in populations with different propensity for obesity, insulin resistance, type 2 diabetes and atherosclerosis are needed, and are interesting in this respect, because they have very high incidence of insulin resistance, central obesity, type 2 diabetes, and cardiovascular disease 12–13. In a previous study by Valsmakis et al 14, South-Asians have lower adiponectin levels compared to Caucasians. It was not clear however, if this feature of the South-Asians is related to aspects of glucose metabolism. No published data have been found related to adipocytokines, resistine and obesity in Sudanese population This study aims to determine the relationship between body fat distribution and adipocytokines.
Materials and methods
In this is a descriptive cross-sectional and analytical case-control study. The study was done in Khartoum state. The target population is a total 205 Sudanese females were recruited to participate in this study, classified according to WHO body mass index (BMI) Classification, aged 20-50 years. The sample size calculations were based on the formula for unmatched case-control studies. Open EPI-INFO statistical package version 7 was used with 99 % two-sided confidence level, 80% power and 40 % of controls exposed, 57 % of cases exposed and odds ratio > 2. The ratio of controls to cases is 1:1. Venous blood sample (5 ml) was drawn by a well-trained medical technologist into vacutainer tubes, blood collected in anticoagulant fluoride oxalate and then plasma samples were obtained by centrifugation at room temperature at 3000 rpm/10 minutes. BMI was obtained by anthropometric measurements, including height and weight, were taken using standard protocols. BMI was calculated as weight (in kilograms) divided by height (in meters squared).
Estimation of Fasting Blood Glucose
Plasma levels of blood glucose were measured using the particle-enhanced immunoturbidimetric assay method Cobas C-311®. Human glucose agglutinates with latex particles coated with monoclonal anti-glucose antibodies, and then, the precipitate was determined turbidimetrically.
Estimation Adiponectin and Resistine
For Adiponectin and Resistine used ELISA Kits-(ab222508)/ (ab222403) is a single-wash 90 min sandwich ELISA designed for the quantitative measurement of Adiponectin and Resistine in plasma. Simple step ELISA® technology employs capture antibodies conjugated to an affinity tag that is recognized by the monoclonal antibody used to coat our Simple step ELISA® plates.15
Statistical analysis
Finally, the result analyzed by SPSS version 24. The mean and SD were obtained, and one way ANOVA are used for comparison. Linear regression was also use for correlation. P. value was obtained to assess the significance of the results (P value of < 0.05 was significant).
Result
The study done on 105 Females Diabetic Patient Type2 with different body mass index BMI (Underweight, Healthy weight Overweight, Obesity, Sever obesity) table (1,2). Used statistical analysis test one away ANOVA to determine the mean difference between different groups (Underweight, Healthy weight Overweight, Obesity, Sever obesity), observed from this means significant difference between the means of fasting blood glucose (FBG), adiponectin, resistine and BMI compare with underweight, healthy weight, overweight, obesity and sever obesity respectively. FBG in underweight (125 ± 15.9), FBG in healthy weight (127 ± 16.7),FBG in overweight (153 ± 19.2) , FBG in obesity (169 ± 20.7), FBG in sever obesity(189 ± 23.7),, P = 0.037, adiponectin in underweight (12.3 ± 1.1),adiponectin in healthy weight (11.2 ± 1.9), adiponectin in overweight (9.7 ± 1.6), adiponectin in obesity (6.1 ±1.5),adiponectin in sever obesity (6.8 ± 1.9), P = 0.043, resistine in underweight (11.6 ± 1.9) , resistine in healthy weight (12.8 ± 1.1), resistine in overweight (14.2 ± 2.7) resistine in obesity (18.2 ± 2.9), resistine in sever obesity (19.1 ± 3.4) , P = 0.021, BMI in underweight(16.5 ± 1.9), BMI in healthy weight (18.3 ± 1.7),BMI in overweight (26.1 ± 2.2),BMI in obesity (30.4 ± 3.7),BMI in sever obesity (40.1 ± 4.0), P = 0.006) table (3). Person T test was used for correlation, the statistical analysis shows strong negative Correlation between the levels of serum Adiponectin versus Fasting Blood Glucose and Resistine. (Adiponectin versus FBG: P.value = 0.013, r = -7.9). (Adiponectin versus Resistine: P.value = 0.019, r = -6.6) figure (1) and figure (3). In the other side of hand shows moderate positive Correlation between the levels of serum Resistine and Fasting Blood Glucose. (P.valu = 0.015, r = 6.0) figure (2). Observed from this results negative Relationship between the mean of BMI compare with the history of the patient/ year’s figure (4).
Table 1: Number of diabetic female’s patients according to WHO body mass index (BMI) Classification.
| Categories Based on BMI | Body Mass Index BMI-Kg/m2 | Number of Diabetic Female | % Of Diabetic Female |
| Under weight | < 18.5 | 9 | 4% |
| Healthy weight | 18.5 – 24.9 | 53 | 25% |
| Overweight | 25 – 29.9 | 107 | 52% |
| Obesity | 30 – 39.9 | 31 | 17% |
| Sever obesity | > 40 | 5 | 2% |
Table 2: Sociodemographic of diabetic female’s patients’ participants.
|
Variable |
Age / Year | Body Mass Index -Kg/m2 | Duration of diabetic / years | |||
| Range | (mean ± SD) | Range | (mean ± SD) | Range | (mean ± SD) | |
| Under weight | 38– 60 | (48.7 ± 5.8) | 17.1– 18.3 | (16.5 ± 1.9) | 8 – 11 | (9.8 ± 1.7) |
| Healthy weight | 40 – 62 | (49.6 ± 6.2) | 19 – 24.9 | (18.3 ± 1.7) | 10 – 15 | (13.6 ± 3.5) |
| Overweight | 35 – 61 | (51 ± 6.6) | 25.2 – 28.8 | (26.1 ± 2.2) | 11 – 14 | (11.1 ± 2.4) |
| Obesity | 43 – 62 | (50 ± 6.4) | 30.1 – 33.7 | (30.4 ± 3.7) | 7 – 13 | (12.0 ± 2.9) |
| Sever obesity | 40– 64 | (49.4 ± 6.1) | 40.7– 40.9 | (40.1 ± 4.0) | 6 – 11 | (10.1 ± 1.8) |
Table 3: Comparison between means of the biochemical parameter according to the BMI.
|
Variable |
FBG- mg/dl | Adiponectin- U/L | Resistine – U/L
|
BMI- kg/m2 | ||||
| (mean ± SD) | P. Value | (mean ± SD) | P. Value | (mean ± SD) | P. Value | (mean ± SD) | P. Value | |
| Under weight
Range |
(125 ± 15.9)
125 – 137 |
0.037 | (12.3 ± 1.1)
8.8 – 15 |
0.043 | (11.6 ± 1.9)
10 – 19.1 |
0.021 | (16.5 ± 1.9)
17.1– 18.3 |
0.006 |
| Healthy weight
Range |
(127 ± 16.7)
137 – 154 |
(11.2 ± 1.9)
9.8 – 15 |
(12.8 ± 1.1)
11 – 17.8 |
(18.3 ± 1.7)
19 – 24.9 |
||||
| Overweight
Range |
(153 ± 19.2)
149 – 167 |
(9.7 ± 1.6)
6.8 – 10.5 |
(14.2 ± 2.7)
17.4 – 27 |
(26.1 ± 2.2)
25.2 – 28.8 |
||||
| Obesity
Range |
(169 ± 20.7)
178 – 244 |
(6.1 ± 1.5)
5.1- 7.3 |
(18.2 ± 2.9)
16.4 – 29 |
(30.4 ± 3.7)
30.1 – 33.7 |
||||
| Sever obesity
Range |
(189 ± 23.7)
171 – 244 |
(6.8 ± 1.9)
7.1- 8.3 |
(19.1 ± 3.4)
18.4 – 33 |
(40.1 ± 4.0)
40.7– 40.9 |
||||
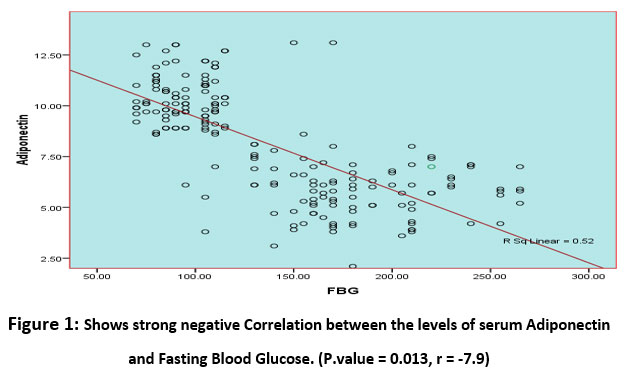 |
Figure1: Shows strong negative Correlation between the levels of serum Adiponectin and Fasting Blood Glucose. (P.value = 0.013, r = -7.9). |
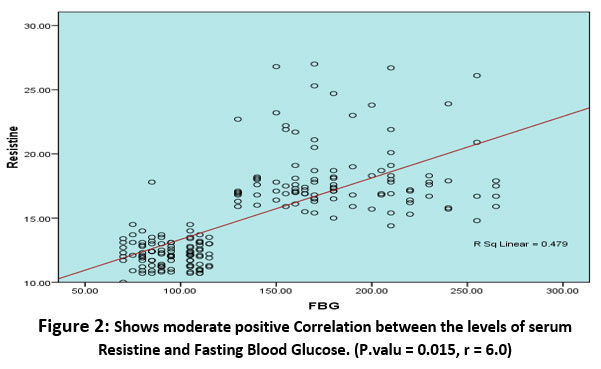 |
Figure 2: Shows moderate positive Correlation between the levels of serum Resistine and Fasting Blood Glucose. (P.valu = 0.015, r = 6.0). |
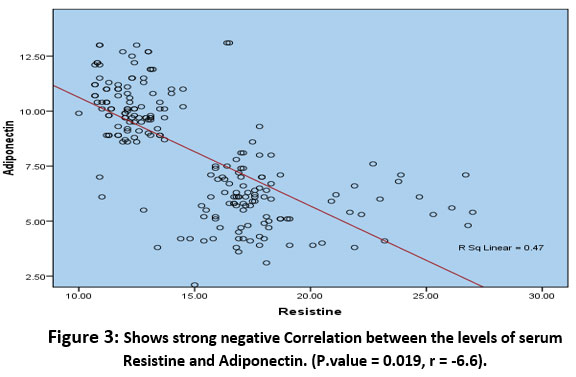 |
Figure 3: Shows strong negative Correlation between the levels of serum Resistine and Adiponectin. (P.value = 0.019, r = -6.6). |
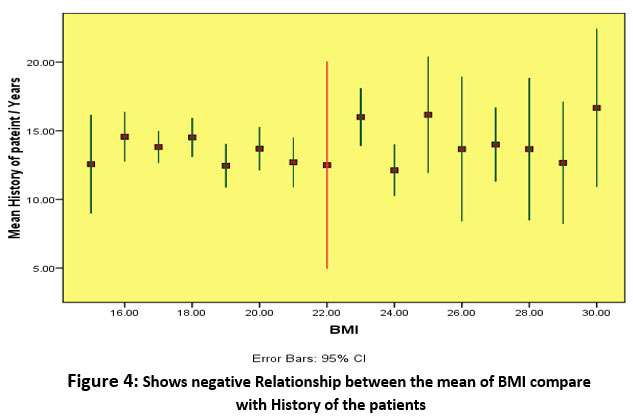 |
Figure 4: Shows negative Relationship between the mean of BMI compare with History of the patients |
Discussion
Obesity is a modifiable risk factor in the development of type 2 diabetes mellitus (T2DM), with the prevalence of both increasing worldwide 4 and the risks of many complications and comorbidities (e.g., cardiovascular disease and chronic kidney disease) are considerably increased in patients with T2DM who have concomitant obesity. through this study, we have shown that circulating adipocytokine concentrations differed based on the degree of obesity in females’ patients with diagnosed T2DM, we demonstrated that higher plasma concentrations of FBG, Resistine and lower plasma concentrations of adiponectin were present in patients diagnosed T2DM who were overweight, obese and sever obesity than in patients diagnosed T2DM who had underweighted and healthy weight. According to results of this study observed significant difference in resistine concentration was identified between patients with T2DM who had underweight, healthy weight and those who were overweight, obese and sever obesity. Foula WH et al found that resistine concentrations were higher in obese females patients with diabetes than non-obese females participants; moreover, they were higher in obese patients with diabetes than in non-obese healthy controls 1,5,7 .Observed from this study significant difference in adiponectin concentration was identified between patients with T2DM who had underweight, healthy weight and those who were overweight, obese and sever obesity Serum adiponectin concentrations have been shown to be inversely correlated with the severity of insulin resistance in patients with T2DM 3 consistent with the findings of previous studies 9,10 the present study showed that a lower level of adiponectin was present in patients with diagnosed T2DM who were obese than in those who had underweight and healthy weight BMI. Adiponectin is considered to have anti-diabetic and anti-inflammatory effects; therefore, it is reasonable to presume that patients with T2DM who obese exhibit more severe insulin resistance status are than patients with T2DM who have underweight and healthy weight BMI. Some of the studies have suggested that adiponectin/resistine ratios are more closely related to the severity of insulin resistance 11,12. It became clear through this study positive correlation between the levels of serum resistine and Fasting Blood Glucose. While on the other side of the study it was observed negatively correlation with these same parameters. In conclusion, serum resistin and adiponectin levels are correlated with the occurrence of insulin Resistance females T2DM 13,14.
Conclusion
Our findings suggest that, in patients diagnosed T2DM, adipocytokine concentrations (resistine, and adiponectin) differed between patients who had normal BMI and those who were obese. This study concluded that BMI effected on Adipocytokines levels and Increased risk of insulin resistance in females with Type2 diabetes by increased the level of Resistine, Fasting Blood Glucose and reduced of Adiponectin in different groups of BMI.
Acknowledgment
The authors would like to thank all the participants and researchers involved in this study. The authors would also like to thank Dr. Kamal Hussein from University of Bisha for his kind support with data analysis.
Conflict of Interest
There is no conflict of interest.
Funding Sources
There is no funding source.
References
- Foula WH, Emara RH, Eldeeb MK, Mokhtar SA, El-Sahn FA. Effect of a weight loss program on serum adiponectin and insulin resistance among overweight and obese premenopausal females. J Egypt Public Health Assoc. 2020 Dec 1;95(1):32. doi: 10.1186/s42506-020-00060-z. PMID: 33259020; PMCID: PMC7708549.
CrossRef - Chait A, den Hartigh LJ. Adipose Tissue Distribution, Inflammation and Its Metabolic Consequences, Including Diabetes and Cardiovascular Disease. Front Cardiovasc Med. 2020 Feb 25; 7:22. doi: 10.3389/fcvm.2020.00022. PMID: 32158768; PMCID: PMC7052117.
CrossRef - Zorena K, Jachimowicz-Duda O, Ślęzak D, Robakowska M, Mrugacz M. Adipokines and Obesity. Potential Link to Metabolic Disorders and Chronic Complications. Int J Mol Sci. 2020 May 18;21(10):3570. doi: 10.3390/ijms21103570. PMID: 32443588; PMCID: PMC7278967.
CrossRef - Wyskida K, Franik G, Wikarek T, Owczarek A, Delroba A, Chudek J, Sikora J, Olszanecka-Glinianowicz M. The levels of adipokines in relation to hormonal changes during the menstrual cycle in young, normal-weight women. Endocr Connect. 2017 Nov;6(8):892-900. doi: 10.1530/EC-17-0186. Epub 2017 Oct 27. PMID: 29079670; PMCID: PMC5704444.
CrossRef - Fuster JJ, Ouchi N, Gokce N, Walsh K. Obesity-Induced Changes in Adipose Tissue Microenvironment and Their Impact on Cardiovascular Disease. Circ Res. 2016 May 27;118(11):1786-807. doi: 10.1161/CIRCRESAHA.115.306885. PMID: 27230642; PMCID: PMC4887147.
CrossRef - Uslu S, Kebapçi N, Kara M, Bal C. Relationship between adipocytokines and cardiovascular risk factors in patients with type 2 diabetes mellitus. Exp Ther Med. 2012 Jul;4(1):113-120. doi: 10.3892/etm.2012.557. Epub 2012 Apr 23. PMID: 23060933; PMCID: PMC3460256.
CrossRef - Achari AE, Jain SK. Adiponectin, a Therapeutic Target for Obesity, Diabetes, and Endothelial Dysfunction. Int J Mol Sci. 2017 Jun 21;18(6):1321. doi: 10.3390/ijms18061321. PMID: 28635626; PMCID: PMC5486142.
CrossRef - Ormazabal V, Nair S, Elfeky O, Aguayo C, Salomon C, Zuñiga FA. Association between insulin resistance and the development of cardiovascular disease. Cardiovasc Diabetol. 2018 Aug 31;17(1):122. doi: 10.1186/s12933-018-0762-4. PMID: 30170598; PMCID: PMC6119242.
CrossRef - Esfahani M, Movahedian A, Baranchi M, Goodarzi MT. Adiponectin: an adipokine with protective features against metabolic syndrome. Iran J Basic Med Sci. 2015 May;18(5):430-42. PMID: 26124928; PMCID: PMC4475650.
- Ntzouvani A, Fragopoulou E, Panagiotakos D, Pitsavos C, Antonopoulou S. Reduced circulating adiponectin levels are associated with the metabolic syndrome independently of obesity, lipid indices and serum insulin levels: a cross-sectional study. Lipids Health Dis. 2016 Aug 27;15(1):140. doi: 10.1186/s12944-016-0311-7. PMID: 27567677; PMCID: PMC5002189.
CrossRef - Li, M., Chi, X., Wang, Y. et al. Trends in insulin resistance: insights into mechanisms and therapeutic strategy. Sig Transduct Target Ther 7, 216 (2022). https://doi.org/10.1038/s41392-022-01073-0
CrossRef - Ravindran Jaganathan, Rajeswari Ravindran, Sugapriya Dhanasekaran, Emerging Role of Adipocytokines in Type 2 Diabetes as Mediators of Insulin Resistance and Cardiovascular Disease, Canadian Journal of Diabetes, Volume 42, Issue 4, 2018, Pages 446-456.e1, ISSN 1499-2671, https://doi.org/10.1016/j.jcjd.2017.10.040.
CrossRef - Ormazabal V, Nair S, Elfeky O, Aguayo C, Salomon C, Zuñiga FA. Association between insulin resistance and the development of cardiovascular disease. Cardiovasc Diabetol. 2018 Aug 31;17(1):122. doi: 10.1186/s12933-018-0762-4. PMID: 30170598; PMCID: PMC6119242.
CrossRef - Wondmkun YT. Obesity, Insulin Resistance, and Type 2 Diabetes: Associations and Therapeutic Implications. Diabetes Metab Syndr Obes. 2020 Oct 9; 13:3611-3616. doi: 10.2147/DMSO.S275898. PMID: 33116712; PMCID: PMC7553667.
CrossRef - Hussein SEO, Altoum AEA, Osman AL, Higazi HMKI, Ali S, Alfeel AH. Influence of BMI on Serum Adiponectin, Resistine, and FBG among Overweight and Obese Females Diabetic Patient Type2. Open Access Maced J Med Sci. 2022. 2022 Jul. 21];10(B):1218-21.
CrossRef

