
Manuscript accepted on :06-06-2022
Published online on: 22-06-2022
Plagiarism Check: Yes
Reviewed by: Dr. Nicolas Padilla, Dr. Sreedhar D
Second Review by: Dr. Ana Golez
Final Approval by: Dr Eman Refaat Youness
Zainab Saad Abdulrahman1* , Mohammed Qasim Alatrakji2, Ahmed Abood Al-Maliky3, Khalid Ibrahim Hussein3 and Saad Abdulrahman Hussain4
1Department of Clinical Pharmacy, Al-Kindy Teaching Hospital, Baghdad, Iraq.
2Department of Pharmacology, College of Medicine, University of Baghdad, Baghdad, Iraq.
3Specialized Center of Diabetes and Endocrinology, Al-Rusafa, Baghdad, Iraq.
4Faculty of Pharmacy, Al-Rafidain University College, Baghdad 10052, Iraq.
Corresponding Author E-mail: zainabalzadi1988@gmail.com
DOI : https://dx.doi.org/10.13005/bpj/2441
Abstract
Numerous variables, including age, gender, physical inactivity, inadequate dose, noncompliance, and drug-drug interactions, may lead to substantial intraindividual variability in metformin (Met) response. This study aimed to determine how dosages and duration of metformin affected glycemic control and insulin levels in Iraqi patients with T2DM. A total of 153 T2DM patients with a disease duration of more than one year participated in a cross-sectional study at the Diabetes and Endocrinology Center, Baghdad from October 2021 to March 2022. As part of the study method, the patients were evaluated clinically and physically, and their body weight, waist circumference, and body mass index (BMI) were measured. Glycated hemoglobin (HbA1c), fasting glucose (FSG), insulin, creatinine, and C-reactive protein (CRP) levels were evaluated. After data correction for Met doses and length of treatment, FSG, HbA1c, insulin, creatinine, and CRP levels were not substantially different (P > 0.05) among groups taking different doses of Met for different periods. According to Pearson's correlation analysis, there was no significant relationship between Met doses and treatment duration and glycemic control or insulin levels. In conclusion, Met dose and treatment duration were not significantly correlated to glycemic control or serum insulin levels, which could be attributed to other factors.
Keywords
Fasting Serum Glucose; Glycated Hemoglobin; Insulin Level; Metformin Dose; Type 2 Diabetes.
Download this article as:| Copy the following to cite this article: Abdulrahman Z. A, Alatrakji M. Q, Al-Maliky A. A, Hussein K. I, Hussain S. A. The Association of Metformin Doses and Length of Treatment with Glycemic Control and Serum Insulin Levels in Iraqi Patients with Type-2 Diabetes Mellitus. Biomed Pharmacol J 2022;15(2). |
| Copy the following to cite this URL: Abdulrahman Z. A, Alatrakji M. Q, Al-Maliky A. A, Hussein K. I, Hussain S. A. The Association of Metformin Doses and Length of Treatment with Glycemic Control and Serum Insulin Levels in Iraqi Patients with Type-2 Diabetes Mellitus. Biomed Pharmacol J 2022;15(2). Available from: https://bit.ly/3yd0nyM |
Introduction
Metformin is a biguanide derivative that can lower HbA1c and reduce fasting and postprandial hyperglycemia in type 2 diabetic patients (T2DM). A rise in insulin sensitivity and insulin-mediated glucose consumption is what causes it to be hypoglycemic.1 Furthermore, it boosts glucose utilization in non-insulin-dependent tissues like the brain, blood cells, renal medulla, gut, and skin. It also inhibits gluconeogenesis in the liver and prevents glucose uptake by intestinal wall cells.2 The American Diabetes Association (ADA) and the European Association for the Study of Diabetes (EASD) still suggest metformin as the first-line medication for people with T2DM, along with diet and exercise.3,4 Metformin has a number of clinical advantages, including considerable antihyperglycemic effects, good tolerance, and a minimal risk of hypoglycemia.5,6 Furthermore, the beneficial effects of this drug on the cardiovascular system and modifiable cardiovascular risk factors (obesity, insulin resistance (IR), hyperglycemia, hyperinsulinemia, and dyslipidemia) have been demonstrated in numerous clinical studies and meta-analyses and are particularly important to consider.7,8 The most recent ADA 2020 Standards of Care reaffirmed his view on the commencement of medication in T2DM, stating that metformin along with lifestyle changes should be continued as long as they are tolerated and not contraindicated.4 Long-term clinical experience, supported by several clinical studies, clearly shows that a significant number of T2DM patients using metformin alone do not attain the target glycemic control.9 A large body of clinical data revealed significant disparities in metformin use and clinical response, with 35% of patients failing to achieve optimal glycemic control with metformin alone.9,10 Meanwhile, a number of factors modify the metformin pharmacokinetics and thus the hypoglycemic response.11 Numerous factors, including age, gender, physical inactivity, insufficient dose, non-adherence, drug-drug interactions, and metformin interaction with microbiota, might predispose to significant intraindividual heterogeneity in metformin response.12,13 The present study was designed to evaluate the association of metformin up-titrating doses and length of treatment with glycemic control and serum insulin levels in Iraqi patients with T2DM.
Materials and Methods
Study design and patient selection
From October 2021 to March 2022, 198 patients with a history of T2DM who had been visiting the Diabetes and Endocrinology Center in Baghdad for routine care were examined for eligibility to participate in the study. After receiving written agreement, one hundred and sixty patients who met the inclusion criteria were chosen to participate in this cross-sectional study. Only 153 patients (Figure 1), with an average age of 55.72±8.1 years, were able to finish the study. All of the patients had been diagnosed with T2DM using WHO criteria14 and are already using a metformin-based treatment that include sulfonylureas or DPP-4 inhibitors. T2DM patients with a disease duration of more than one year who were treated with a metformin (various doses)-based protocol and were between the ages of 30-70 years were included in the trial. A few of the individuals had already been administered various medications for other comorbidities, such as ACE inhibitors, angiotensin-converting enzyme inhibitors, aspirin, and calcium channel blockers. Patients with T1DM, cancer patients on chemotherapy or radiotherapy, insulin users, previous history of renal failure, autoimmune and hepatic diseases, major chronic disorders, and pregnancy are all excluded. According to the study protocol, all participants were clinically evaluated and information regarding their medical history, demographic data, and medication history was collected.
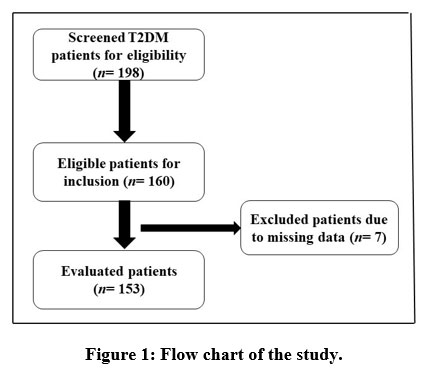 |
Figure 1: Flow chart of the study. |
Ethical consideration
The study protocol was revised and approved by the local Research Ethics Committee of the College of Medicine, University of Baghdad (REC-1417 Nov. 2021) and the Clinical Research Ethics Committee of the Iraqi Ministry of Health. All procedures were performed in accordance with the principles of the Helsinki Declaration, 2013.15 All the enrolled patients provided written informed consent to participate in this pilot study.
Outcome measurements
The patients underwent a comprehensive clinical and physical evaluation as part of the study procedure, and their body weight, waist circumference, and body mass index (BMI) were all measured. Blood samples (10 ml) were taken from all patients via venipuncture after a 12-hour fast. Approximately 2.0 mL of blood was retained in EDTA-containing tubes for colorimetric measurement of glycated hemoglobin (HbA1c) (Roche-Cobas C 311; Roche Diagnostics GmbH, Mannheim, Germany). The remaining 8.0 ml was maintained in plain tubes to clot before being centrifuged at 300 g for 20 minutes to extract the serum. The serum was either tested right away or kept for subsequent use at -20°C. The serum levels of fasting glucose (FSG), insulin, creatinine, and C-reactive protein (CRP) were measured using standardized techniques.
Statistical analysis
GraphPad Prism 8.4.3 was used to analyze the results statistically (GraphPad Software Inc., La Jolla, CA, USA). The means and standard deviations of continuous variables were provided. Numbers and percentages were used to represent discrete variables. The significance of the difference between the means of independent samples was determined using one-way analysis of variance (ANOVA), which was confirmed by Bonferroni post hoc analysis. The relationship between metformin dose and duration and glycemic status was investigated using a Pearson correlation analysis. Statistical significance was determined by P values less than 0.05.
Results
In the selected sample of patients, Table 1 indicates an equal distribution of males and females with a mean of 55.7±8.1 years. The disease was reported to have lasted 9.3±6.5 years, and the Met-based regimen was administered for 7.1±6.5 years. The majority of individuals (45.1%) used 1000-1500 mg/day of Met, with 38.6% taking less than 1000 mg/day and 16.3% taking more than 1500 mg/day. Table 1 further shows that 53.6% of the patients included have been following the Met-based treatment for 1–5 years. The patients had insufficient glycemic and body weight control, with a HbA1c score of 9.13±2.5% and a BMI of 30.14±5.3 kg/m2. Meanwhile, the data in Table 1 demonstrated that the majority of the participants (41.2%) had erratic dietary control and a moderate pattern of treatment protocol adherence. Table 2 demonstrates that glycemic control markers (FSG and HbA1c) were not significantly different (P > 0.05) among the groups taking different dose levels of Met after data correction according to Met dose levels. Similarly, no significant variations in insulin, creatinine, or CRP serum levels were found in patients taking different Met dose levels (P > 0.05). However, based on ANOVA and post hoc analysis, BMI values were statistically different, with a 10.3% rise in the BMI value observed in the group of patients taking > 1500 mg/day of metformin (P > 0.05). After data adjustment for the duration of Met administration, Table 3 shows that glycemic control indices (FSG and HbA1c) were not statistically different (P > 0.05) among the groups taking Met for different periods. Furthermore, no significant changes in insulin, creatinine, CRP serum levels, or BMI were seen in patients who took Met for varying lengths of time (P > 0.05). By analyzing the association between the glycemic control indicators (FSG and HbA1c) and the serum insulin levels of the participants with the Met doses, there was a weak negative and non-significant correlation with FSG levels (r = -0.075, P = 0.351), a weak positive and non-significant correlation with HbA1c values (r = 0.072, P = 0.37), and a weak negative and non-significant correlation with the serum levels of insulin (r = -0.039, P = 0.63) (Figure 2). In Figure 3, assessment of the association between the duration of using Met with the glycemic state indicators (FSG and HbA1c) and serum insulin levels revealed a weak and non-significant association according to Pearson’s correlation analysis (r = 0. 0.0723, 0.1289, and 0.0596, respectively; P = 0.364, 0.364, and 0.457, respectively).
Table 1: Characteristics of the participants (n= 153).
| Parameter | Results |
| Gender n(%) | |
| Male | 76 (49.7) |
| Female | 77 (50.3) |
| Age (year) | 55.72±8.1 (34-73) |
| Disease duration (year) | 9.31±6.5 (1.0-31) |
| Metformin dose (mg/day) | 1078±576.8 (500-3000) |
| <1000 mg/day | 59 (38.6) |
| 1000-1500 mg/day | 69 (45.1) |
| > 1500 mg/day | 25 (16.3) |
| Duration of Met treatment (year) | 7.1±5.6 (1.0-31) |
| 1-5 years | 82 (53.6) |
| 6-10 years | 41 (26.8) |
| > 10 years | 30 (19.6) |
| Body weight (kg) | 80.7±14.3 (52-130) |
| HbA1c (%) | 9.13±2.4 (5-15) |
| BMI (kg/m2) | 30.14±5.3 (20.1-46.6) |
| Blood pressure (mmHg) | |
| SBP | 13.7±2.1 (10-20) |
| DBP | 8.62±1.2 (5-12) |
| Dietary control n(%) | |
| Free | 40 (26.1) |
| Conservative | 50 (32.7) |
| Fluctuated | 63 (41.2) |
| Compliance with treatment n(%) | |
| Good | 35 (22.9) |
| Moderate | 63 (41.2) |
| Poor | 55 (35.9) |
| Add-on drug with Met n(%) | |
| Sulfonylurea | 115 (75.2) |
| DPP-4 inhibitors | 28 (18.3) |
| Metformin only | 10 (6.5) |
| Comorbidities | |
| Hypertension | 77 (50.3) |
| IHD | 28 (18.3) |
| Thyroid disorders | 30 (19.6) |
Values are expressed as mean±SD, numbers and percentages and ranges. n: number of patients; HbA1c: glycated hemoglobin; BMI: body mass index; SBP: systolic blood pressure; DBP: diastolic blood pressure.
Table 2: Effects of different metformin doses on the glycemic control, renal function and BMI of Iraqi patients with T2DM (n=153).
| Variables | Metformin doses (mg/day) | P-value
(ANOVA) |
||
| < 1000 (n=59) | 1000-1500 (n=69) | > 1500 (n=25) | ||
| FSG (mg/dl) | 201.9±70.5a | 200.9±80.5a | 197.0±71.5a | 0.96 |
| HbA1c (%) | 9.1±2.5a | 8.9±2.2a | 9.9±2.5a | 0.175 |
| Serum insulin (ng/ml) | 18.1±15.04a | 19.3±25.5a | 17.0±11.6a | 0.861 |
| Serum creatinine (mg/dl) | 0.75±0.19a | 0.75±0.16a | 0.76±0.19a | 0.992 |
| CRP (mg/dl) | 5.6±7.3a | 7.3±12.1a | 7.2±10.5a | 0.615 |
| BMI (kg/m2) | 29.6±4.8a | 29.6±5.3a | 32.6±5.9b | 0.024 |
Values are presented as mean±SD; n: number of patients; FSG: fasting serum glucose; HbA1c: glycated hemoglobin; CRP: C-reactive protein; BMI: body mass index; values with non-identical superscripts (a,b) are significantly different within the same parameter (P<0.05).
Table 3: Effects of metformin use duration on the glycemic control, renal function and BMI of Iraqi patients with T2DM (n=153).
| Variables | Duration of using Metformin (year) | P-value
(ANOVA) |
||
| 1-5 years (n=82) | 6-10 years (n=41) | > 10 years (n=30) | ||
| FSG (mg/dl) | 198.7±79.6a | 194.4±51.8a | 214.1±87.0a | 0.508 |
| HbA1c (%) | 8.9±2.5a | 9.4±2.1a | 9.5±2.5a | 0.368 |
| S. insulin (ng/ml) | 18.3±17.8a | 18.3±25.5a | 19.1±17.2a | 0.98 |
| S. creatinine (mg/dl) | 0.76±0.19a | 0.74±0.17a | 0.75±0.15a | 0.839 |
| CRP (mg/dl) | 7.3±12.1a | 5.34±4.7a | 6.57±10.1a | 0.604 |
| BMI (kg/m2) | 30.7±5.5a | 30.5±5.1a | 28.2±4.9a | 0.066 |
Values are presented as mean±SD; n: number of patients; FSG: fasting serum glucose; HbA1c: glycated hemoglobin; CRP: C-reactive protein; BMI: body mass index; values with non-identical superscripts (a,b) are significantly different within the same parameter (P<0.05).
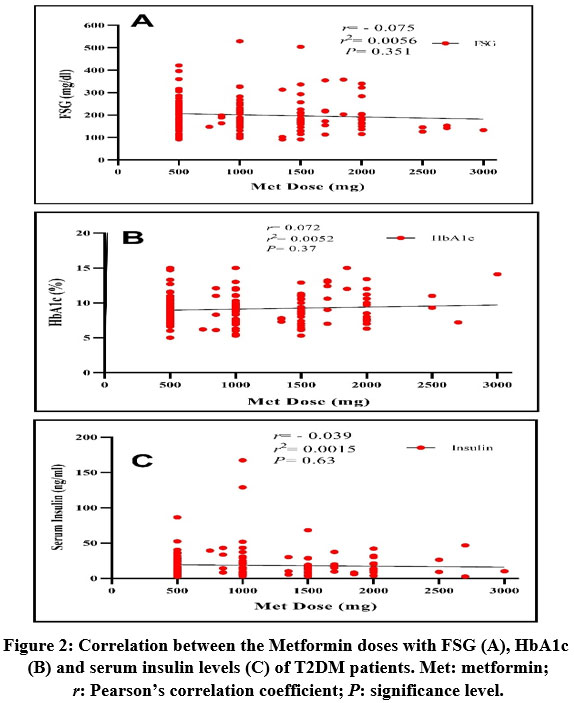 |
Figure 2: Correlation between the Metformin doses with FSG (A), HbA1c (B) and serum insulin levels (C) of T2DM patients. Met: metformin; r: Pearson’s correlation coefficient; P: significance level. |
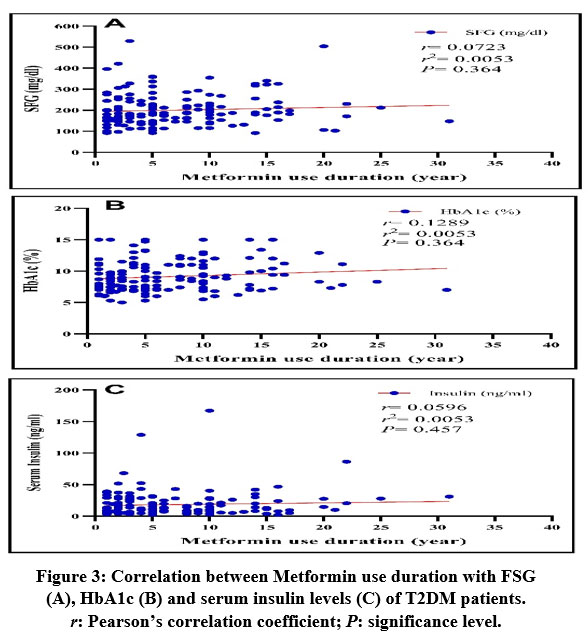 |
Figure 3: Correlation between Metformin use duration with FSG (A), HbA1c (B) and serum insulin levels (C) of T2DM patients. r: Pearson’s correlation coefficient; P: significance level. |
Discussion
Metformin is a safe and effective choice as a first-line medicine for the treatment of T2DM, according to several clinical studies and meta-analyses.16 When metformin alone fails to manage glycemic levels, up-titrating the dose of metformin may be the best option before resorting to a second-line treatment in patients who haven’t responded to metformin monotherapy after six months.17 However, a considerable percentage of T2DM patients do not attain the required level of glycemic control while administering metformin as a monotherapy or in combination protocols, according to long-term clinical experience backed by several clinical investigations.9 Numerous factors, including age, gender, physical inactivity, insufficient drug dose, treatment non-adherence, drug-drug interactions, and metformin interaction with microbiota, can cause significant intraindividual variability in the glycemic control response to metformin.12,13 Table 1 demonstrates that mean values of glycemic control markers indicated insufficient glycemic control, and data arranged by metformin dose (Table 2) reveals no statistically significant difference in glycemic control levels, even when metformin doses were increased to the maximum permitted range. This finding could point to an ineffective clinical decision to increase the metformin dose in such patients. The majority of the updated guidelines advocate starting metformin therapy at 500 mg/day and gradually increasing the dose by 500 mg until the appropriate glycemic objectives are met or until the highest daily doses of 2500 mg are reached.18 In this study, the most prevalent daily regimen was 1000–1500 mg, followed by < 1000 mg. In addition, elevated levels of HbA1c were associated with a longer period of using high-dose metformin, demonstrating a link between inadequate glycemic control and extended duration of metformin therapy (Table 2). To obtain the required glycemic control while preserving acceptable tolerability, metformin doses must be gradually up-titrated. As a result, up-titration should be performed with caution and in accordance with the patient’s tolerance. Meanwhile, to achieve a balance between glycemic control levels and the safety of high-dose metformin therapy, down-titration may also be considered.19 It has been found that up-titration of metformin dose was effective and can be tolerated well.20 The findings of the present study contradict prior findings indicating a substantial proportion of patients are compliant with higher doses of metformin, which could be due to a variety of variables such as treatment costs, free access to drugs, and a lack of knowledge about the disease condition. Furthermore, with therapeutic daily doses ranging from 500-1500 mg, an inverse connection was seen between the dose swallowed and the relative absorption, implying the presence of an active, saturable absorption mechanism21 that limits the efficiency of dose up-titration. The current finding was consistent with a previous study that found no correlation between serum metformin levels during dose up-titration and glycemic control or insulin resistance in newly diagnosed females with T2DM.22 Choi et al. reported in 2011 that T2DM patients with MATE2-K genetic variations had a considerably inferior response to up-titrated metformin doses, as measured by relative changes in HbA1c levels.23 Although this could explain the reported weak correlation between dose up-titration and glycemic control in the current study, such genetic screening is not feasible in our investigation. Additionally, the increased fluctuation in metformin serum levels is due to its flip-flop kinetics. Metformin’s disposition is slowed by slow absorption, and the decreasing bioavailability with high dosages suggests saturable intestinal absorption.24 Consequently, this can explain the reported non-significant differences and poor association between glycemic control and insulin levels after dose up-titration in the present study. The present study showed that all participants had normal kidney function; this finding excludes the involvement of impaired renal function as a causative factor of the poor association between dose up-titration and glycemic control response.25 Metformin was administered as part of a combination treatment with other anti-diabetic medications in this study. However, based on previous data, the potential influence of drug-drug interactions cannot be regarded as a causative factor in the poor relationship between metformin dose and glycemic control.26 Other factors, such as poor adherence to therapy and inadequate dietary restrictions practiced by the majority of participants, may play a significant role in this respect. In this study, metformin dose up-titration was found to have an unforeseen association with glycemic control or blood insulin levels.
Study Limitations
Aside from the small number of participants and single-center approach, the wide range of baseline values may result in inconsistent results from the dose up-titration study. This finding highlighted the importance of selecting the dose and interval of metformin administration, particularly in obese patients, in order to keep the given doses within the therapeutic range. A long-term study with a larger number of participants and comparable baseline hyperglycemia, as well as more frequent glycemic control evaluations, would provide a more comprehensive examination of metformin dose up-titration and its glycemic control response.
Conclusion
According to our findings, in T2DM patients treated with a metformin-based combination, up-titrated metformin doses and treatment duration had no meaningful association with glycemic control or serum insulin levels. Noncompliance with the treatment regimen and inadequate dietary restriction may have an adverse effect on dose up-titration based on glycemic control levels.
Acknowledgment
The presented data was abstracted from an MSc thesis submitted by Zainab S. Abdulrahman to the Department of Pharmacology, College of Medicine, University of Baghdad. The authors thank the University of Baghdad for supporting the project and the Diabetes and Endocrinology Center for technical assistance.
Ethical Committee Approval
Study protocol has been evaluated and approved by Institutional Research Ethics Committee, College of Medicine, University of Baghdad after taking informed consent from study participants.
Conflict of Interest
There are no conflict of interest
Funding source
There is no funding sources.
References
- Cersosimo E, Johnson EL, Chovanes C, Skolnik N. Initiating therapy in patients newly diagnosed with type 2 diabetes: Combination therapy vs a stepwise approach. Diabetes Obes. Metab., 20(3):497-507 (2018). doi: 10.1111/dom.13108.
CrossRef - Singh AK, Singh R, Chakraborty PP. Diabetes monotherapies versus metformin-based combination therapy for the treatment of type 2 diabetes. J. Gen. Med., 14:3833-3848 (2021). doi: 10.2147/IJGM.S295459.
CrossRef - Nathan DM, Buse JB, Davidson MB, Heine RJ, Holman RR, Sherwin R, et al; Professional Practice Committee, American Diabetes Association. European Association for the Study of Diabetes Management of Hyperglycemia in Type 2 Diabetes: A Consensus algorithm for the initiation and adjustment of therapy. A consensus statement from the American Diabetes Association and the European Association for the Study of Diabetes. Diabetologia, 49:1711-1721 (2006). doi: 10.1007/s00125-006-0316-2.
CrossRef - American Diabetes Association. 9. Pharmacologic approaches to glycemic treatment: Standards of Medical Care in Diabetes-2020. Diabetes Care, 43(Suppl. 1): S98-S110 (2020). doi: 10.2337/dc20-S009.
CrossRef - Solymár M, Ivic I, Pótó L, Hegyi P, Garami A, Hartmann P, et al. Metformin induces significant reduction of body weight, total cholesterol and LDL levels in the elderly – A meta-analysis. PLoS One, 13(11):e0207947 (2018) doi: 10.1371/journal.pone.0207947.
CrossRef - Han Y, Xie H, Liu Y, Gao P, Yang X, Shen Z. Effect of metformin on all-cause and cardiovascular mortality in patients with coronary artery diseases: a systematic review and an updated meta-analysis. Diabetol., 18(1):96 (2019). doi: 10.1186/s12933-019-0900-7.
CrossRef - Halabi A, Sen J, Huynh Q, Marwick TH. Metformin treatment in heart failure with preserved ejection fraction: a systematic review and meta-regression analysis. Diabetol., 19(1):124 (2020). doi: 10.1186/s12933-020-01100-w.
CrossRef - Selvin E, Bolen S, Yeh H, Wiley C, Wilson LM, Marinopoulos SS, et al. Cardiovascular outcomes in trials of oral diabetes medications: A systematic review. Intern. Med., 168(19):2070-2080 (2008) doi: 10.1001/archinte.168.19.2070.
CrossRef - Cook MN, Girman CJ, Stein PP, Alexander CM. Initial monotherapy with either metformin or sulphonylureas often fails to achieve or maintain current glycemic goals in patients with Type 2 diabetes in UK primary care. Med., 24(4):350-358 (2007). doi: 10.1111/j.1464-5491.2007.02078.x.
CrossRef - Pawlyk AC, Giacomini KM, McKeon C, Shuldiner AR, Florez JC. Metformin pharmacogenomics: current status and future directions. Diabetes, 63(8):2590-2599 (2014). doi: 10.2337/db13-1367.
CrossRef - Bardin C, Nobecourt E, Larger E, Chast F, Treluyer JM, Urien S. Population pharmacokinetics of metformin in obese and non-obese patients with type 2 diabetes mellitus. J. Clin. Pharmacol., 68(6):961-968 (2012). doi: 10.1007/s00228-011-1207-0.
CrossRef - Vallianou NG, Stratigou T, Tsagarakis S. Metformin and gut microbiota: their interactions and their impact on diabetes. Hormones (Athens), 18(2):141-144 (2019). doi: 10.1007/s42000-019-00093-w.
CrossRef - Montastruc JL, Toutain PL. A new drug–drug interaction between hydroxychloroquine and metformin? A signal detection study. Drug Saf., 43:657-660 (2020). doi: 10.1007/s40264-020-00955-y.
CrossRef - American Diabetes Association. 2. Diabetes Classification and Diagnosis: Standards of Medical Care in Diabetes-2021. Diabetes Care, 44(Suppl. 1):S15-S33 (2021). doi: 10.2337/dc21-S002.
CrossRef - World Medical Association. World Medical Association Declaration of Helsinki: ethical principles for medical research involving human subjects. JAMA., 310(20):2191-2194 (2013). doi: 10.1001/jama.2013.281053.
CrossRef - Palmer SC, Mavridis D, Nicolucci A, Johnson DW, Tonelli M, Craig JC, et al. Comparison of clinical outcomes and adverse events associated with glucose-lowering drugs in patients with type 2 diabetes: A meta-analysis. JAMA., 316(3):313-324 (2016). doi: 10.1001/jama.2016.9400.
CrossRef - Mahabaleshwarkar R, Liu TL, Mulder H. Comparative effectiveness of metformin dosage uptitration versus adding another antihyperglycemic medication on glycemic control in type 2 diabetes patients failing initial metformin monotherapy: A retrospective cohort study. Health Manag., 22(5):457-463 (2019). doi: 10.1089/pop.2018.0158.
CrossRef - Singla R, Bindra J, Singla A, Gupta Y, Kalra S. Drug prescription patterns and cost analysis of diabetes therapy in India: Audit of an endocrine practice. Indian J. Endocrinol. Metab., 23(1):40-45 (2019). doi: 10.4103/ijem.IJEM_646_18.
CrossRef - Kalra S, Gupta Y. Starting titrating and intensifying metformin. Pak. Med. Assoc., 65(7):799-800 (2015). PMID: 26160097.
CrossRef - Diabetes Prevention Program Research Group. Long-term safety, tolerability, and weight loss associated with metformin in the Diabetes Prevention Program Outcomes Study. Diabetes Care, 35(4):731-737 (2012). doi: 10.2337/dc11-1299.
CrossRef - Scheen AJ. Clinical pharmacokinetics of metformin. Pharmacokinet., 30(5):359-371 (1996). doi: 10.2165/00003088-199630050-00003.
CrossRef - Kadhim AK, Ismael DK, Khalaf BH, Hussein KI, Zalzala MH, Hussain SA. Dose-dependent relationship between serum metformin levels and glycemic control, insulin resistance and leptin levels in females newly diagnosed with type 2 diabetes mellitus. Diabetes Mellitus, 2:179-185 (2012). doi: 10.4236/jdm.2012.22028.
CrossRef - Choi JH, Yee SW, Ramirez AH, Morrissey KM, Jang GH, Joski PJ, et al. A common 5′-UTR variant in MATE2-K is associated with poor response to metformin. Pharmacol. Ther., 90(5):674-684 (2011). doi: 10.1038/clpt.2011.165.
CrossRef - Christensen MM, Brasch-Andersen C, Green H, Nielsen F, Damkier P, Beck-Nielsen H, et al. The pharmacogenetics of metformin and its impact on plasma metformin steady-state levels and glycosylated hemoglobin A1c. Genomics, 21(12):837-850 (2011). doi: 10.1097/FPC.0b013e32834c0010.
CrossRef - Li L, Guan Z, Li R, Zhao W, Hao G, Yan Y, et al. Population pharmacokinetics and dosing optimization of metformin in Chinese patients with type 2 diabetes mellitus. Medicine (Baltimore), 99(46):e23212 (2020). doi: 10.1097/MD.0000000000023212.
CrossRef - Stage TB, Brøsen K, Christensen MM. A Comprehensive review of drug-drug interactions with metformin. Pharmacokinet., 54(8):811-824 (2015). doi: 10.1007/s40262-015-0270-6.
CrossRef

