
Manuscript accepted on :23-Jun-2022
Published online on: 28-06-2022
Plagiarism Check: Yes
Reviewed by: Dr. H. B. Nayaka
Second Review by: Hind Shakir
Final Approval by: Dr. H Fai Poon
Azza Abd El-Shaheed1 , Nermine N. Mahfouz1*, Mones M Abushady1, Inas R El-Alameey1, 2
1Department of Child Health-Medical Research and Clinical Studies Institute, National Research Centre, 33rd El Buhouth Street, Former El Tahrir Street, Dokki, PO 12622, and Medical Research Centre of Excellence (MRCE), Cairo, Egypt.
2Faculty of Applied Medical Sciences, Clinical Nutrition Department, Taibah University, Saudi Arabia.
Corresponding Author E-mail: nerminabil@yahoo.com
DOI : https://dx.doi.org/10.13005/bpj/2415
Abstract
Proper growth of children depends on several micronutrients. A fundamental role of Zinc and vitamins as A, B12 and D is crucial to prevent a failure to thrive. To study the relationship between Egyptian school aged children growth, nutritional habits and micronutrients deficiencies. Materials and methods: A case control research involved 60 school aged children (age ranged from 6 to 12 years). Group 1 (malnourished) compared with group II (apparently healthy children of matched peers). Serum concentrations of Zinc, Copper, and vitamins as A, B12, and D were measured using ELISA kits. Compared to controls, the cases showed significantly lower serum concentrations of Zinc, vitamin A, B12, and D (P<0.000 in all), while serum concentration of Copper was significantly higher. In the patient's group, serum vitamin B12, and Zinc concentrations showed significant positive correlation with height for age z- score, while serum Copper concentration showed significant negative correlation with BMI for age z- score. Serum Zinc, vitamin B12, and D concentrations were significantly correlated positively with serum vitamin A. Multiple logistic regression showed statistically significant association of high serum Copper and weekly consumption of sweetened beverages among the studied patients (P < 0.01). Vitamins and Zinc deficiencies showed high prevalence among the school children. Serum vitamin B12 and Zinc concentrations showed significant positive correlation with height. The significant association between high serum Copper and sugary beverages among the studied patients may be due to contained preservatives.
Keywords
Egyptian Children; Growth; Micronutrient; Nutritional Habits
Download this article as:| Copy the following to cite this article: Abd El-Shaheed A, Mahfouz N. N, Abushady M. M, El-Alameey I. R. Relation of Serum Micronutrients to Growth and Nutritional Habits of School Aged Children in Egypt. Biomed Pharmacol J 2022;15(2). |
| Copy the following to cite this URL: Abd El-Shaheed A, Mahfouz N. N, Abushady M. M, El-Alameey I. R. Relation of Serum Micronutrients to Growth and Nutritional Habits of School Aged Children in Egypt. Biomed Pharmacol J 2022;15(2). Available from: https://bit.ly/3Ny7h5V |
Introduction
Nutrition is essential for growth, particularly in children. Micronutrients are nutrients needed in small amounts, and function in the synthesis of enzymes, hormones and other substances 1. They also support growth activity, cognitive development2, and immune and reproductive systems functions3.
Micronutrient malnutrition is a world nutritional problem and significantly affects childhood morbidity and mortality4, 5. Its prevalence is high in developing countries (accounts for 7.3% of the global burden of diseases) 6. Egypt is among the first twenty countries worldwide with elevated chronic childhood malnourishment and growth failure7.
Micronutrient deficiencies mainly affect young children although all age groups can be affected8. Poor nutrition, high losses and elevated needs especially in children during growth and development phase are some causes of such deficiencies9. These micronutrients include Iron (Fe), Iodine (I), Zinc (Zn), Copper (Cu), Selenium (Se), vitamins as A, B2, B6, B12, C, D and E10, 11. Vitamins and minerals deficiencies mainly vitamin A, and Zn spread among more than 2 billion people in the world today particularly in Africa12, 13.
Although the status of one or two micronutrients among children has been documented by many studies14, 15, little is known about several micronutrients at school-age period. Therefore, the current study was conducted to assess age dependent serum levels of micronutrients in Egyptian school aged children, and to study the relationship between their growth, nutritional habits and level of multiple micronutrients deficiencies.
Materials and Methods
This case control research involved sixty elementary school children of both sexes; within the age range of 6 to 12 years old (mean age 8.08±0.7). Majority of the children were males (70%). By screening for symptoms and signs of malnutrition, our study group was further subdivided into two subgroups. One subgroup consisted of 30 malnourished children; and the second subgroup consisted of 30 apparently healthy children in the group II of matched age and sex with no signs of malnutrition.
Inclusion criteria: Malnourished children between 6 and 12 years of age who were frequenting the Nutrition Clinic of the National Nutrition Institute. The enrollment was done over a 12 months’ duration.
This study was conducted in the National Research center. Written consent was signed by the parents. Approval of National Research center Ethical Committee was fulfilled at the beginning of the study.
Data Collection
Demographic data and clinical examination:
Demographic data included age, gender and nutritional status. General examination included vital signs (blood pressure, radial pulse, respiratory rate and temperature).
All the children in both groups underwent a clinical and nutritional evaluation, anthropometrical assessment and laboratory tests. Cases of malnutrition were depicted through the presence of symptoms and or signs suggestive of vitamins deficiency, and the presence of anemia in laboratory investigations. Screening for symptoms and signs of vitamins deficiency included night blindness, muscle cramps, cheilosis, dermatitis, diarrhea, poor memory, abdominal pain, numbness in the extremities, bleeding tendency, previous bone fracture and disturbed gait.
Dietary intake:
Dietary information was collected using food frequency questionnaire including dietary habits as fast foods, beverages with added sugar, vegetables, fruits, breakfast consumption were asked about. Data of 24-hour and one week dietary recall were recorded.
Anthropometric assessment:
Body weight was assessed to the nearest 0.1kg on an electronic digital scale. Height was measured to the nearest 0.5 cm on a Holtain portable stadiometer. Body mass index (BMI) was calculated as Weight (kg)/Height (m2)16. Then Z-scores (weight, height and BMI) were evaluated referring to WHO growth criteria17, and Anthro 2007© software18. Z-scores for BMI were used-as recommended by the WHO-to assess thinness/wasting in school-aged children19.
Biochemical measurements:
Five milliliters venous blood was withdrawn from all children. Blood was centrifuged and sera were kept at -70°C. Serum concentrations of vitamin A, B12, and D were measured by using a commercial enzyme linked immunosorbent assay (ELISA) kit, produced by Glory Science Co., Ltd. 2400 www.glorybioscience.com. Serum concentrations of Cu and Zn were measured by colorimetric method with 5-Brom-PAPS, according to the method of Johnsen and Eliasson20.
Statistical Analysis:
SPSS (Statistical Package of Social Sciences, Chicago, IL, USA) version 21 was used for statistical analyses. The Mean ± SD were used to express continuous data and were compared using Student’s 𝑡-test. Frequencies and percentages were used to express categorical data and were compared between groups by Chi-square test. Evaluation of the association between continuous exposure and continuous covariates was carried out by Pearson’s correlation analysis. A multiple logistic regression analysis was performed to study the effect of presumed risk factors on serum concentrations of micronutrients. A p value less than 0.05 was considered as statistically significant.
Results
This study group included 60 children (30 cases and 30 controls). Their age ranged from 6 to 12 years old with the mean age 8.08±0.7. Majority of the children were males (70%). Stunting was detected in 20% of malnourished children. On comparing mean value of height, and height for age z-scores between cases and controls, a significantly lower mean values were detected in cases group (P<0.01 in all) (Table 1).
Table 1: Anthropometric measurements in cases compared to controls.
| Variables | Control (n=30) | P-value | |
| Mean ± SD | |||
| Weight (kg) | 34.45± 15.60 | 32.68 ± 11.32 | 0.617 |
| Height (cm) | 135.50 ± 21.60 | 125.03 ± 12.38 | 0.04* |
| BMI (kg/m2) | 17.44 ± 2.48 | 18.89 ± 3.04 | 0.47 |
| Weight/ age z-score | -0.13 ± 0.91 | 0.36 ± 1.63 | 0.164 |
| Height/ age z-score | 0.68 ± 1,80 | -0.34 ± 1.06 | 0.037* |
| BMI z-score | 0.33 ± 1.38 | 0.61 ± 1.01 | 0.395 |
*Significant difference at p< 0.05
The weekly dietary behavior revealed a significantly higher difference of low vegetables intake in cases group compared to controls (P = 0.000).
Having sugar-sweetened beverages and irregularity of having three meals were significantly commoner among cases (P = 0.000).
No statistical difference was noted between both groups as regards having breakfast (P=0.078) (Table 2).
Table 2: Dietary behaviors in cases versus control groups.
| Variables | Answers | Patients (n= 30) | P value | |
| Fast foods/week | Yes
No Sometimes |
3
9 18 |
4
11 15 |
0.735 |
| Regular 3 meals/week | Yes
No Sometimes |
21
0 9 |
12
13 5 |
0.000* |
| Beverages with sugar/week | Yes
No Sometimes |
0
15 15 |
17
0 13 |
0.000* |
| Vegetables consumption/week | Yes
No Sometimes |
30
0 0 |
8
15 7 |
0.000* |
| Breakfast consumption/week | Yes
No Sometimes |
21
3 6 |
19
9 2 |
0.078 |
*P < 0.05 is significant
On comparison with controls, the studied cases showed highly significantly lower serum Zn, vitamin A, B12, and D with a P=0.000 for the three vitamins and P=0.028 for Zn, while serum concentration of Cu was significantly higher in cases (Table 3) and (Table 4).
Table 3: Levels of serum micronutrients among cases and controls.
| Micronutrients | Control group
Mean ±SD |
Cases
Group Mean ±SD |
P | |
| Serum vitamins
|
Vitamin A (ug/dl) | 95.4 ± 57.86 | 47.37 ± 18.12 | 0.000* |
| Vitamin B12 (ug/dl) | 19.60 ± 16.78 | 0.63 ± 2.73 | 0.000* | |
| Vitamin D (ug/dl) | 38.0 ± 13.97 | 6.79 ± 9.31 | 0.000* | |
| Serum minerals | Zn (umol/l) | 23.96 ± 9.34 | 18.43 ± 9.61 | 0.028* |
| Cu (ug/dl) | 102.68 ± 4.86 | 135.8 ± 75.52 | 0.048* |
*Significant difference at p< 0.05, highly significant difference at p≤ 0.01
Table 4: Deficiency percent of micronutrients among both groups.
| Micronutrients | Deficiency % | p | ||
| Controls | Cases | |||
| Serum vitamins
|
Vitamin A (ug/dl) | 40% | 83.3% | 0.001* |
| Vitamin B12 (ug/dl) | 20% | 96.7% | 0.000* | |
| Vitamin D (ug/dl) | 30% | 93.3% | 0.000* | |
| Serum minerals | Zn (umol/l) | 0 | 30% | 0.001* |
| Cu (ug/dl) | 40% | 60% | 0.004* | |
*Significant difference at p< 0.05, highly significant difference at p≤ 0.01
The cases’ serum vitamin B12 and Zn concentration showed significantly positive correlation with height for age z- score, while serum Cu concentration showed significantly negative correlation with BMI for age z- score.
The correlations of anthropometry and serum levels of micronutrients of the studied cases are shown in Table 5.
Table 5: Correlations between micronutrients levels and anthropometry.
| Variables | Height for age z- score | Weight for age z- score | BMI for age z-score | |
| Serum vitamin A (ug/dl) | Pearson Correlation | -.153 | -.242 | -.146 |
| Sig. (2-tailed) | .244 | .063 | .293 | |
| Serum vitamin B12 (ug/dl) | Pearson Correlation | .311 | .102 | .127 |
| Sig. (2-tailed) | .015* | .439 | .361 | |
| Serum vitamin D (ug/dl) | Pearson Correlation | -.008 | -.222 | -.214 |
| Sig. (2-tailed) | .953 | .088 | .121 | |
| Serum Zn (umol/L) | Pearson Correlation | .329 | .183 | .036 |
| Sig. (2-tailed) | .010* | .161 | .797 | |
| Serum Cu (ug/dL) | Pearson Correlation | .188 | -.109 | -.272 |
| Sig. (2-tailed) | .151 | .408 | .046* | |
*Significant difference at p< 0.05.
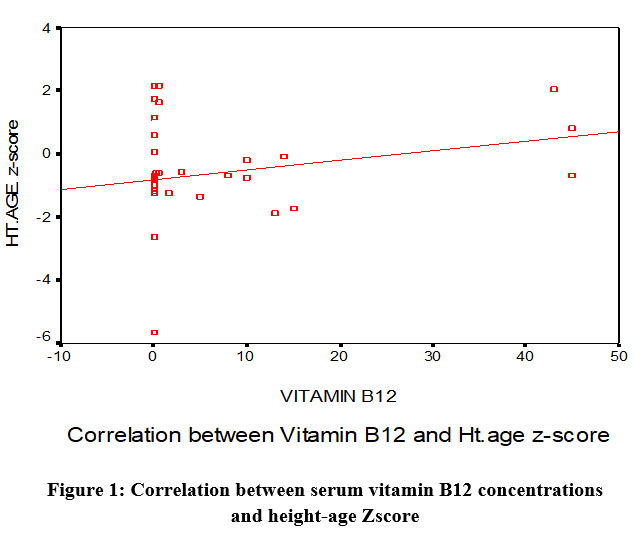 |
Figure 1: Correlation between serum vitamin B12 concentrations and height-age Zscore |
In the patient’s group, serum vitamin B12, and D concentrations showed a significant positive correlation with serum vitamin A, as well as between serum Zn and serum B12 (p < 0.05).
Serum Cu showed a significant negative correlation with serum vitamin D (p < 0.05) as shown in Table 6.
Table 6: Correlations between serum vitamins and minerals among cases.
| Variables | Serum Vitamin B12 (ug/dl) | Serum Vitamin D (ug/dl) | |
| Serum Vitamin A (ug/dl) | Pearson Correlation | 0.347 | 0.522 |
| Sig. (2-tailed) | 0.007** | 0.000** | |
| Serum Cu (ug/dL) | Pearson Correlation | -0.036 | -0.419 |
| Sig. (2-tailed) | 0.784 | 0.001** | |
| Serum Zn (umol/L) | Pearson Correlation | 0.313 | 0.236 |
| Sig. (2-tailed) | 0.015* | 0.070 | |
*Significant difference at p< 0.05, highly significant difference at p≤ 0.01
Multiple logistic regression showed a statistically significant association between high serum Cu and consumption of sweetened beverages per week among the studied patients (P < 0.01), as shown in Table (7)
Table 7: Multiple logistic regression for the presumed risk factor for high serum Cu.
| Variables | B | Std. Error | Wald | Sig. | Exp(B) |
| Intercept | 82.85 | 6.45 | 164.76 | 0.000 | |
| Fast foods/ week | -0.527 | 0.862 | 0.374 | 0.388 | 0.59 |
| Breakfast consumption/ week | 0.968 | 1.121 | .745 | 0.388 | 2.63 |
| Regular three meals/ week | 0.467 | 0.839 | 0.309 | 0.578 | 1.59 |
| Beverages with sugar/ week | 8.841 | 1.306 | 45.825 | 0.000* | 1.44 |
| Vegetables consumption/ week | 0.852 | 0.846 | 1.014 | 0.314 | 2.34 |
Highly significant difference at p≤ 0.01
Discussion
Micronutrient and vitamin deficiencies endanger health in developing countries. Malnourishment is prevalent in sub-Saharan Africa with a percent ranging from 4% to 46% including 1% to 10% severe cases21. Worldwide, it is considered a high risk for morbidity and mortality in childhood22.
In this study, the parameters of anthropometry (weight-for-age, height-for-age and BMI-for-age z- scores) served to evaluate the state of nutrition of the participants. Stunting was detected in 20% of malnourished children, which was near to a finding of 24% in a research enrolling preschool Ethiopian children23. Another Ethiopian study conducted in Gumbrit showed a prevalence of stunting of 50% which is higher than that in the present study24. Also, high prevalence of stunting was documented in Tanzanian children (44.2%) 25. Childhood stunting is a type of chronic malnutrition with higher prevalence than underweight and wasting.
A significant difference was revealed between the eating’s behaviors of cases compared to controls. Low vegetables’ consumption was more prevalent in patients group. An irregularity of the three main meals and a high intake of sugar sweetened beverages per week were commoner practices in cases (P < 0.05). This matches with the high prevalence of sugary drinks’ intake by more than one third of the Egyptian children participating in the study conducted by Abd El-Shaheed et al26. However, there was no statistical difference between patients group compared to controls as regards of having breakfast.
Poor growth, reduced immuno-competence, and increased infectious disease related morbidity are associated with Zn deficiency in children27. Intervention to improve Zn status is recommended when the prevalence of Zn deficiency is more than 20%, according to WHO28.
The cases showed a statistically highly significant low Zn level compared to healthy controls. This finding was in harmony with studies29, 30, which detected Zn deficiencies among school age children. Low intake of Zn rich foods and low bioavailability of Zn leads to Zn deficiency which is more common in children from low-income groups32.
The mean serum concentration of Cu in children of this study was higher than healthy controls. Similarly, Amare et al.15 and Jumaan et al.33, explained that the elevation of the Cu binding protein, Ceruloplasmin as an acute-phase reactant in infectious diseases and inflammations leads to increased Cu levels in serum.
Fat-soluble vitamins as vitamins A and D are adequately absorbed in fatty meals34. In opposition to controls, our studied patients showed highly significant lower serum levels of vitamin A, B12, and D (P< 0.000 in all). The serum mean value for vitamin A was 47.37 ± 18.12 ug/dl, and 83.3% of our studied patients had vitamin A deficiency. Both percentage and mean value is higher than the one reported in Wukro in Northern Ethiopia 35, 36.
Insufficient serum vitamin D concentration is a common problem worldwide37. Several reports show that low vitamin D is common in sunny regions although sun exposure is the major source of vitamin D38, and 1 billion people worldwide have vitamin D deficiency or insufficiency especially children and young adults39,40.
In the present study, the serum mean value for vitamin D (6.79 ± 9.31 ug/dl) was statistically significantly lower as compared to healthy controls (38.0 ± 13.97 ug/dl) and 93.3% of this studied patients had vitamin D deficiency. This is in concordance with what have recently been reviewed by Park et al.41.
In the current study, there is a positive correlation between height for age z-score and serum Zn concentration in children. This is in agreement with Prentice et al.42 who found slow physical growth in children with Zn deficiency.
In our study, the positive correlation between height for age z- score and serum vitamin B12 concentration in children and the negative correlation between serum Cu concentration and BMI for age z-score need to be explained. This is in agreement with Pedraza et al.43 who found growth delay in children with multiple micronutrients deficiencies.
In the patient’s group, serum vitamin B12, and D concentrations showed significantly positive correlation with serum vitamin A, as well as between serum Zn and vitamin B12 concentrations. Serum Cu concentration showed significant negative correlation with vitamin D concentration. Multiple logistic regressions showed that those consuming more beverages with sugar were more at risk of having high serum Cu and it may be due to contained preservatives.
Conclusion
This study showed that school children in Egypt with different nutritional habits had different serum concentrations of micronutrients with high prevalence of Zn and vitamins deficiencies. The significant association between high serum Cu and sugary beverages among the studied patients may be due to contained preservatives. Appropriate and beneficial strategies for micronutrient supplementation should be planned. More studies are needed to investigate the levels of other vitamins and minerals to have a more holistic perspective of the current nutritional problems.
Acknowledgments
We are thankful to all the participants in this study and to their parents. Also, we would like to express our gratitude to the laboratory team from the National Research Centre who accomplished the laboratory analyses.
Ethical Statement
Approval of the National Research center Ethical Committee was fulfilled at the beginning of the study. Informed consent was signed by the legal guardian of each child before enrollment.
Conflict of Interest
The authors declare having no conflict of interest.
Funding source
No funding source.
References
- Giovanni S, Antonio C, Giovanni C. Macronutrient balance and micronutrient amounts through growth and development. Italian Journal of Pediatrics. 2021; 47:109 https://doi.org/10.1186/s13052-021-01061-0.
CrossRef - Walker SP, Wachs TD, Gardner JM, Lozoff B, Wasserman GA, et al. Child development: risk factors for adverse outcomes in developing countries. Lancet. 2007; 369: 145–157. https://doi.org/10.1016/S0140-6736(07)60076-2.
CrossRef - Centers for Disease Control and Prevention. Second National Report on Biochemical Indicators of Diet and Nutrition in the U.S. Population. 2012; Available:https://www.cdc.gov/nutritionreport/pdf/nutrition_book_complete508_final.pdf Accessed 10th May 2022.
- World Health Organization Global health risks. Mortality and burden of disease attributable to selected major risks. Geneva, Switzerland. 2009; Available:https://apps.who.int/iris/bitstream/handle/10665/44203/9789241563871_eng.pdf?sequence=1&isAllowed=y Accessed 10th May 2022.
- World Health Organization (WHO). A Report of Joint World Health Organization/Centers for Disease Control and Prevention Technical Consultation on the Assessment of Iron Status at the Population Level. 2007; Available:http://apps.who.int/iris/bitstream/handle/10665/75368/9789241596107_eng.pdf?sequence=1 Accessed 10th May 2022.
- World Health Organization (WHO). Biennium Report. Department of Nutrition for Health and Development: Evidence and Programme Guidance. 2014;Available:http://apps.who.int/iris/bitstream/10665/101179/1/WHO_NMH_NHD_EPG_14.1_eng.pdf. Accessed 10th May 2022.
- Egypt Demographic and Health Survey 2014; Ministry of Health and Population,Cairo,Egypt;Available:https://dhsprogram.com/pubs/pdf/fr302/fr302.pdf Accessed 10th May 2022.
- World Health Organization (WHO) 2009; Global prevalence of vitamin A deficiency in populations at risk 1995–2005. Available:http://apps.who.int/iris/bitstream/handle/10665/44110/9789241598019_eng.pdf?sequence=1 Accessed 10th May 2022.
- Adelekan DA. Multiple micronutrient deficiencies in developing countries. Nutrition. 2003; 19: 473–474. https://doi.org/10.1016/S0899-9007(03)00032-7.
CrossRef - Prieto MB and Cid JL-H. Malnutrition in the critically ill child: the importance of enteral nutrition. Int J Environ Res Public Health. 2011; 8: 4353–4366. https://doi.org/10.3390/ijerph8114353.
CrossRef - Micronutrient Initiative and United Nations Children’s Fund (UNICEF) Vitamin and mineral deficiency: A Global Damage Assessment Report. Ottawa, Canada. 2014; Available: https://mjmp.org/wp-content/uploads/2014/12/Vitamin-and-Minderal-Deficiency-A-Global-Damage-Assessment-Report-2002-UNICEF-MI1.pdfAccessed 10th May 2022.
- Joint statement by the World Health Organization (WHO), the World Food Programme (WFP) and the United Nations Children’s Fund (UNICEF). Preventing and controlling micronutrient deficiencies in populations affected by an emergency. 2007; Available: https://www.who.int/publications/m/item/WHO-WFP-UNICEF-statement-micronutrients-deficiencies-emergency Accessed 10th May 2022.
- Regional Office for Africa, World Health Organization (WHO) 2006; the health of the people: The African regional health report. Geneva, Switzerland. Available: https://www.afro.who.int/sites/default/files/2017-06/african_regional_health_report2006_0.pdfAccessed 10th May 2022.
- Food and Agriculture Organization of the United Nations (FAO), United Nations Children’s Fund (UNICEF), United Nations World Food Programme (WFP) and World Health Organization (WHO). 2013; National Nutrition Programme/MDG-F Joint Programme. Available: http://www.mdgfund.org/program/nationalnutritionprogrammemdgfjointprogrammeAccessed 10th May 2022.
- Amare B, Moges B, Fantahun B, Tafess K, Woldeyohannes D, Yismaw G et al. Micronutrient levels and nutritional status of school children living in Northwest Ethiopia. Nutr J. 2012; 11: 108. https://nutritionj.biomedcentral.com/articles/10.1186/1475-2891-11-108.
CrossRef - Lohman, TG, Roche AF, Martorell R. Anthropometric standardization reference manual. Champaign, IL. 1988; Human kinetics Publishers. https://www.worldcat.org/title/anthropometric-standardization-reference-manual/oclc/15592588
- WHO, Anthro Plus for personal computers. Manual Software for assessing growth of the world’s children and adolescents, Geneva, 2009. https://www.who.int/tools/growth-reference-data-for-5to19-years/application-tools
- World Health Organization. Training course on child growth assessment: interpreting growth indicators. Geneva: WHO, 2008. https://www.who.int/publications/i/item/9789241595070
- de Onis M, Onyango AW, Borghi E, Siyam A, Nishida C, Siekmann J. Development of a WHO growth reference for school-aged children and adolescents. Bull World Health Organ. 2007; 85:660–667. https://doi.org/10.2471/blt.07.043497.
CrossRef\ - Johnson E and Eliasson R. Evaluation of a commerically available kit for the colorimetric determination of zinc. Inter J Andrology. 1987; 10(2): 435-440. https://doi.org/10.1111/j.1365-2605.1987.tb00216.x.
CrossRef - Conrad RC, Frederick KG, Dawn DSE, Joy LS, Anne J, Christine ANC, et al. Zinc and iron deficiency and their interrelations in low-income African American and Hispanic children in Atlanta. Am J Clin Nutr. 2010; 91:1027–34. https://doi.org/10.3945/ajcn.2009.28089.
CrossRef - Wierzba TF, El-Yazeed RA, Savarino SJ, Mourad AS, Rao M, Baddour M et al. The interrelationship of malnutrition and diarrhea in a periurban area outside Alexandria, Egypt. J Pediatr Gastroenterol Nutr. 2001; 32(2):189-96. https://doi.org/10.1097/00005176-200102000-00018.
CrossRef - Worku N, Erko B, Torben W, Belay M, Kasssu A, Fetene T et al. Malnutrition and intestinal parasitic infections in school children of Gondar, North West Ethiopia. Ethiop Med J. 2009; 47(1):9-16. PMID: 19743775.
- Melkie E. Assessment of nutritional status of preschool children of Gumbrit, North West Ethiopia. Ethiop.J.Health Dev. 2007; 21(2):125–129. https://doi.org/10.4314/ejhd.v21i2.10039.
CrossRef - Abubakar A, Uriyo J, Msuya SE, Swai M and Stray-Pedersen B. Prevalence and Risk Factors for Poor Nutritional Status among Children in the Kilimanjaro Region of Tanzania. Int. J. Environ. Res. Public Health. 2012; 9, 3506-3518. http://dx.doi.org/10.3390/ijerph9103506.
CrossRef - Abd El-Shaheed A, Mahfouz NN, Moustafa RSI, Elabd, MA. Alarming Eating Behaviours among Adolescents in Egypt. Open Access Maced J Med Sci. 2019; 7(13):2189-2193. https://doi.org/10.3889/oamjms.2019.583.
CrossRef - Gioconda GB, Jose´ FP, Maria DS, Felix M, Alberto O. Undetectable serum calcidiol: not everything that glitters is gold. Clin Kidney J. 2012; 5:37–40. https://doi.org/10.1093/ndtplus/sfr121.
CrossRef - Benoist B, Darnton-Hill I, Davidsson L, Fontaine O, Hotz C. Conclusions of the Joint WHO/UNICEF/IAEA/IZiNCG Interagency Meeting on Zinc Status Indicators. Food Nutr Bull. 2007; 28:S480–484. https://pubmed.ncbi.nlm.nih.gov/17988008/
CrossRef - Folake OS, Abdulkadir AE, Wilna HOT, Carin EN, Christine SV. Prevalence of zinc deficiency among primary school children in a poor peri-urban informal settlement in South Africa. Health SA Gesondheid. 2010; 15(1):1–6.
CrossRef - Dehghani SM, Katibeh P, Haghighat M, Moravej H, Asadi S. Prevalence of zinc deficiency in 3-18 years old children in shiraz-iran. Iran Red Crescent Med J. 2011; 13(1):4-8. PMID: 22946012; PMCID: PMC3407579.
- Thurlow RA, Winichagoon P, Pongcharoen T, Gowachirapant S, Boonpraderm A, Manger MS, et al. Risk of zinc, iodine and other micronutrient deficiencies among school children in North-East Thailand. Eur J Clin Nutr. 2006; 60:623–632. https://doi.org/10.1038/sj.ejcn.1602361.
CrossRef - Dewey KG and Brown KH. Update on technical issues concerning complementary feeding of young children in developing countries and implications for intervention programs. Food Nutr Bull. 2003; 24:5–28. https://doi.org/10.1177/156482650302400102.
CrossRef - Jumaan RM. Serum Copper, Zinc and Copper/Zinc ratio and their relationship to Age and Growth Status in Yemeni Adolescent Girls. Sultan Qaboos University Medical Journal. 2008; 8(3):291–299.
- Kennedy G, Ballard T, Dop MC. Guidelines for measuring household and individual dietary diversity. 2013; Food and Agriculture Organization of the United Nations . Available: https://www.fao.org/3/i1983e/i1983e.pdf. Accessed 10th May 2022.
- Kassaye T, Receveur O, Johns T, Becklake MR. Prevalence of vitamin A deficiency in children aged 6-9 years in Wukro, northern Ethiopia. Bull World Health Organ. 2001; 79(5):415-22. PMID: 11417037; PMCID: PMC2566418.
- Herrador Z, Sordo L, Gadisa E, Buño A, Gómez-Rioja R, Iturzaeta JM et al. Micronutrient deficiencies and related factors in school-aged children in Ethiopia: a cross-sectional study in Libo Kemkem and Fogera districts, Amhara Regional State. PLoS One. 2014; 9(12):e112858. doi: 10.1371/journal.pone.0112858. PMID: 25546056; PMCID: PMC4278675.
CrossRef - McLean E, de Benoist B, Allen LH. Review of the magnitude of folate and vitamin B12 deficiencies worldwide. Food Nutr Bull. 2008; 29(2 Suppl):S38-51. doi: 10.1177/15648265080292S107. PMID: 18709880.
CrossRef - Peterlik M, Boonen S, Cross HS, Lamberg-Allardt C. Vitamin D and calcium insufficiency-related chronic diseases: an emerging world-wide public health problem. Int J Environ Res Public Health. 2009; 6(10):2585-607. doi: 10.3390/ijerph6102585. PMID: 20054456; PMCID: PMC2790094.
CrossRef - Levis S, Gomez A, Jimenez C, Veras L, Ma F, Lai S, Hollis B, Roos BA. Vitamin d deficiency and seasonal variation in an adult South Florida population. J Clin Endocrinol Metab. 2005; 90(3):1557-62. doi: 10.1210/jc.2004-0746. PMID: 15634725.
CrossRef - Baroncelli GI, Bereket A, El Kholy M, Audì L, Cesur Y, Ozkan B et al. Rickets in the Middle East: role of environment and genetic predisposition. J Clin Endocrinol Metab. 2008; 93(5):1743-50. doi: 10.1210/jc.2007-1413. PMID: 18285415.
CrossRef - Park HY, Lim YH, Kim JH, Bae S, Oh SY, Hong YC. Association of serum 25-hydroxyvitamin D levels with markers for metabolic syndrome in the elderly: a repeated measure analysis. J Korean Med Sci. 2012; 27(6):653-60. doi: 10.3346/jkms.2012.27.6.653. PMID: 22690097; PMCID: PMC3369452.
CrossRef - Prentice A, Schoenmakers I, Jones KS, Jarjou LM, Goldberg GR. Vitamin D deficiency and its health consequences in Africa. Clin Rev Bone Miner Metab. 2009; 7: 94–106. https://dx.doi.org/10.1007%2Fs12018-009-9038-6
CrossRef - Pedraza DF, Rocha AC, Sousa CP. Crescimento e deficiências de micronutrientes: perfil das crianças assistidas no núcleo de creches do governo da Paraíba, Brasil [Growth and micronutrient deficiencies: profile of children attended at the day care center for the government of Paraiba, Brazil]. Cien Saude Colet. 2013; 18(11):3379-90. Portuguese. doi: 10.1590/s1413-81232013001100027. PMID: 24196902.
CrossRef

