
Manuscript accepted on :13-Jun-2022
Published online on: 29-06-2022
Plagiarism Check: Yes
Reviewed by: Swastika Maity
Second Review by: Nishu Raina
Final Approval by: Dr. Jihan Seid Hussein
Sameh Abdelaziz Mansour1, Mohammed Abdel Malik Hassan Essa1, Hoda Hegazy Ahmed2, Mohammed Elsayed Abo-ghabsha3, Mahmoud Mohammed Mohammed Metwally3, Aliaa Ahmed Wahby4, Mohamed Mahmoud Abd Elmohsen1, Nagwa Abdallah M. Ismail2 and Mohamed Ahmed Abdel Mawla2
1Pediatric Department, Al-Azhar University, Cairo, Egypt.
2Pediatric Department, National Research Center, Cairo, Egypt.
3Clinical Pathology, Department Al-Azhar University, Cairo, Egypt.
4Clinical Pathology, Department National Research Center, Cairo, Egypt.
Corresponding Author E-mail: drmohamedahmed85@yahoo.com
DOI : https://dx.doi.org/10.13005/bpj/2430
Abstract
Nowadays bronchial asthma and increased body weight represent major problems in children. Asthmatic attacks in obese patients are not well controlled using the conventional treatment regimens. Asthma has been associated with increased systemic and exhaled levels of hydrogen peroxide and thiobarbituric acid-reactive products in expired breath condensate of asthmatic patients. Thiobarbituric acid reactive substances formed from peroxidation of lipids. The aim of the Study is to show the action of Thiobarbituric acid reactive substances activity in asthma among overweight children suffering from asthma and to detect the connection between this biomarker and the etiology, degree of severity among children with bronchial hypereactivity. The study is cross-sectional study, was conducted on Egyptian children on regular follow up at the outpatients pediatric allergy clinic in Bab El-shariea university Hospital, Al-Azhar University. The study group included 96 child divided into 4 groups. Group A which included overweight children with (mild persistent asthma). Group B which included non-overweight children with (mild persistent asthma).Group C which included overweight non-asthmatics children and Group D The control group (non-overweight non-asthmatics). The results showed significant increase in the Thiobarbituric acid reactive substances level in Overweight asthmatic patients in relation to non-overweight patients with asthma. We found that they can distinguish asthma controlled patients from non-asthma controlled patients. This study showed high level of oxidative stress with high asthma severity as measured by Thiobarbituric acid reactive substances. These substances were good markers of relation between bronchial hyper activity and oxidative stress which became high with asthma severity.
Keywords
Asthma; Obesity; Severity
Download this article as:| Copy the following to cite this article: Mansour S. A, Essa M. A. M. H, Ahmed H. H, Abo-ghabsha M. E, Metwally M. M. M, Wahby A. A, Abd Elmohsen M. M, Ismail N. A. M, Mawla M. A. A. Oxidative Stress: Assessment of Thiobarbituric Acid Reactive Substances Value in Overweight Asthmatic Children. Biomed Pharmacol J 2022;15(2). |
| Copy the following to cite this URL: Mansour S. A, Essa M. A. M. H, Ahmed H. H, Abo-ghabsha M. E, Metwally M. M. M, Wahby A. A, Abd Elmohsen M. M, Ismail N. A. M, Mawla M. A. A. Oxidative Stress: Assessment of Thiobarbituric Acid Reactive Substances Value in Overweight Asthmatic Children. Biomed Pharmacol J 2022;15(2). Available from: https://bit.ly/3bCVdmG |
Introduction
Nowadays bronchial asthma and increased body weight represent major problems in children; their number became very high in the last years and had reached a stationary phase1,2,3. Bronchial asthma is chest problem caused by inflammation with symptoms different in date and power. There is a complex connection between endogenous and genetic factors and outer cause of physical, chemical, pharmacological, and immunological facts causing excessive secretion production, spasm of the bronchial tree, mucosal inflammation and fibrosis1.
Obesity is an important predisposing factor for asthma; however, mechanisms of action are not clear. Moreover, asthmatic attacks in obese patients are not well stabilized when the conventional treatment is used4. Many factors interfere with asthma treatment like some associated metabolic factors5, which include high lipids level and increased body weight6.
Oxidative stress is imbalance between oxidative and anti oxidative processes causing development of large amounts of oxidation products, which can’t be measured easily. In the airways, assessment the count of lipid peroxides is a good marker for the degree of oxidative stress, Lipid peroxides are stable non-enzymatic by-products of oxidation. Asthmatic patients usually have high systemic and exhaled levels of hydrogen peroxide and thiobarbituric acid-reactive products in expired breath condensate of asthmatic patients7. These biomarkers are accompanied with decline in the lung function and deterioration in the degree of severity of bronchial asthma.8-11
The link between degree of difficulty of asthma and oxidative antioxidant degree still not clear. Previous researches showed high count of oxidatives in relation to deterioration of bronchial asthma; however, no proof of antioxidants deficiency in severe asthma12
Thiobarbituric acid reactive substances (TBARS) are developed from peroxidation of lipids (degradation products of fats)13
TBARS test detects malondialdehyde (MDA) found in the body, also malondialdehyde produced by lipid hydroperoxides through process of hydrolysis. MDA is a low-molecular-weight end product developed through the degeneration of many products of the process of lipid peroxidation14
Aim of the Study
To evaluate the role of TBARS among overweight patients suffering from asthma and to determine the connection between this biomarker and the etiology and degree of severity among patients suffering from asthma.
Patient and Method
The study is cross-sectional study, was conducted on Egyptian children on regular follow up at the outpatients pediatric allergy clinic in Bab El-shariea university Hospital, Al-Azhar University from July 2021to August 2022.
The study group included 96 child (girls and boys) aged between (6-14) years and divided into 4 groups : Group A which included 24 overweight (BMI 25-29) children with (mild persistent asthma).
Group B which included 24 non-overweight children with (mild persistent asthma).Group C which included 24 overweight non-asthmatics children and Group D The control group (non-overweight non-asthmatics) 24 apparently healthy matched age and sex with no history of allergic problems .
The patients were classified into overweight and non-overweight groups according to the body mass index (BMI).
The diagnosis of asthma according to the guidelines (the Global Initiative for Asthma) depended on presence of previous long term or repeated pulmonary problems like cough, wheezes, dyspnea and tight chest which show good relieve with using short-acting bronchodilator.
The Degree of asthma severity detected by dynamic spirometry pre & post- bronchodilators which were done by a handled computerized spirometer (Spirostik equipment and blue cherry software from Gerathem Respiratory, 2016).
The following data were obtained; forced vital capacity FVC (liter), forced expiratory volume in the first, second FEV1 (liter), FEV1/FVC ratio or FEV1%. For every parameter obtained, actual and predicted values for age, sex, height, weight and percentage (%) of the predicted will be calculated. The highest values of three forced expiratory maneuvers were used. These parameters measured according to guidelines of the European Respiratory Society and the American Thoracic Society.
Data about the patients were taken from parents including: age, gender, consanguinity, family history, duration of illness and drugs used.
All the asthmatic children who were enrolled in this study didn’t receive any anti-inflammatory treatment such as corticosteroids or leukotriene antagonists in the last six weeks, and didn’t develop upper or lower respiratory tract infection or asthma exacerbation.
Children with long term cardiac, hepatic or renal problems, autoimmune disorders, infections and Diabetes mellitus together with those who have been receiving vitamins, antioxidant drugs, hormonal drugs and diuretics were excluded from this study.
Laboratory Investigation
Blood samples were collected from the study group and put in chilled tubes containing EDTA as anticoagulant. Then the plasma separated by centrifugation at 3000 xg in 20 minutes and kept in-20º until analysis. Blood was then stored on ice between the time of sampling and centrifugation. The following tests were performed:full blood picture (CBC),Erythrocyte sedimentation rate (ESR),C -reactive protein (CRP),lipid profile (cholesterol and triglycerides),Glycated Hb (Hb A1c) and Thiobarbituric acid reactive substances (TBARS)
Statistical Analysis
Files were put on the PC and analysis performed by software package version 20.0. (Armonk, NY: IBM Corp).The Kolmogorov- Smirnov was performed to see the normal distribution of variables. Differences of categorical variables between study groups were assessed by Chi-square test (Monte Carlo correction). Student t-test was used in normally distributed quantitative data. Mann Whitney test was used for not normally distributed quantitative data while function of ANOVA test was to compare between the four studied groups and followed by Post Hoc test (Tukey) for pairwise comparison. And we used Kruskal Wallis test show abnormally distributed quantitative data and followed by Post Hoc test (Dunn’s for multiple comparisons test) for pairwise comparison. Significance of the obtained results was measured at the 5% level.
Results
Research was conducted on 96 patient who were divided into 4 groups The demographic data, anthropometric measurement and laboratory investigation are present in table 1. There was significant difference regarding BMI which was higher in group 1 and 2 compared to other groups. There was also significant difference in the level of HDL between group 1 and the other groups .there was significant increase in the TBARS level in group 1 when compared with the other groups.
Table 1: Demographic Data, Anthropometric Measurement and Investigations of the Study Groups.
| Group 1 (n = 24) |
Group 2 (n = 24) |
Group 3 (n = 24) |
Group 4 (n = 24) |
Level of Sig. (p) | |
| Sex | |||||
| Male | 10 (41.7%) | 8 (33.3%) | 14 (58.3%) | 15 (62.5%) | χ2=5.461
(0.141) |
| Female | 14 (58.3%) | 16 (66.7%) | 10 (41.7%) | 9 (35.7%) | |
| Age (years) | |||||
| Mean ± SD. | 7.7a ± 2.2 | 7.9a ± 2 | 6.9a ± 1.7 | 6.9a ± 1.9 | F=1.772 (0.158) |
| Median (Min. – Max.) | 7.4 (5 – 12) | 7.3 (5.2 – 11.8) | 6.9 (4.3 – 10.2) | 7.1 (4.2 – 10.2) | |
| BMI (kg/m2) | |||||
| Mean ± SD. | 27.6a ± 1.2 | 27.2a ± 1.1 | 18.9b ± 2.1 | 18.4b ± 2.5 | F=184.144*
(<0.001*) |
| Median (Min. – Max.) | 27.6 (25.5 – 29.6) | 27.1 (25.2 – 29.4) | 18.4 (15.7 – 24.9) | 18 (14.2 – 24.2) | |
| MAP (mmHg) | |||||
| Mean ± SD. | 71.5a ± 10.6 | 70.8a ± 11.8 | 67.5a ± 4.3 | 68a ± 4 | F=1.324 (0.271) |
| Median (Min. – Max.) | 67.8 (62.3 – 98.3) | 66.5 (59.7 – 99.7) | 67 (60.7 – 75.3) | 67 (62.3 – 75.3) | |
| HbA1c | |||||
| Mean ± SD. | 5.2a ± 0.5 | 5.1a ± 0.3 | 5a ± 0.2 | 4.9a ± 0.2 | F=2.172 (0.097) |
| Median (Min. – Max.) | 5.1 (3.9 – 6.6) | 5.1 (4.6 – 5.8) | 5.0 (4.5 – 5.5) | 4.9 (4.6 – 5.4) | |
| Total cholesterol (mg/dl) | |||||
| Mean ± SD. | 148.6a ± 15.6 | 140.9a ± 17.7 | 139a ± 18.5 | 138.9a ± 17.3 | F=1.690 (0.175) |
| Median (Min. – Max.) | 148 (122 – 189) | 143 (117 – 184) | 139.5 (104 – 172) | 140 (109 – 172) | |
| HDL (mg/dl) | |||||
| Mean ± SD. | 37.2d ± 2.1 | 41c ± 3.7 | 46.1b ± 8.8 | 52.2a ± 2.2 | F=40.435* (<0.001*) |
| Median (Min. – Max.) | 37 (31 – 41) | 41 (34 – 47) | 45 (32 – 61) | 52 (48 – 57) | |
| TG (mg/dl) | |||||
| Mean ± SD. | 73.4a ± 15.2 | 72.2a ± 9.2 | 66.2a ± 14 | 65.9a ± 11.8 | F=2.292 (0.083) |
| Median (Min. – Max.) | 74 (47 – 103) | 71 (58 – 93) | 65 (42 – 89) | 65 (48 – 89) | |
| LDL (mg/dl) | |||||
| Mean ± SD. | 93.1a ± 15.9 | 85.4a ± 16.8 | 82.5a ± 18.6 | 83.5a ± 19.6 | F=1.745 (0.163) |
| Median (Min. – Max.) | 93 (58.8 – 122.8) | 85.6 (58.4 – 125.2) | 81.4 (50.2 – 119.6) | 82.9 (47.2 – 119.6) | |
| ESR | |||||
| Mean ± SD. | 12 ± 4.6 | 11.1 ± 5 | 8.8 ± 2.4 | 8.4 ± 2.3 | H=13.158* (0.004*) |
| Median (Min. – Max.) | 13a (4 – 16) | 13a (4 – 16) | 9b (5 – 12) | 8b (5 – 12) | |
| CRP | |||||
| Mean ± SD. | 6.2a ± 1.5 | 7.1a ± 2.6 | 6.3a ± 2.6 | 6.3a ± 2.5 | F=0.770 (0.514) |
| Median (Min. – Max.) | 6 (4 – 8) | 6 (4 – 12) | 6 (4 – 12) | 6 (4 – 12) | |
| TBARS (nmol/ml) | |||||
| Normal (0 – 0.8) | 18 (75.0%) | 20 (83.3%) | 22 (91.7%) | 24 (100%) | χ2=7.711* (MCp=0.038*) |
| Abnormal (>0.8) | 6 (25.0%) | 4 (16.7%) | 2 (8.3%) | 0 (0%) | |
| Mean ± SD. | 0.64 ± 0.36 | 0.48 ± 0.29 | 0.33 ± 0.28 | 0.20 ± 0.21 | H=31.040* (<0.001*) |
| Median (Min. – Max.) | 0.55a (0.15 – 1.35) | 0.40a (0.07 – 1.1) | 0.22b (0.13 – 1.32) | 0.10b (0.01 – 0.60) | |
| Asthma controlled | |||||
| No | 13 (54.2%) | – | 5 (20.8%) | – | χ2=5.689* (0.017*) |
| Yes | 11 (45.8%) | – | 19 (79.2%) | – |
SD: Standard deviation
Group 1: Overweight asthmatic Group 2: Overweight only
Group 3: Non overweight asthmatic Group 4: Non overweight non asthmatic (control)
In table 2 the study groups were classified into 2 groups’ asthmatics and non-asthmatics and there was no significant correlation between 2 groups regarding laboratory investigations and TBARS levels.
Table 2: Comparison between Asthmatics and Non-Asthmatics groups According to Laboratory Investigation.
| Asthmatics (n = 48) |
Non-asthmatics (n = 48) |
Test of Sig. | P | |
| HbA1C | ||||
| Mean ± SD. | 5.1 ± 0.4 | 5.0 ± 0.3 | t= 0.830 |
0.408 |
| Median (Min. – Max.) | 5.1 (3.9 – 6.6) | 4.9 (4.6 – 5.8) | ||
| Total cholesterol (mg/dl) | ||||
| Mean ± SD. | 143.8 ± 17.6 | 139.9 ± 17.3 | t= 1.098 |
0.275 |
| Median (Min. – Max.) | 144.5 (104.0 – 189.0) | 140.5 (109 – 184) | ||
| TG (mg/dl) | ||||
| Mean ± SD. | 69.8 ± 14.9 | 69.1 ± 10.9 | t= 0.273 |
0.785 |
| Median (Min. – Max.) | 70.0 (42.0 – 103.0) | 69.5 (48.0 – 93.0) | ||
| LDL (mg/dl) | ||||
| Mean ± SD. | 87.8 ± 17.9 | 84.5 ± 18.1 | t= 0.903 |
0.369 |
| Median (Min. – Max.) | 89 (50.2 – 122.8) | 83.9 (47.2 – 125.2) | ||
| CRP | ||||
| Mean ± SD. | 6.2 ± 2.1 | 6.7 ± 2.6 | t= 1.044 |
0.299 |
| Median (Min. – Max.) | 6 (4 – 12) | 6 (4 – 12) | ||
| TBARS (nmol/ml) | ||||
| Mean ± SD. | 0.49 ± 0.36 | 0.34 ± 0.29 | U= 801.50* |
0.010* |
| Median (Min. – Max.) | 0.4 (0.1 – 1.4) | 0.3 (0.01 – 1.1) |
Asthmatics: Group 1 + Group 3
Non-asthmatics: Group 2 + Group 4
There was significant increase in the TBARS level in uncontrolled Asthmatic patients when compared to the controlled one as seen in table 3
Table 3: Laboratory investigations of controlled and Uncontrolled Groups.
| Controlled (n = 30) |
Uncontrolled (n = 18) |
p | |
| HbA1C | |||
| Mean ± SD. | 5.1 ± 0.4 | 5 ± 0.4 | 0.488 |
| Median (Min. – Max.) | 5 (4.5 – 6.6) | 5.1 (3.9 – 5.5) | |
| Total cholesterol (mg/dl) | |||
| Mean ± SD. | 147.2 ± 17.9 | 138.3 ± 16 | 0.091 |
| Median (Min. – Max.) | 149 (110 – 189) | 139.5 (104 – 169) | |
| TG (mg/dl) | |||
| Mean ± SD. | 71.9 ± 14.7 | 66.3 ± 14.9 | 0.217 |
| Median (Min. – Max.) | 72 (44 – 103) | 64 (42 – 92) | |
| LDL (mg/dl) | |||
| Mean ± SD. | 91.3 ± 17.4 | 82 ± 17.8 | 0.082 |
| Median (Min. – Max.) | 93 (50.2 – 122.8) | 82.4 (55.2 – 117.8) | |
| CRP | |||
| Mean ± SD. | 6.5 ± 2.3 | 5.8 ± 1.6 | 0.274 |
| Median (Min. – Max.) | 6 (4 – 12) | 6 (4 – 8) | |
| TBARS (nmol/ml) | |||
| Mean ± SD. | 0.27 ± 0.11 | 0.84 ± 0.33 | <0.001* |
| Median (Min. – Max.) | 0.2 (0.1 – 0.6) | 0.8 (0.2 – 1.4) |
In table 4 the asthmatic children (n=48) were subdivided into 4 groups depending on weight and status whether controlled or not .there was significant increase in the TBARS levels in the overweight asthmatic uncontrolled group and the nonoverweight asthmatic uncontrolled group also when compared with the other 2 groups.
Table 4: TBARS (nmol/ml) Level among the Different Studied Groups.
| Controlled | Uncontrolled | Test of Sig. (p) | |||
| Overweight asthmatic (G1) (n = 11) |
Non overweight asthmatic (G3) (n = 19) |
Overweight asthmatic (G1) (n = 13) |
Non overweight asthmatic (G3) (n = 5) |
||
| TBARS (nmol/ml) | |||||
| Normal (0 – 0.8) | 11 (100%) | 19 (100%) | 7 (53.8%) | 3 (60%) | χ2=14.760* (MCp=0.001*) |
| Abnormal (>0.8) | 0 (0%) | 0 (0%) | 6 (46.2%) | 2 (40%) | |
| Mean ± SD. | 0.36 ± 0.13 | 0.22 ± 0.06 | 0.88 ± 0.33 | 0.76 ± 0.36 | H=30.680* (<0.001*) |
| Median (Min. – Max.) | 0.4b (0.2 – 0.6) | 0.2c (0.1 – 0.4) | 0.8a (0.2 – 1.4) | 0.6ab (0.4 – 1.3) | |
In Figure 1 and table 5 we illustrated that TBARS can diagnose asthmatic patients with cut off value >0.3 and with both sensitivity and specificity 56.25% and 58.33 % respectively.
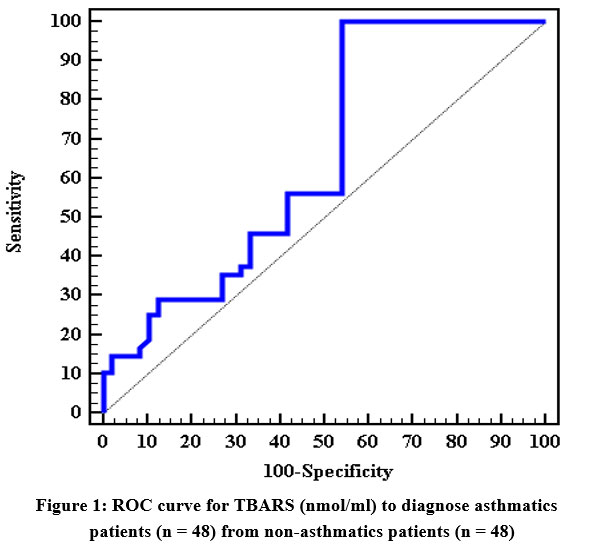 |
Figure 1: ROC curve for TBARS (nmol/ml) to diagnose asthmatics patients (n = 48) from non-asthmatics patients (n = 48). |
Table 5: Agreement (Sensitivity, Specificity) for TBARS (nmol/ml) to Diagnose Asthmatics Patients(n = 48) from Non-Asthmatics Patients (n = 48)
| AUC | p | 95% C.I | Cut off | Sensitivity | Specificity | PPV | NPV | |
| TBARS (nmol/ml) | 0.652 | 0.010* | 0.539 – 0.765 | >0.3 | 56.25 | 58.33 | 57.4 | 57.1 |
Univariate and multivariate logistic regression analysis were used to detect parameters affecting level of TBARS as obesity, BMI and HDL as shown in table 6
Table 6: Univariate and Multivariate Logistic Regression Analysis for the Parameters Affecting Abnormality TBARS (nmol/ml) (n = 12 vs. 84)
| Univariate | #Multivariate | |||
| p | OR (95%C.I) | P | OR (95%C.I) | |
| Female | 0.089 | 3.300 (0.834 – 13.052) | ||
| Obesity | 0.025* | 6.053 (1.249 – 29.321) | 0.541 | 1.785 (0.278 – 11.442) |
| Asthmatic | 0.225 | 2.200 (0.615 – 7.868) | ||
| Age (years) | 0.963 | 1.007 (0.743 – 1.365) | ||
| BMI (kg/m2) | 0.015* | 1.278 (1.049 – 1.556) | ||
| MAP (mmHg) | 0.876 | 1.006 (0.938 – 1.078) | ||
| HbA1c | 0.487 | 1.764 (0.356 – 8.741) | ||
| Total Cholesterol (mg/dl) | 0.383 | 1.016 (0.981 – 1.052) | ||
| HDL (mg/dl) | 0.014* | 0.856 (0.756 – 0.969) | 0.103 | 0.885 (0.763 – 1.025) |
| TG (mg/dl) | 0.202 | 0.968 (0.922 – 1.017) | ||
| LDL (mg/dl) | 0.222 | 1.022 (0.987 – 1.059) | ||
| ESR | 0.032* | 1.210 (1.016 – 1.441) | 0.276 | 1.099 (0.927 – 1.302) |
| CRP | 0.395 | 0.878 (0.649 – 1.186) | ||
In Figure 2 and table 7 we found that TBARS can distinguish asthma controlled patients from non asthma controlled patients with cut off value ≤0.45and with both sensitivity and specificity 93.33% and 93.33% respectively.
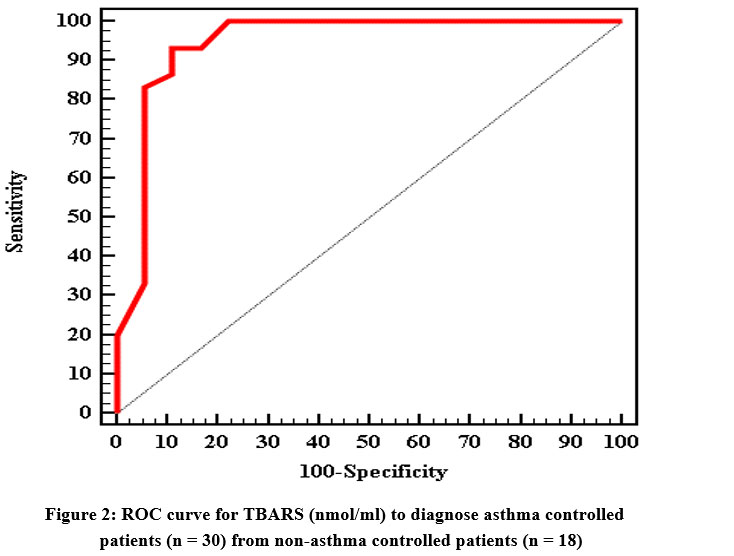 |
Figure 2: ROC Curve for TBARS (nmol/ml) to Diagnose Asthma Controlled Patients (n = 30) from Non-Asthma Controlled Patients (n = 18). |
Table 7: Agreement (Sensitivity, Specificity) for TBARS (nmol/ml) to Diagnose Asthma Controlled Patients (n = 30) from Non-Asthma Controlled Patients (n = 18)
| AUC | p | 95% C.I | Cut off | Sensitivity | Specificity | PPV | NPV | |
| TBARS (nmol/ml) | 0.945 | <0.001* | 0.865 – 1.000 | ≤0.45# | 93.33 | 88.89 | 93.3 | 88.9 |
Discussion
Asthma is a problem in the lung caused by long standing inflammation and accompanied with repeated attacks of abnormal breath sounds and coughing which are due to high level of oxidative stress (15). In our study we found significant increase in the TBARS level in overweight children with bronchial asthma in relation to those who are not. Our results were similar to what To et al concluded in their study about relation between oxidative stress and obese asthmatic patients where they found that serum leptin and TBRAS were significant in overweight children with bronchial asthma than non-overweight asthmatic group16. Our results were also similar to Antczak et al study when they found significant increase in TBRAS in asthmatic patients when compared to non asthmatic group and they concluded that detection of these markers in the exhaled air could be useful noninvasive biochemical marker of airway inflammation17.
Although Assessment of TBRAS as an oxidative stress marker in obese asthmatic children was not clearly discussed in the literature, the role of oxidative stress biomarkers in bronchial asthma has been widely discussed by many authors as a result of its high value. Karadogan et al studied, levels of MDA, protein carbonyls (PC), and reduced glutathione (GSH) as part of oxidative markers in their study on asthmatic patients .MDA and PC were significant in uncontrolled group when compared to other groups,18 the results that support significant increase in the TBARS level in uncontrolled Asthmatic patients when compared to the controlled one in our study. Another study supported our results conducted by Topic et al while discussing Oxidative Stress in the Childhood Asthma when they found significant increase in the level of myeloperoxidase (MPO) and percent of granulocytes in severe persistent asthma when compared with other groups of asthma.19
Alalameey et al conducted a study to assess the role of asymmetric dimethylarginine (ADMA) , and (MDA) as oxidant indicators and serum paraoxonase pattern as an antioxidant indicator in bronchial asthma, they found that Serum levels of ADMA and MDA were suggestively higher with in severe asthmatic attacks.20
Scott et al., also concluded in their study that high levels of ADMA were affected by the degree of asthma prognosis.21
Bishopp et al conducted a study comparing fractional exhaled nitric oxide (FeNO), exhaled breath condensate nitrite/nitrate (EBC-NOx), spirometry, and serum vitamins and trace elements in asthmatic and non asthmatic children. They found significant increase in FeNO level in severely asthmatic children22 A Saudi study was conducted among obese asthmatic children when Serum Ghrelin Levels were measured. In this study the authors found that serum ghrelin, IL-4, and IL-21 levels were statistically significant among uncontrolled children in comparison with controlled group23. On contrast of our study Dut et al discovered no difference between mild and severe asthma while measuring levels of malondialdehyde and glutathione by collecting Exhaled breath condensate from the children.24
TBARS was significant in obese asthmatic children in relation to the other groups. There was agreement that overweight children have increased amount of systemic oxidative stress,25 with enlarged fat tissue generating proinflammatory cytokines and adipokines which cause many metabolic problems.26 The relation between overweight and bronchial hyper reactivity is still not clear, however many hypotheses have appeared , describing the effects of inflammatory adipokines on bronchial degree of inflammation, hormonal pattern during lung growth in overweight children, bronchial remodeling in response to mechanical stresses, and genetic pleomorphism that control risk for asthma and obesity.27 Soliman et al discussed the role of some oxidative stress biomarkers as High mobility group box 1 (HMGB1), interleukin 8 (IL-8), monocyte chemoattractant protein 1 (MCP-1), extracellular signal-regulated protein kinases 1 and 2 (ERK1/2), and urinary Hsp72 in pathogenesis of asthma in patients with increased body weight. There were significant increase in serum HMGB1, IL-8, MCP1, ERK1/2, FFAs, and H2O2 levels with urinary Hsp72 levels in patients with increased body weight with asthma in relation to other groups28
Shim et al found that the glycation end products (RAGE) mRNA expression was significantly higher among obese asthmatic patients than other groups in their study. They found close association of RAGE legends with hyperactivity and its prognosis as well as more RAGE up-regulation and amplification.29 RAGE is an important factor in tumor growth development and a detector of problems with inflammation as in childhood asthma30. In our study we found the high oxidative stress burden with increased asthma severity during measuring TBRAS which concluded that TBRAS is a good biomarker for oxidative stress in asthmatic patients and in many other diseases. Nacítarhan et al found high MDA levels were statistically significant in diabetic patients with hyperlipidemia than those with normal lipid profile. Serum MDA quantity in the group diagnosed with diabetes and increased lipid and MDA quantity measured in urine in both diabetic groups were statistically significant when compared with those in hyperlipidemic non diabetic group29. Many authors have shown in their studies higher levels of MDA in Type 1 and Type 2 diabetic patients .30,31,32,33
Walter et al in their analysis of the PREVENT study found that TBARS amounts were used as a good markers for cardiovascular problems in patients with controlled coronary heart problems.34
Conclusions
Our study showed that severity of asthma depends on the level of oxidative stress as measured by TBRAS. TBRAS measurement is a good indicator of relation between bronchial hyperactivity and oxidative stress that became high with uncontrolled athma.
We also provided further proof about the importance of TBRAS in the development of asthma. Further studies are needed to discuss the role of more oxidative stress markers in bronchial asthma and obesity.
Funding Source
No fund received.
Conflict of Interest
No Conflict of Interest.
Acknowledgment
We like to thank the pediatric department of Alazhar university for their kind help in doing such work.
References
- Global Initiative for Asthma. Global Strategy for Asthma Management and Prevention, 2020. Available from: www.ginasthma.org. 2020.
CrossRef - Prugger C, Keil U. [Development of obesity in Germany – prevalence, determinants and perspectives]. Dtsch Med Wochenschr. 2007; 132: 892-897.
CrossRef - Keß A, Spielau U, Beger C, Gausche R, Vogel M, Lipek T, Körner A, Pfäffle R, Kiess W. Further stabilization and even decrease in the prevalence rates of overweight and obesity in German children and adolescents from 2005 to 2015: a cross-sectional and trend analysis. Public Health Nutr. 2017; 20: 3075-3083.
CrossRef - Ozbey U, Ucar U, Calis AG the effects of obesity on pulmonary function in adults with asthma. Lung India. (2019) 36:404–410.
CrossRef - Borsi H, Raji H, Shoushtari MH, Tavakol H, Haghighizadeh MH, Mal-Amir MD. Investigating the effect of sildenafl on improving lung function and quality of life in patients with severe asthma. J Family Med Prim Care, 2019, 8:2361–2363.
CrossRef - Klepaker G, Svendsen MV, Hertel JK, Holla OL, Henneberger PK, Kongerud J, et al. Influence of obesity on workability, respiratory symptoms, and lung function in adults with asthma. Respiration, 2019, 98:473–481.
CrossRef - Komakula S, Khatri S, Mermis J, Savill S, Haque S, Rojas M, Brown L, Teague GW, Holguin F. Body mass index is associated with reduced exhaled nitric oxide and higher exhaled 8- isoprostanes in asthmatics. Respir Res 2007; 16;8:32.
CrossRef - Antczak, D. Nowak, B. Shariati, M. Król, G. Piasecka, Z. Kurmanowska Increased hydrogen peroxide and thiobarbituric acid-reactive products in expired breath condensate of asthmatic patients Eur Respir J 1997; 10: 1235–1241 DOI: 10.1183/09031936.97.10061235.
CrossRef - Aldakheel FM, Thomas PS, Bourke JE, Matheson MC, Dharmage SC, Lowe AJ. Relationships between adult asthma and oxidative stress markers and pH in exhaled breath condensate: a systematic review. Allergy 2016; 71(6):741-57.
CrossRef - Wedes SH1, Khatri SB, Zhang R, Wu W, Comhair SA, Wenzel S, Teague WG, Israel E, Erzurum SC, Hazen SL. S-adenosylmethionine reduces airway inflammation and fibrosis in a murine model of chronic severe asthma via suppression of oxidative stress. Clin Transl Sci. 2009; 2(2):112-7.
CrossRef - Yoon SY, Hong GH, Kwon HS, Park S, Park SY, Shin B, Kim TB, Moon HB, Cho YS. Noninvasive markers of airway inflammation in asthma. Exp Mol Med. 2016; 3:48(6):e236.
CrossRef - A. Bishopp et al. Biomarkers of oxidative stress and antioxidants in severe asthma A Prospective Case-Control Study. Ann Allergy Asthma Immunol 118 ,2017; 445e451.
CrossRef - Sai, Nai-Wen; Chang, Ya-Ting; Huang, Chi-Ren; Lin, Yu-Jun; Lin, Wei-Che; Cheng, Ben-Chung; Su, Chih-Min; Chiang, Yi-Fang; Chen, Shu-Fang; Huang, Chih-Cheng; Chang, Wen-Neng; Lu, Cheng-Hsien . “Association between Oxidative Stress and Outcome in Different Subtypes of Acute Ischemic Stroke”. BioMed Research International. 2014: 1–7. doi:10.1155/2014/256879. PMC 4034452. PMID 24895559.
CrossRef - Li Y, Li GP. Oxidative stress in asthma: a distinct clinical and pathological feature? J Biol Regul Homeost Agents, 2016;30:1053–7.
- Janahi IA, Bener A, Bush A. Prevalence of asthma among schoolchildren: International Study of Asthma and Allergies in Childhood, Qatar. Pediatr Pulmonol. 2006;41:80–86.
CrossRef - To M, Kono Y, Ogura N, Mikami S, Honda N, Hitani A, Kano I, Haruki K, To Y. Obesity-related systemic oxidative stress: An important factor of poor asthma control. Allergol Int. 2018 Jan;67(1):147-149.
CrossRef - Antczak A, Nowak D, Shariati B, Król M, Piasecka G, Kurmanowska Z. Increased hydrogen peroxide and thiobarbituric acid-reactive products in expired breath condensate of asthmatic patients. Eur Respir J. 1997 Jun;10(6):1235-41.
CrossRef - Karadogan B, Beyaz S, Gelincik A, Buyukozturk S, Arda N. Evaluation of oxidative stress biomarkers and antioxidant parameters in allergic asthma patients with different level of asthma control. J Asthma. 2021 Jan 8:1-15.
CrossRef - Topic A, Francuski D, Nikolic A, Milosevic K, Jovicic S, Markovic B, Djukic M, Radojkovic D. The Role of Oxidative Stress in the Clinical Manifestations of Childhood Asthma. Fetal Pediatr Pathol. 2017 Aug;36(4):294-303.
CrossRef - El-Alameey IR, Fathy GA, Shady MMA, Ali A, Fathy HA, Youness ER, Nasr SA. Relationship of Oxidant and Antioxidant Markers to Asthma Severity in Egyptian Asthmatic Children. Open Access Maced J Med Sci. 2017 Aug 10;5(5):645-650.
CrossRef - Scott JA, North ML, Rafii M. Asymmetric dimethylarginine is increased in asthma. Am J Respir Crit Care Med. 2011; 184: 779– 785.
CrossRef - Abigail Bishopp ; Ramamurthy Sathyamurthy; Sarah Manney; Craig Webbster; Mamidipudi Thirumala Krishna; Adel H. Mansur. Biomarkers of oxidative stress and antioxidants in severe asthma A Prospective Case-Control Study Ann Allergy Asthma Immunol 118 (2017) 445-451.
CrossRef - Mohammed Saeed Al-Ayed, Khaled Sadeq Al-Shaibari, Dhafer Alshehri, Mohammed Jamaan Alzahrani, Iman Nasser, Hamdan Saad Alaamri, Wed Ahmad Alaseeri, Ahmed A. Mahfouz, Saeed Ali Alsareii, Ahmed Morad Asaad, Aamir Magzoub, Mohammed Ansar Qureshi, Ehab Elagab, Elhashimi Eltayb Hassan and Mohammed Helmy Faris Shalayel, Serum Ghrelin Levels in Saudi Obese Asthmatic School-Children—Correlation with Interleukin-4, Interleukin-5, and Interleukin-21 Int. J. Environ. Res. Public Health 2020, 17, 1656;
CrossRef - Dut R, Dizdar EA, Birben E, Sackesen C, Soyer OU, Besler T, Kalayci O. Oxidative stress and its determinants in the airways of children with asthma. Allergy. 2008 Dec;63(12):1605-9.
CrossRef - Ford ES, Mannino DM, Redd SC. Serum antioxidant concentrations among US adults with self-reported asthma. J Asthma 2004;41:179-187.
CrossRef - Urushidate S, Matsuzaka M, Okubo N, et al. Association between concentration of trace elements in serum and bronchial asthma among Japanese general population. J Trace Elem Med Biol. 2010;24:236-242.
CrossRef - Sagdic A, Sener O, Bulucu F, et al. Oxidative stress status and plasma trace elements in patients with asthma or allergic rhinitis. Allergol Immunopathol (Madr). 2011;39:200-542.
CrossRef - Nema Ali Soliman · Muhammad Tarek Abdel Ghafar · Reham Mohamed El Kolaley · Yasser Mostafa Hafez · Rehab E. Abo Elgheit · Marwa Mohamed Atef Cross talk between Hsp72, HMGB1 and RAGE/ERK1/2 signaling in the pathogenesis of bronchial asthma in obese patients Molecular Biology Reports,2020 ; 47:4109–4116 https://doi.org/10.1007/s11033-020-05531-2.
CrossRef - Shim EJ, Chun E, Lee HS, Bang BR, Kim TW, Cho SH et al . The role of high-mobility group box-1 (HMGB1) in the pathogenesis of asthma. Clin Exp Allergy, 2012 ; 42:958–965.
CrossRef - Ullah MA, Loh Z, Gan WJ, Zhang V, Yang H, Li JH et al Receptor for advanced glycation end products and its ligand highmobility group box-1 mediate allergic airway sensitization and airway infammation. J Allergy Clin Immunol,2014; 134:440–450.
CrossRef - Nacítarhan S, Ozben T, Tuncer N. Serum and urine malondialdehyde levels in NIDDM patients with and without hyperlipidemia. Free Radic Biol Med. 1995 Dec;19(6):893-6.
CrossRef - Gallou, G.; Ruelland, A.; Legras, B.; Maugendre, D.; Allannic, H.; Cloarec, L. Plasma malondialdehyde in type 1 and type 2 diabetic patients. Clin. Chim. Acta. 1993 ;214:227-234;
CrossRef - Noberasco, G.; Odetti, P.; Boeri, D.; Maiello, M.; Adezati, L. Malondialdehyde (MDA) level in diabetic subjects. Relationship with blood glucose and glycosylated hemoglobin. Biomed. Pharmacother. 1991 ; 45:193-196.
CrossRef - Odetti, P.; Chiarlone, 0.; Capucci, F.; Boeri, D.; Maiello, M. Lipoperossidi circolanti ed invecchiamento. Giorn Gerontol. 1989 ; 36(9):670-674.

