
Manuscript accepted on :02-03-2022
Published online on: 12-03-2022
Plagiarism Check: Yes
Reviewed by: Dr. Bhavana Gundavarapu
Second Review by: Dr. Abhishek Mukherjee
Final Approval by: Dr. Ian James Martin
Sabiha Ferdowsy Koly1,2 , Shirajum Munira1, Sonia Zaman1, Saimon Shahriar2, Md. Shah Amran2 * and Abu Asad Chowdhury2
1Pharmacy Department, Southeast University, Banani- 1213, Dhaka, Bangladesh.
2Pharmaceutical Chemistry Department, Faculty of Pharmacy, Dhaka University, Dhaka-1000, Bangladesh.
Corresponding Author E-mail: amranms@du.ac.bd
DOI : https://dx.doi.org/10.13005/bpj/2351
Abstract
Herbal drugs are composed of single or several types of medicinal plants with additives. This type of preparations is gaining a wide range of popularity among a large a number of people throughout the world. With the increase of usage, it is necessary to maintain the quality of these drug preparations. Therefore, analytical approaches for their intended use in drug quality evaluation need to be validated. Our aim was to develop simple, rapid, selective, precise and economical UV-spectroscopic method for the quality control of black plum containing herbal preparation in different marketed formulation. Spectrometric analysis of black plum using ethanol shows the maximum absorbance at 279 nm. It has shown linear absorbance over the concentration range of 0.1-0.5 µg/ml with R2 value 0.9914. The developed method was validated as per ICH Q2 (R1) guidelines for various parameters namely linearity, precision, accuracy, robustness. The results were calculated statistically and it showed compliance with ICH guidelines. The relative standard deviation values and percent recovery has been found to be satisfactory, suggesting that the approach proposed is accurate. This proposed method can thus be used for the regular analytical study of black plum in bulk and pharmaceutical formulation.
Keywords
Herbal drugs; Method development; Method validation; UV spectroscopy
Download this article as:| Copy the following to cite this article: Koly S. F, Munira S, Zaman S, Shahriar S, Amran M. S, Chowdhury A. A. Development and Validation of a UV-spectroscopic Method for the Analysis of Black Plum in Marketed Preparations Using Ethanol as a Solvent. Biomed Pharmacol J 2022;15(1). |
| Copy the following to cite this URL: Koly S. F, Munira M. S, Zaman S, Shahriar S, Amran M. S, Chowdhury A. A. Development and Validation of a UV-spectroscopic Method for the Analysis of Black Plum in Marketed Preparations Using Ethanol as a Solvent. Biomed Pharmacol J 2022;15(1). Available from: https://bit.ly/3KEmwZW |
Introduction
Drugs which are made from botanicals, or plants and that are used to cure diseases or to maintain health are called herbal drugs. For thousands of years, herbal medicine has been used among the people for the treatment of various diseases.80 percent of the global population is estimated to rely on traditional herbal medicine for primary health care1. Many consider herbal medicine to offer an alternative treatment for different diseases, especially diseases requiring lifelong pharmaceutical medication. It is believed that phytoconstituents present in herbal preparations show better compatibility in human system. With the increasing usage of herbal drugs, maintaining the safety and efficacy of these drugs have become a major concern. Safety and efficacy of drugs must be ensured through standardization before the drug entering into the market. It is very difficult to maintain the quality of herbal drug formulation due to variation in chemical profile of plant sources and these variations is affected by various factors like as growing, harvesting, storage and drying processes2-4. This variation can affect chemical constituents as well as pharmacological activity of drug. Therefore, it is necessary to develop methods for standardization of preparation available in the market5,6.
Syzygium cumini or black plum is a member of Myrtaceae family and native to Indian subcontinent. It is widely distributed in tropical and subtropical region. It is found in India, Pakistan, Bangladesh, Myanmar, China, Indonesia, Ceylon. It is also found in Asia, South Africa and Nepal 7-9. It is also cultivated in different parts of the world like as United states and Australia due to its great economic importance. It is grown as a fruit producer and as a source of timber.
S. cumini is rich in compounds containing phenolics, flavonoids, glucoside derivative. The leaf extracts contain flavonoids like as quercetin, kaempferol, myricetin, myricitrin and gallic acid, ellagic acid, ferulic acid, chlorogenic acid as phenol derivatives 10-12. The stem bark of S. cumini contains gallic acid, ellagic acid, β-sitosterol, betulinic acid, myricetin, quercetin, friedelin, epi-friedelanol, eugenin, tyannin and flavonoids13-16. The most widely used parts of S. cumini is its seed. The seed contains hydrolysable tannins, phenolic contents, eugenol, terpenes. The fruits also contain glucose, gallic acid, citric acid, raffinose, anthocyanins, 7-hydroxycalamenene,oleanolic acid, β-sitosterol, methyl- β-orsellinate 17,18.
S. cumini seed is used to treat different types of diseases. It is also reported to have its usage in the treatment of diarrhea, stomach-ache, piles, dysentery, digestive problems19.Different literature studies prove the usage of its seed has antidiabetic effects. Various parts of the Syzygium cumini plant act as liver tonic, purifies blood, strengthen teeth and gums has a great role in the treatment of ringworm infection of head 20.
Spectroscopic analysis is a widely used technique in the analysis of herbal drugs. Some studies describe the uses of HPLC, HPTLC method in the analysis of different polyherbal formulations 21,22. Single or multiple herbs containing preparation like as Ayurvedic, Unani or polyherbal formulations can be analysed using UV-spectroscopy. In this technique, it involves the measurement of ultra violet radiation absorption by the substance in solution. Both qualitative and quantitative analysis can be done through this technique. It is a simple, accurate, inexpensive technique for the analysis of small amount of sample. This technique is based on Beer-Lambert’s law. In the present study, we aimed at development and validation of UV-spectroscopic technique according to ICH(Q2) guideline for the analysis of S. cumini seed in polyherbal formulation23.
Materials and Methods
Instruments used
Shimadzu double-beam UV-Vis spectrophotometer (UV-1800 Model) having 1.5 nm spectral bandwidth with 10 mm quartz cuvette cell was employed in the assay purpose. UV-probe software version 2.43 was used for data acquisition for the studied sample. For weighing the standard and sample, analytical balance (Model- Ht224R, Shinkodens-hi Co. Ltd, Japan) was used.
Materials
S. cumini fruits were purchased from local market and seeds were collected from these. Then the seed was identified in the national herbarium of Bangladesh having accession no. 50,442. Laboratory grade ethanol was used in analysis and it was bought from Merck Chemicals, India. Three formulations containing S. cumini seed were collected available in local market. All the other chemicals, kits and reagents employed were of laboratory grade.
S. cumini extract preparation
Through proper washing of S. cumini seeds, the dust attached to it was eliminated properly and was air dried until it is crispy. Then it was ground to powder. About 350 gm of powdered fruit materials were taken in an amber-colored reagent bottle and kept for soaking in 1.5 litres of ethanol. The soaked materials-containing container was properly sealed and held for a period of about 14 days with occasional shaking and stirring. The whole mixture was filtered using cotton and then Whatman No. 1 filter paper successively to get the clear filtrate. Then concentrated crude seed extract was collected using rotary evaporator through evaporation of solvent. Next the concentrated extract was further taken in water bath and air dried for complete drying. The obtained extract was preserved for further analysis.
Solvent selection
The solubility of S. cumini seeds was checked using methanol, ethanol, acetone and ethyl acetate. The extract showed better solubility in ethanol in compare to other solvents.
Preparation of standard solution
10 mg S. cumini seeds extract was accurately weighed and taken in a 100 mL volumetric flask, volume was adjusted up to the mark with ethanol. A stock solution having concentration of 100 μg/mL was found. From the stock solution, standard solution of different concentration (0.1-0.5 μg/mL) was prepared by dilution with ethanol.
Selection of the wavelength
From these prepared solutions, 0.03μg/mL solution was scanned in 200-800 nm uv-visible range in 1.0 cm cell using ethanol as blank. The maximum absorbance for this solution was found at 279 nm.
Standard calibration curve preparation
At 279 nm wavelength, the absorbance of S. cumini seeds extract was measured at different concentrations (0.1-0.5 μg/mL). A calibration curve was plotted between concentrations versus absorbance of the extracts and a regression equation was found. From the calibration curve, linearity was observed utilizing a regression equation.
Validation of method
Validation is an integral part of quality assurance. A good analytical practice cannot be achieved without validation. Method validation is defined as the process that is used to ensure that the analytical technique used for a particular test is sufficient for its intended use. Method validation results can be used to assess the efficiency, reliability and accuracy of analytical findings. Validation of the developed analytical method was carried out following the guidelines set by International Conference on Harmonization (ICH) which is known as ICH Q2 (R1) guidelines 23. The major validation parameters described in the guidelines like as specificity, linearity, range, precision, accuracy and robustness were studied for validation of the method.
Specificity
Standard solution of S.cumini seeds extract at the concentration of 0.03 μg/mL was analyzed by the proposed method and specificity of the method was studied.
Linearity
Linearity of the method was studied through measuring the absorbance of five standard concentrations of S. cumini seeds extract(0.1-0.5 μg/mL) at 279 nm using ethanol as blank. A calibration curve was plotted between concentrations versus measured absorbance of the extracts and regression analysis was done from the calibration curve.
Precision
Precision was established by evaluation of repeatability, intra-day precision and intermediate precision. To evaluate precision, the absorbance of standard which is S. cumini seeds extract was determined at a concentration of 0.1 μg/mL for 6 (six) times in the same day known as repeatability. The absorbance of 3 (three) concentrations of S. cumini seeds extract standard at a concentration of 0.1 μg/mL, 0.3 μg/mL and 0.5 μg/mL was measured in six let at same day and later on three consecutive days which are known as intra-day precision and inter-day precision respectively.
Accuracy
The accuracy of the proposed method was established by recovery investigation with the addition of known amounts to a pre-analyzed sample solution. For this purpose, known concentrations of S. cumini fruits extract standard solution at a concentration of 0.1, 0.2 and 0.3 μg/mL were added to three pre-analyzed sample solutions respectively which concentration was 0.2 μg/mL. The observed result was used to assess the percentage recovery of the standard. Same process is repeated for three times for each concentration24. The percent recovery was calculated using following equation.
% Recovery = [Ct/Ca] x100
Where,
Ca = Conc. of the S. cumini after standard addition;
Ct = Conc. S. cumini in the test sample
Range
Five different concentration of S. cuminiseeds (0.1 μg/mL,0.2 μg/mL,0.3 μg/mL,0.4 μg/mL and 0.5μg/mL) were used for the assessment of the range of the method.
Robustness
Robustness of the method was studied by analyst to analyst variation and instrument to instrument variation studies. For this purpose, the value of absorbance 0.5 μg/mL standard S. cumini seeds was estimated and % RSD (percentage of relative standard deviation) values were calculated between them (first analyst and second analyst; UV-spectrophotometer of model UV-1800 and UV-1240V).
Use of proposed method for estimation of S. cumini seeds in marketed preparation
0.263 ml S. cumini seed containing market preparation, equivalent to 10 mg S. cumini seed extract was measured and transferred in a separating funnel. 10 ml water was added to it and extracted with 15 ml of Chloroform. Then the aliquot was filtered using Whatman No. 1 filter paper and the filtrate was collected. For better extraction, addition of ethanol and volume was adjusted up to 100 ml with ethanol. This solution was used as stock for further analysis. A test solution was prepared having concentration of 0.5 μg/mL using ethanol as diluent. The absorbance of the solution was measured at 279 nm wavelength against ethanol as blank.
Statistical analysis
All the observed results have been shown as Mean ± Standard deviation and % RSD.
Results and Discussion
Method development
Different solvents like methanol, ethanol and ethyl acetate were used to determine the solubility, peak quality and peak shape of the studied drug. Among these, ethanol fulfilled all criteria in showing better solubility and giving better peak quality. The sample showed maximum absorbance at 279 nm which is shown in Figure 1.
Method validation
The developed method was validated according to the rules of ICH Q2 (R1) guidelines and the found results were summarized in Table 1.
Table 1: Obtained results of validation parameters by developed UV method.
| Validation parameters | Obtained results |
| Absorption maxima (λmax) | 279 nm |
| Limit of Beer’s Law (μg/mL) | 0.1-0.5 |
| Equation for Regression (y=mx +c) | y = 1.3273x + 0.0441 R² = 0.9914 |
| Slope | 1.3273 |
| Intercept | 0.0441 |
| Correlation coefficient | 0.9914 |
| % RSD of Repeatability, (n=6) | 0.7950 |
| Accuracy | 99.647-101.767% |
| Precision (% RSD) | Intra-day = 0.924; 0.571; 0.467
Inter-day= 0.892; 0.835;0.342 |
|
Robustness (% RSD) |
0.825; 0.361 |
Specificity
The ability of an analytical method to reliably measure an analyte in the presence of interferences that may be present in the sample matrix is referred to as specificity. It signifies that the presence of excipients in formulation does not interfere with the drug peak. The result of specificity is represented at figure 1 and the result indicates the proposed method was found specific and selective for the drug.
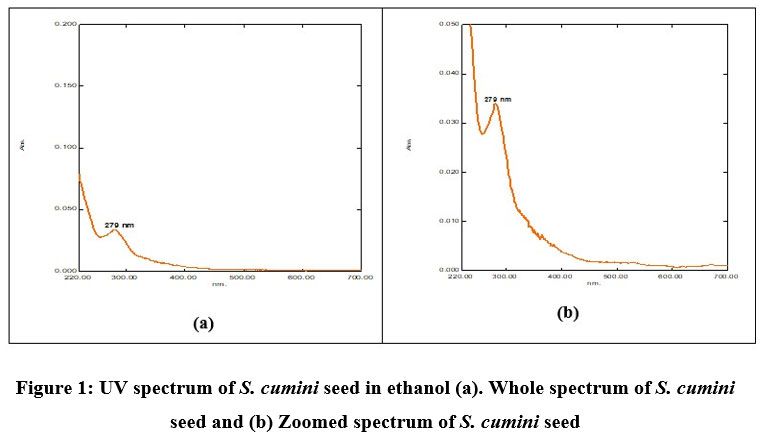 |
Figure 1: UV spectrum of S. cumini seed in ethanol (a). Whole spectrum of S. cumini seed and (b) Zoomed spectrum of S. cumini seed. |
Linearity and range
Linearity refers to a method’s ability to achieve test results that are proportional to the analyte concentration in the sample. The range of an analytical method is the distance between the upper and lower levels that have been demonstrated to be calculated with precision, accuracy, and linearity using the set method.
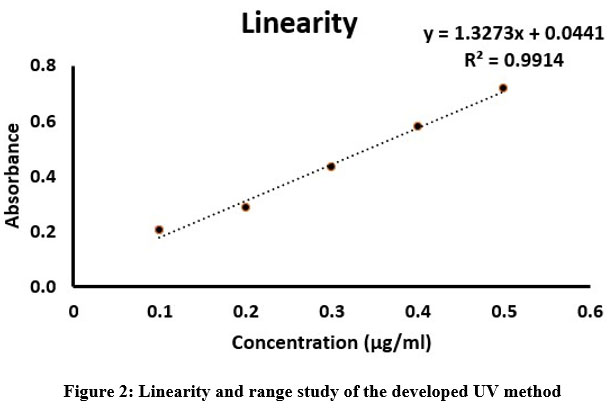 |
Figure 2: Linearity and range study of the developed UV method. |
A good linear correlation was achieved between absorbance and concentration in the range of 0.1 – 0.5 µg/ml. A linear regression equation was found to having a slope of 1.327, intercept of 0.0441 and the coefficient of correlation value is 0.9914 (Figure 2). The result of linearity is represented in Table 2
Table 2: Linearity and range study of the developed UV method.
| S. cumini seed standard conc. (μg/mL) | Absorbance (279 nm) (Mean±SD) | % RSD |
| 0.1 | 0.201±0.002 | 1.034 |
| 0.2 | 0.283±0.003 | 0.935 |
| 0.3 | 0.432±0.003 | 0.694 |
| 0.4 | 0.577±0.005 | 0.794 |
| 0.5 | 0.718±0.003 | 0.418 |
Precision
The degree of agreement among individual test results, when a procedure is replicated on multiple samples of the same homogeneous sample is called precision. Precision is calculated by injecting a set of standards or examining several samples from a homogeneous lot. Precision as relative standard deviation (percent RSD) is determined using the observed standard deviation (SD) and Mean values. Precision can be established through determination of intraday precision, inter-day precision and repeatability. Intraday precision refers to the use of an analytical technique in a laboratory over a short period of time by the same operator with the same equipment, while inter-day precision refers to the calculation of differences in analysis when a process is used in a laboratory on various days by different analysts. A selected concentration 0.1 µg/ml, 0.3 µg/ml and 0.5 µg/ml were analysed in six-let for intra-day and inter-day precision and 0.1 µg/ml was analysed for repeatability. The obtained results of precision (intraday precision, inter-day precision and repeatability are represented in Tables 3 The value of Standard Deviation, % RSD for the intra-assay precision, intermediate precision and reproducibility for all the three concentration showed an excellent intraday precision, intermediate precision and reproducibility of the proposed method.
Table 3: Results of precision (intermediate precision, intra-day precision and repeatability) of the developed method.
| Intra-day precision of S. cumini seed standard (n=6) | ||
| S. cumini seed standard conc. (µg/ml) | Absorbance (279 nm) | % RSD |
| 0.1 | 0.234±0.002 | 0.924 |
| 0.3 | 0.432±0.002 | 0.575 |
| 0.5 | 0.735±0.003 | 0.467 |
| Inter-day precision of S. cumini seed standard (n=3) | ||
| 0.1 | 0.233±0.002 | 0.892 |
| 0.3 | 0.432±0.004 | 0.835 |
| 0.5 | 0.736±0.002 | 0.004 |
| Repeatability (n=3) | ||
| 0.1 | 0.2250±0.002 | 0.342 |
Accuracy
The accuracy of an analytical method is defined as the degree of closeness of the test results obtained by that method to the true value. It is also known as trueness. Accuracy was determined by injecting a known concentration of standard to a pre-analysed sample using the “method being validated.” The % recovery for the standard addition and reference analysis method for all the three concentration levels found are 101.767% with % RSD 0.644, 101.943% with % RSD 0.7942 and 99.647% with % RSD 0.426. From the obtained result, this high degree of confidence interval signifies that any small change in the sample concentration can be accurately determined with high level of accuracy. The results found from the standard addition and reference analysis method were also found signifies the accuracy of the proposed method.
Table 4: Accuracy study data of the developed UV method.
| Starting amount
of S. cumini seed (μg/mL) |
Added amount of S. cuminiseed (μg/mL) | Expected conc. (μg/mL) | Obtained conc. (μg/mL) | Residual conc. (μg/mL) | mean recovery percentage | % RSD |
| 0.2 | 0.1 | 0.3 | 0.305 | 0.005 | 101.767 | 0.694 |
| 0.2 | 0.2 | 0.4 | 0.408 | 0.008 | 101.943 | 0.794 |
| 0.2 | 0.3 | 0.5 | 0.498 | 0.002 | 99.647 | 0.425 |
Robustness
The terms robustness is an analytical method’s ability to remain unaffected by minor changes in its parameters. The results of robustness are shown in Tables 5.
Table 5: Robustness study of the developed UV method by analyst and instrument.
| Studied parameters | Absorbance at 279nm
(Mean±SD) |
% RSD between sample | Mean Recovery percentage | % RSD between two analysts |
| Analyst 1 | 0.718±0.003 | 0.425 | 101.531 | 0.825 |
| Analyst 2 | 0.710±0.002 | 0.282 | 100.353 | |
| Instrument 1 | 0.717±0.005 | 0.688 | 101.296 | 0.361 |
| Instrument 2 | 0.720±0.002 | 0.289 | 101.814 |
To study robustness, the same sample of same at a same concentration (0.5 μg/mL) was analyzed in triplicate by two different analysts (first and second analysts) and in two different instruments (UV-Jasco V-630 and UV-Secom am XTD6). The values of % RSD in both the parameters appeared to be <2 %. This result confirms robustness of the method.
Estimation of S. cumini seed in market preparation
The result of the assay of S. cumini seed in market preparation is shown in Table 6.
Table 6: Assay results for S. cumini seed estimation in S. cumini seed market preparation.
| Formulation | Tested conc. of S. cumini seed in market preparation | Absorbance at 279 nm
(Mean ± SD) |
% RSD | Observed conc. of S. cumini seed in market preparation | Mean recovery
percentage |
| A | 0.5 μg/mL | 0.614±0.0035 | 0.574 | 0.416μg/mL | 83.152 |
| B | 0.5 μg/mL | 0.634±0.0050 | 0.973 | 0.434μg/mL | 86.821 |
| C | 0.5 μg/mL | 0.659±0.0040 | 0.607 | 0.045μg/mL | 90.082 |
The developed method has been successfully used to estimate S. cumini seed in market preparations. A, B, C three market preparations were collected from the market and the percentage of S. cumini seed was determined. It was found to be 83.152 %, 86.821 % and 90.082 % with % RSD value 0.574, 0.973 and 0.607 respectively as shown in Table 6.
Conclusions
In conclusion, a simple, reliable, accurate and reproducible method has been developed and validated for analysis of S. cumini seed containing formulation. The developed method needs low cost, have faster speed with satisfactory precision. The method also has good specificity. The developed method was successfully validated following the guidelines of ICH and it could be employed for quality control analysis of S. cumini seed in market preparation.
Acknowledgment
The authors would like to thank the Department of Pharmacy, Southeast University, Banani, Dhaka, Bangladesh for providing all the facilities to perform the research work.
Conflict of Interest
The authors declare that there are no conflicts of interest.
Funding Sources
This research is conducted through self funding.
Reference
- Pan SY, Litscher G, Gao SH, Zhou SF, Yu ZL, Chen HQ, Zhang SF, Tang MK, Sun JN, Ko KM. Historical perspective of traditional indigenous medical practices: the current renaissance and conservation of herbal resources. Evidence-Based Complementary and Alternative Medicine. 2014 Apr 27;2014.
CrossRef - Gilani AH and Rahman A. Trends in ethnopharmacology. Journal of Ethnopharmacology. 2005;100 (1-2):43–49.
CrossRef - Traditional Medicine Strategy.World Health Organization; Geneva, 2002.2002-2005.
- Zidorn C, Schubert B. and Stuppner H. Altitudinal differences in the contents of phenolics in flowering heads of three members of the tribe Lactuceae (Asteraceae) occurring as introduced species in New Zealand. Biochemical systematics and ecology. 2005;33(9):855-872.
CrossRef - Kumar T, Chandrashekar KS, Tripathi DK, Nagori K, Puri S, Agrawal S, Tamsil AJ. Standardisation of “GokshuradiChurna”: Anayurvedic polyherbal formulation. Journal of Chemical and Pharmaceutical Research. 2011;3(3):742–749.
- Meena AK, Mangal AK, Rao et al. Evaluation of Standardization Parameters for SitopaladiChurna an Ayurvedic Formulation. Asian Journal of Research in Chemistry.2011;4(12):1867-1871.
- Srivastava Y, Bhatt H, Gupta O, and Gupta P. Hypoglycemia induced by Syzygium cumini seeds in diabetes mellitus. Asian Med. J. 1983;26:489–492.
- Stefanello M E, Pascoal AC and Salvador MJ. (2011). Essential oils from neotropical Myrtaceae: chemical diversity and biological properties. Chem. Biodivers.2011;8:73–94.
CrossRef - Ayyanar M & Subash BP. Syzygiumcumini (L.) Skeels: A review of its phytochemical constituents and traditional uses. Asian Pacific journal of tropical biomedicine. 2012;2(3):240–246.
CrossRef - Timbola AK, Szpoganicz B, Branco A, Monache FD and Pizzolatti MG. A new flavonol from leaves of Eugenia cuminibolana. Fitoterapia.2002;73: 174–176.
CrossRef - Ruan ZP, Zhang LL and Lin YM. Evaluation of the antioxidant activity of Syzygium cumini leaves. Molecules. 2008; 13:2545–2556.
CrossRef - Mahmoud II, Marzouk MS, Moharram FA, El-Gindi MR, Hassan AM. Acylated flavonol glycosides from Eugenia jambolana leaves. Phytochemistry. 2001 Dec 1;58(8):1239-44.
CrossRef - Sengupta P, Das PB. Terpenoids and related compunds part IV triterpenoids the stem-bark of Eugenia S. cuminibolana Lam. Indian Chem Soc. 1965;42:255–258.
- Bhargava KK, Dayal R, Seshadri TR. Chemical components of Eugenia S. cuminibolana stem bark. Curr Sci. 1974;43:645–646.
- Kopanski L, Schnelle G. Isolation of bergenin from barks of Syzygiumcumini. Plant Med. 1988;54:572.
CrossRef - Bhatia IS, Bajaj KL. Chemical constituents of the seeds and bark of Syzygiumcumini. Plant Med. 1975;28:347–352.
CrossRef - Ramya S, Neethirajan K and Jayakumararaj R.Profile of bioactive compounds in Syzygiumcumini–a review. J. Pharm. 2012;5:4548–4553
- Sapana SK, Jadhav VM & Kadam VJ. Development and validation of HPTLC method for determination of 3-hydroxy androstane [16, 17-C](6′ methyl, 2′-1-hydroxy-isopropene-1-yl) 4, 5, 6 H pyran in S. cuminibul seed (Syzygium cumini). International Journal of PharmTech Research. 2009;1(4):1129-1135.
- Jagetia GC. Phytochemical Composition and pleotropic pharmacological properties of cuminiun,Syzygiumcumini skeels. Journal of exploratory research in pharmacology. 2017;2(2):54-66.
CrossRef - Sagrawat H, Mann AS, Kharya MD. Pharmacological potential of Eugenia jambolana: a review. Pharmacogn Mag 2006: 2(6):96–105.
- Singh M, Kamal YT, Tamboli ET, Parveen R, Siddiqui KM, Zaidi SM et al. Simultaneous estimation of gallic acid, ellagic acid, and ascorbic acid in Emblica officinalis and in unani polyherbal formulations by validated HPLC method. Journal of Liquid Chromatography & Related Technologies. 2012;35(17):2493-502.
CrossRef - Shailajan S. Quality evaluation and standardization of a traditional unani formulation Jawarish‑e‑Amla Sada. International Journal of Green Pharmacy. 2015;9(1):21-5.
CrossRef - Guideline ICH. Validation of analytical procedures: text and methodology. Q2 (R1). 2005;1:1-5.
- Singh A and Vasudeva Rao A. Development and validation of UV-spectrophotometric method for the estimation of curcumin in standardised polyherbal formulations. Journal of Young Pharmacists. 2017;9(4): 491.
CrossRef

