
Manuscript accepted on :15-01-2022
Published online on: 20-01-2022
Plagiarism Check: Yes
Reviewed by: Dr. Belayneh Kefale
Second Review by: Dr. Ankur Singh Bist
Final Approval by: Dr Patorn Piromchai
Sandeep K. Immadisetty and Aparna P. Patange*
Department of General Medicine, Krishna Institute of Medical Sciences (Deemed to be University), Karad, Maharashtra, India - 415110.
Corresponding Author E-mail: kimssubmission1@gmail.com
DOI : https://dx.doi.org/10.13005/bpj/2381
Abstract
Background Diabetic ketoacidosis (DKA) is one of the most severe complications of diabetes mellitus (DM). Arterial blood gas analysis (ABGA) has been used as a conclusive diagnostic test for DKA. However, ABGA sampling is technically challenging, painful and may cause multiple complications. Venous blood gas analysis (VBGA) is a minimally invasive alternative for ABGA; however, the correlation between ABGA and VBGA has been controversial. Thus, the correlation between arterial and venous pH, partial pressure of CO2 (PCO2), and bicarbonate (HCO3) was studied. Objective To determine whether VBGA can replace ABGA in the evaluation of patients presenting with DKA. Material and Methods The present observational study was carried out in 76 patients with DKA. Two samples for ABGA and VBGA were obtained from each patient as close to each other as possible and were immediately sent to the laboratory. Data analysis was done using Pearson’s correlation coefficient (R) and Bland and Altman plots. Results The Bland and Altman plots and Pearson’s correlation coefficient depicted excellent agreement between arterial and venous pH (R = 0.69) and acceptably good agreement between arterial and venous PCO2 (R = 0.93) and HCO3 (R = 0.82). Conclusion Thus, VBGA can be used in the initial diagnosis and evaluation of DKA, allowing the utilisation of a minimally invasive, safer option to ABGA.
Keywords
Blood Gas Analysis; Diabetic Ketoacidosis; Diagnostic Tests; Hydrogen-Ion Concentration
Download this article as:| Copy the following to cite this article: Immadisetty S. K, Patange A. P. Comparison of Blood Gas and Acid–Base Measurement in Arterial and Venous Blood Samples in Patients with Diabetic Ketoacidosis. Biomed Pharmacol J 2022;15(1) |
| Copy the following to cite this URL: Immadisetty S. K, Patange A. P. Comparison of Blood Gas and Acid–Base Measurement in Arterial and Venous Blood Samples in Patients with Diabetic Ketoacidosis. Biomed Pharmacol J 2022;15(1). Available from: https://bit.ly/3KuChnd |
Introduction
Diabetes mellitus (DM) is a group of common metabolic disorders characterized by hyperglycaemia. It is due to a defect in insulin action, insulin secretion or both. A host of genetic and environmental factors are responsible for this. Diabetes as well as the complications arising from it are major causes of death in many countries (Trachtenbarg, 2005).
Diabetic Ketoacidosis (DKA) is one of the most severe complications of DM characterized by hyperglycaemia, ketonemia, ketonuria, and metabolic acidosis (Trachtenbarg, 2005; Jameson et al., 2018). The annual incidence in the western countries has been reported as 4.6 cases per 100,000 of patients with DM and 0.14 cases per 100,000 of the general population (Ganie et al., 2012). Although inpatient mortality rates in western countries are low (< 1%), 30% of hospitalised DKA cases result in inpatient death in India (Farsani et al., 2017). This metric proves the severity of this complication in India.
DKA is biochemically characterised by hyperglycaemia (blood glucose > 250 mg/dL), a blood pH of < 7.30, and a bicarbonate (HCO3) level of ≤ 18 mmol/L and can be categorized as mild (pH 7.25–7.30, HCO3 15–18 mmol/L), moderate (pH 7–7.24, HCO3 < 10 mmol/L) or severe (pH of < 7, HCO3 < 10 mmol/L) (Trachtenbarg et al., 2005; Cashen and Petersen, 2019). Arterial blood gas analysis (ABGA), which measures the blood pH, partial pressure of CO2 (pCO2), and bicarbonate (HCO3) levels, is an essential diagnostic test in patients with suspected DKA as metabolic acidosis is a prominent feature of DKA (Kitabchi and Wall, 1995; Gokel et al., 2000).
However, arterial blood sampling is a technically challenging and painful procedure associated with risks such as haemorrhage, pain, artery damage or thrombosis, infection, aneurysm formation, and even loss of limb function. Additionally, it increases the risk of needlestick injury to the healthcare personnel (Roberts et al. 2017; Mortensen, 1967). Therefore, many studies have tried to search for an alternative to ABGA and have compared arterial and venous blood gas in patients with DKA in an attempt to eliminate ABGA in the initial diagnosis and evaluation of DKA (Gokel et al., 2000; Brandenburg and Dire, 1998; Kelly, 2006) Venous blood gas analysis (VBGA) is a minimally invasive procedure that bypasses all the complications of ABGA. Although the correlation between arterial and venous blood parameters (especially pH) is well established, several studies have conflicting opinions on the same (Kelly, 2006; Brashear et al., 1979).
Therefore, this study was designed to determine whether VBGA could replace ABGA as the initial diagnostic measure in patients with DKA by correlating the values.
Material and Methods
Study design
The present cross-sectional, observational, comparative study was conducted on 76 patients above 18 years of age with DKA admitted to the medical emergency ward of a tertiary care centre in Karad, Maharashtra from November 2017 to May 2019 after institutional ethics committee clearance was obtained. Farsani et al., (2017) conducted a systematic review on the incidence and prevalence of DKA, and reported an overall prevalence of 50–100 events per 1000 adult patients of DM. Hence, the error of the study was set at 5% and the power of the study was set at 95%. Using the formula for cross-sectional studies,
N=4pq/d2
the sample size came to 76 patients. Sample allocation was done using convenient sampling technique. Patients > 18 years with random blood sugar > 250 mg/dl, urinary ketone bodies, HCO3 level < 18 mmol/L, and pH < 7.35 with known or newly detected DM (Type 1/Type 2) were included in the study. Patients not fulfilling the abovementioned criteria were excluded from the study. Data were recorded in the study proforma of consenting individuals.
Data collection
A pre-tested validated proforma was developed to collect data for the research purpose. A detailed case history of the patient was taken including chief complaint, history of present illness, family and medical history; a thorough clinical examination was performed; and the necessary investigations (blood and urine tests) were done.
A sample of arterial blood (0.5–1.0 mL) for ABGA was obtained from the radial artery of the patient using a 2.5-ml syringe (Dispovan, India) (Lwanga and Lemeshow, 1991) whereas a sample of venous blood (0.5–1.0mL) for VBGA was obtained from a peripheral vein at the time of venepuncture for other laboratory reports. The two blood gas samples were obtained as temporally close to each other as possible before the initiation of treatment and were immediately sent to the laboratory.
Statistical Analysis
Data were analysed using the statistical software R version 3.6.3 and MS Excel. Categorical variables such as age group, type of DM, severity of DKA, and clinical symptoms were represented by frequency tables and continuous variables were represented by mean ± SD form. The strength of association between arterial and venous pH, PCO2, and HCO3 was measured using Pearson’s correlation coefficient (R). A P-value less than or equal to 0.05 was considered statistical significance. The degree of agreement between the arterial and venous measurements were evaluated on Bland and Altman plots.
Results
Table 1 presents the demographic variation and characteristics of the patients with DKA. Of the total 76 patients, 53 (69.74%) were males and 23 (30.26%) were females, with a mean age of 55.99 ± 16.19 years. Out of 76 patients, 9 (11.84%) had type 1 DM and 67 (88.16%) had type 2 DM. Also, 59 (77.63%) patients were known cases of DM and 17 (22.37%) were newly diagnosed cases of Diabetes Mellitus on admission.
Out of 76 patients, 35 (46.05%) patients had mild DKA and 9 (11.84%) patients had severe DKA, whereas 15 (19.74%) patients had mild hyperglycaemia (RBS 250-350 mg/dl) and 26 (34.21%) patients had severe hyperglycaemia (RBS >450 mg/dl). The mean RBS was 415.55 ± 79.37 mg/dl.
Table 1: Demographic Variation and Characteristics of Patients with Diabetic Ketoacidosis
| Distribution of patients based on Age and Gender | ||||||||
| Age Group | Number of Patients | |||||||
| Male | Female | Total | ||||||
| <20 | 1 (1.32%) | 1 (1.32%) | 2 (2.63%) | |||||
| 21-30 | 3 (3.95%) | 2 (2.63%) | 5 (6.58%) | |||||
| 31-40 | 4 (5.26%) | 3 (3.95%) | 7 (9.21%) | |||||
| 41-50 | 11 (14.47%) | 2 (2.63%) | 13 (17.11%) | |||||
| 51-60 | 12 (15.79%) | 6 (23.68%) | 18 (23.68%) | |||||
| >60 | 22 (28.95%) | 9 (40.79%) | 31 (40.79%) | |||||
| Total | 53 (69.74%) | 23 (30.26%) | 76 (100%) | |||||
| Distribution of patients based on History of Diabetes Mellitus | ||||||||
| Type of DM | Number of Patients | |||||||
| Known case of DM | Newly diagnosed DM | Total | ||||||
| Type1 | 5 (6.58%) | 4 (5.26%) | 9 (11.84%) | |||||
| Type2 | 54 (71.05%) | 13 (17.11%) | 67 (88.16%) | |||||
| Total | 59 (77.63%) | 17 (22.37%) | 76 (100%) | |||||
| Distribution of patients based on clinical symptoms | ||||||||
| Clinical symptoms | Number of Patients | |||||||
| Abdominal pain | 35 (46.05%) | |||||||
| Breathlessness/Dyspnea | 19 (25%) | |||||||
| Nausea/Vomiting | 34 (44.74%) | |||||||
| Distribution of patients based on Severity of DKA and Random Blood Sugar | ||||||||
| Sub-Category | Number of Patients | |||||||
|
Severity of Diabetic Ketoacidosis |
Mild (pH 7.25-7.35 and HCO3 15-18) | 35 (46.05%) | ||||||
| Moderate (pH 7.00-7.25 and HCO3 10-15) | 32 (42.11%) | |||||||
| Severe (pH <7.00 and HCO3 <10) | 9 (11.84%) | |||||||
|
Random Blood Sugar |
250-350 mg/dl | 15 (19.74%) | ||||||
|
351-450 mg/dl |
35 (46.05%) |
|||||||
| >450 mg/dl |
26 (34.21%) |
|||||||
Table 2 exhibits the pH range, PCO2 range, and HCO3 range in arterial and venous blood. Most of the patients had a pH range between 7.00–7.25 in both arterial and venous blood (i.e. 48.68% and 46.05% respectively). Also, the HCO3 range was > 15 in both arterial and venous blood (i.e. 56.58% and 64.47%, respectively).
Table 2: pH range, PCO2 range and HCO3 range in Arterial and Venous Blood.
| Sub-Category | Number of Patients | ||
| Arterial | Venous | ||
| pH | <7.00 | 5 (6.58%) | 11 (14.47%) |
| 7.00-7.25 | 37 (48.68%) | 35 (46.05%) | |
| 7.25-7.35 | 34 (44.74%) | 30 (39.47%) | |
| PCO2 | <10.00 | 4 (5.26%) | 1 (1.32%) |
| 10.01-15.00 | 4 (5.26%) | 3 (3.95%) | |
| 15.01-20.00 | 14 (18.42%) | 11 (14.47%) | |
| 20.01-25.00 | 19 (25%) | 14 (18.42%) | |
| 25.01-30.00 | 13 (17.11%) | 21 (27.631%) | |
| 30.01-35.00 | 9 (11.84%) | 8 (10.53%) | |
| > 35.00 | 13 (17.11%) | 18 (23.68%) | |
| HCO3 | 10.01-15.00 | 25 (32.89%) | 22 (28.95%) |
| 5.01-10.00 | 8 (10.53%) | 5 (6.58%) | |
| > 15.00 | 43 (56.58%) | 49 (64.47%) | |
Figure 1 depicts the Bland-Altman plots for arterial and venous pH, PCO2, and HCO3. Figure 1a illustrates that majority of the points lie within the interval and are close to the line representing mean difference. Hence, there was excellent agreement between Arterial pH and venous pH. Figure 1b illustrates that majority of the points lie within the interval but are scattered. Hence, there was acceptably good agreement between Arterial PCO2 and Venous PCO2. Figure 1c illustrates that, majority of the points lie within the interval but are scattered. Hence, there was acceptably good agreement between Arterial HCO3 and Venous HCO3.
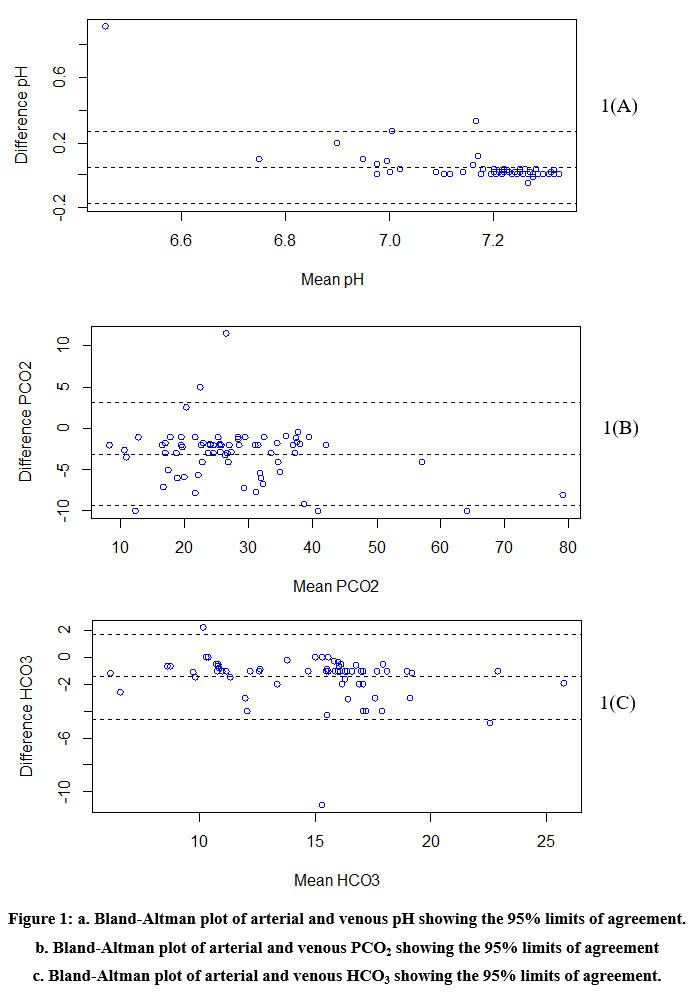 |
Figure 1: a. Bland-Altman plot of arterial and venous pH showing the 95% limits of agreement. b. Bland-Altman plot of arterial and venous PCO2 |
Pearson’s Correlation test proves that there was significantly high positive correlation between arterial parameters and venous parameters (Table 3). The scatter plots in Figure 2 depict the same.
Table 3: Correlation of arterial and venous pH, PCO2, and HCO3.
| Parameters | Correlation | p-value |
| pH | 0.83 | < 0.001* |
| PCO2 | 0.96 | < 0.001* |
| HCO3 | 0.91 | <0.001* |
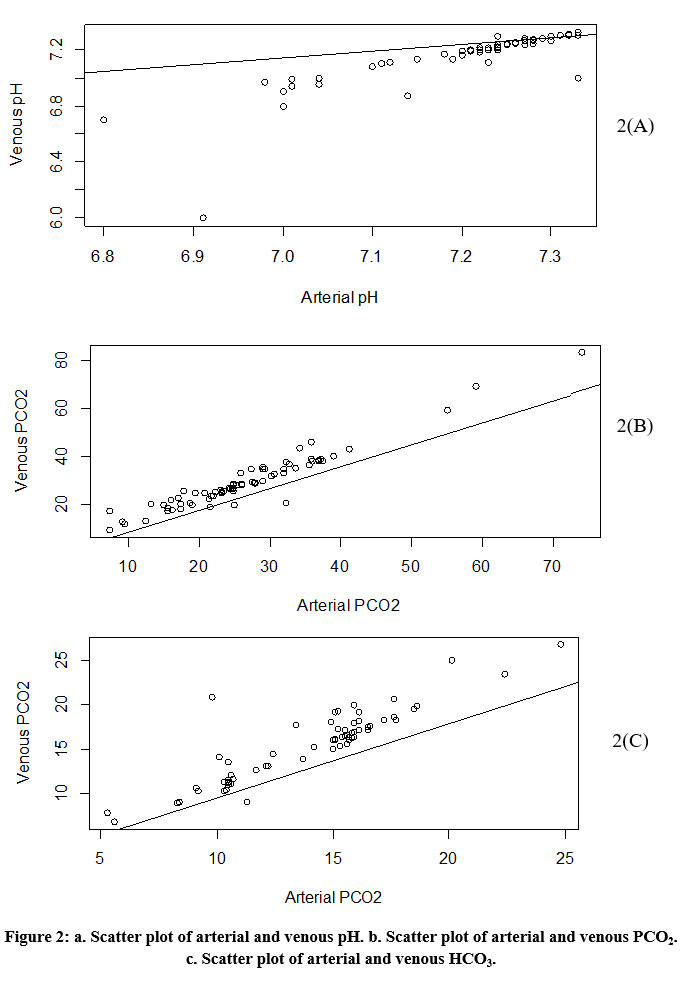 |
Figure 2: a. Scatter plot of arterial and venous pH. b. Scatter plot of arterial and venous PCO2. c. Scatter plot of arterial and venous HCO3. |
Table 4: Summary of Simple linear regression models.
| Response | Predictor | Estimate | p-value | Coefficient of Determination (R2) |
| Arterial pH | Intercept | 3.78 | < 0.001* | 0.69 |
| Venous pH | 0.48 | < 0.001* | ||
| Arterial PCO2 | Intercept | -0.33 | 0.726 | 0.93 |
| Venous PCO2 | 0.91 | < 0.001* | ||
| Arterial HCO3 | Intercept | 1.21 | 0.0943 | 0.82 |
| Venous HCO3 | 0.83 | < 0.001* |
Table 4 gives the summary of the simple linear regression models. The regression analysis demonstrated that arterial pH increased by 0.48 as venous pH increased by a unit, and venous pH explained 69% of variation in arterial pH.
The arterial PCO2 increased by 0.91 as venous PCO2 increased by a unit, and venous PCO2 explained 93% of variation in arterial PCO2.
The arterial HCO3 increases by 0.83 as venous HCO3 increases by a unit. Venous HCO3 explains 82% of variation in Arterial HCO3.
Discussion
ABGA is often used as a confirmative test for DKA. However, due to the several associated complications with this test, VBGA is being investigated as an alternative diagnostic test for DKA. Thus, this study attempts to correlate the ABGA and VBGA findings in 76 patients with DKA.
The mean age of patients in our study was 56 years with 41% being above 60 years. This finding was concurrent with a study by Lee et al. who reported a peak in the incidence of DKA in patients in their fifties. This may be probably because patients in their fifties are usually long-standing diabetics, increasing the probability of absolute insulin deficiency and thus DKA. However, he also reported a peak in DKA incidence in the twenties which is contrary to the findings of this study (Lee et al., 1987). The present study reports a marked male predilection for DKA (69.74% male). This finding was concurrent with a study by Elleman et al., (1984) whereas it was contrary to the findings of (Lee et al., 1987) who reported that DKA is more common among females.
DKA mainly occurs in patients with type 1 DM because these patients present with a complete lack of insulin that inhibits gluconeogenesis and glycogenolysis. However, in insulin resistant states (Type 2 DM), the body remains sensitive to the anti-lipolytic effects of insulin. Thus, patients with type 2 DM are rarely affected (Barski et al., 2013; Puttanna et al., 2014)). However, this finding has been challenged in larger number of patients with type 2 DM presenting with DKA. This was aptly seen in a study by Balasubramanian et al, (1999) who reported that 39% of the patients with DKA in their study had Type 2 DM (Balasubramanyam et al., 1999). A remarkable finding in our study was that a majority of the patients presenting with DKA (88%) had type 2 DM. In our study, 22.4% of patients presenting with DKA were newly diagnosed as DM. This finding was mirrored in studies by Elleman et al., (1984). The majority of the patients presented with mild to moderate DKA, whereas 12% presented with severe DKA.
In the present study, there was excellent agreement between Arterial pH and venous pH, and acceptably good agreement between arterial and venous PCO2 and HCO3. This finding was concurrent with Kelly (2006) in the author’s review on the validity of VBGA in DKA. However, some studies such as the one by Brashear et al., (1979) have not shown good correlation. The reasons for the contrasting findings may be the differing sample size, geographic location, the method used for sample collection, and the experience level and expertise of the pathologist. ABGA is considered essential in patients with suspected DKA. VBGA is an alternative method of estimating pH and blood gas values. It has several advantages over ABGA such as the lower rate and severity of complications, quicker and easier to perform than ABGA, and it is safe in hemodynamically unstable patients (Singh et al., 2013).
If arterial and venous pH, pCO2, and HCO3 values show high correlation and a high level of agreement in patients presenting with DKA, ABGA can be eliminated for VBGA in the conclusive diagnosis of DKA. Although we found excellent correlation and a high level of agreement in values of arterial and venous pH only, the agreement was lesser between PCO2 and HCO3. However, as the correlation between PCO2 and HCO3 was in a good range, this study recommends VBGA in the initial diagnosis and evaluation of DKA. This study has certain limitations such as the small sample size and the single centre design of the study. Additionally, the cross-sectional design of the study with no follow-ups may also be considered a limitation. Thus, a prospective, multicentric study with a larger sample size would further strengthen the correlation between arterial and venous blood gas parameters. Furthermore, a comparative prospective study between two groups with DKA, one diagnosed with VBGA and the other with ABGA would further underline the advantages of VBGA.
Conclusion
Although studies have stated that DKA mainly occurs in patients with type 1 DM, this study presented with a majority of patients with DKA as suffering from type 2 DM. Excellent correlation and a high level of agreement was found between values of arterial and venous pH, whereas good agreement was found between arterial and venous PCO2 and HCO3. This suggests that a minimally invasive method such as VBGA with no or minimal complications can be used as an alternative to ABGA in the diagnosis of DKA, thus reducing the chances of morbidity while diagnosing DKA.
Acknowledgment
None
Conflict of Interest
There is no conflict of interest.
Funding Sources
There is no funding source.
References
- Balasubramanyam, A., Zern, JW., Hyman, DJ., Pavlik, V. (1999). New profiles of diabetic ketoacidosis: Type 1 vs type 2 diabetes and the effect of ethnicity. Archives of Internal Medicine. 159(19):2317–22.
CrossRef - Barski, L., Nevzorov, R., Jotkowitz, A., Rabaev, E., Zektser, M., Zeller, L. (2013). Comparison of Diabetic Ketoacidosis in Patients with Type-1 and Type-2 Diabetes Mellitus. The American Journal of the Medical Sciences. 345(4):326-330.
CrossRef - Brandenburg, MA., Dire, DJ. (1998). Comparison of arterial and venous blood gas values in the initial emergency department evaluation of patients with diabetic ketoacidosis. Annals of Emergency Medicine. 31(4):459–65.
CrossRef - Brashear, RE., Oei, TO., Rhodes, ML., Futty, DE., Hostetler, ML. (1979). Relationship between arterial and venous bicarbonate values. Archives of Internal Medicine. 139(4):440–2.
CrossRef - Cashen, K., Petersen, T. (2019). Diabetic Ketoacidosis. Pediatrics in Review. 40(8): 412-420.
CrossRef - Ellemann, K., Soerensen, JN., Pedersen, L., Edsberg, B., Andersen, OO. (1984). Epidemiology and treatment of diabetic ketoacidosis in a community population. Diabetes Care. 7(6):528–32.
CrossRef - Farsani, SF., Brodovicz, K., Soleymanlou, N., Marquard, J., Wissinger, E., Maiese, BA. (2017). Incidence and prevalence of diabetic ketoacidosis (DKA) among adults with type 1 diabetes mellitus (T1D): a systematic literature review. BMJ Open. 7:e016587.
CrossRef - Ganie, MA., Koul, S., Razvi, HA., Laway, BA., Zargar, AH. (2012). Hyperglycemic emergencies in Indian patients with diabetes mellitus on pilgrimage to Amarnathji yatra. Indian Journalof Endocrinology and Metabolism. 16(Suppl 1):S87–90.
CrossRef - Gokel, Y., Paydas, S., Koseoglu, Z., Alparslan, N., Seydaoglu, G. (2000). Comparison of Blood Gas and Acid-Base Measurements in Arterial and Venous Blood Samples in Patients with Uremic Acidosis and Diabetic Ketoacidosis in the Emergency Room. American Journal of Nephrology. 20(4):319–323.
CrossRef - Jameson, JL., Fauci, AS., Kasper, DL., Hauser, SL., Longo, DL., Loscalzo, J. (2018) Harrison’s principles of Internal Medicine. 20th ed. Shanahan JF, Davis KJ, editors. United States of America: McGraw-Hill Education: p2870–2872.
- Kelly, A-M. (2006). The case for venous rather than arterial blood gases in diabetic ketoacidosis. Emergency Medicine Australas. 18(1):64–7.
CrossRef - Kitabchi, AE., Wall, BM. (1995). Diabetic ketoacidosis. Medical Clinics of North America. 79(1):9–37.
CrossRef - Lee, HK., Oh, YS., Chung, YH., Yoo, HJ., et al. (1987). Epidemiological Characteristics of Ketoacidosis among Korean Diabetic patients. Journal of Korean Medical Science. 2(1):7–11.
CrossRef - Lwanga, S., Lemeshow, S. (1991). Sample Size Determination in Health Studies. Geneva: World Health Organization. 1-30.
- Mortensen, J. (1967). Clinical Sequelae from Arterial Needle Puncture, Cannulation, and Incision. Circulation. 35(6):1118–23.
CrossRef - Puttanna, A., Padinjakara, RNK. (2014). Diabetic ketoacidosis in type 2 diabetes mellitus. Practical Diabetes. 31(4): 155–158.
CrossRef - Roberts, JR., Custalow, CB., Thomsen, TW. (2017). Roberts and Hedges clinical procedures in emergency medicine and acute care. 7th Edition. Elsevier Saunders. p1541.
- Singh, V., Khatana, S., Gupta, P. (2013). Blood gas analysis for bedside diagnosis. National Journal of Maxillofacial 4(2):136–41.
CrossRef - Trachtenbarg, DE. (2005). Diabetic Ketoacidosis. American Family Physician. 71(9):1705–14.

