
Manuscript accepted on :20-01-2022
Published online on: 19-02-2022
Plagiarism Check: Yes
Reviewed by: Dr. Vijay Kumar Mishra
Second Review by: Dr. Maha Jalal
Final Approval by: Dr. H Fai Poon
Elia Lara-Lona1 , Christian Andrés Díaz-Chávez2, Gilberto Flores -Vargas3, Nicolás Padilla-Raygoza3*, Efraín Navarro-Olivos3, Francisco Javier Martínez-García2 and Daniel Alberto Díaz-Martínez4
1Department of Medicine and Nutrition, Division of Health Sciences, Campus Leon, University of Guanajuato Bvld Puente Milenio 1001Fracción del Predio San Carlos, León, Guanajuato, México CP37670.
2Department of Statistics, General Directorate of Planning and Development, Institute of Public Health of the State of Guanajuato, Camino Antiguo a Marfil #12, Marfil, Guanajuato, Gto. Mexico, CP 36250
3Department of Research and Technological Development, Teaching and Research Directorate, Institute of Public Health from Guanajuato State. Victor Cervera Pacheco 14 Primer Piso Plaza Santa Fé Guanajuato, Gto. Mexico CP36250
4Directorate of Health Services, Institute of Public Health from Guanajuato State, Tamazuca 4, Guanajuato, Gto México CP36000
Corresponding Author E-mail: npadillar@guanajuato.gob.mx
DOI : https://dx.doi.org/10.13005/bpj/2356
Abstract
Due to SARS-CoV-2 infection, which causes COVID-19, the total number of annual deaths increased in Mexico during 2020. To analyze the mortality in the Mexican state of Guanajuato from 2015 to 2020, we designed an ecological study. We used the registries of deaths in the vital statistics database of the Epidemiological and Statistical Subsystem of Deaths that includes age, sex, cause of death, epidemiological week of death as variables. Mortality Rates, Rates Ratios, Difference of Rates, Adjusted Mortality Rates, Adjusted Rates Ratios, and Difference of Rates were computed as part of the statistical analysis. To show the patterns regarding deaths in Guanajuato Sate from 2015 to 2020, we also calculated some dendrograms. The difference between the number of deaths in 2020 and 2019 is 13,286, while, in previous years, the differences were under 3000. The percentage of males that died (59.30%) shows an increment in 2020. Also, the mean age increased in 2020 (62.9 ± 22.56). The gender ratio of deaths (males/females) is greater than 1 in all the age groups except for those over 80. The age and geographic patterns of deaths changed in 2020. The 3rd cause of death among the top 10 leading causes is COVID-19. It has been detected an excess of mortality in 2020, although the integrity of the record is questionable since COVID-19 is an emergent disease. The highest effect is observed among males and older people. This situation has changed the age and geographic patterns of death in Guanajuato state. The long-term consequences on society remain to be observed.
Keywords
Annual mortality; Adjusted mortality rates; Excess of deaths; Mortality rates; Population
Download this article as:| Copy the following to cite this article: Lona E. L, Chávez C. A. D, Vargas G.F, Raygoza N. P, Olivos E. N, García F. J. M, Martínez D. A. D. Characterization of Excess Death in the Mexican State of Guanajuato, During the COVID-19 Pandemic: An Ecological Study. Biomed Pharmacol J 2022;15(1). |
| Copy the following to cite this URL: Lona E. L, Chávez C. A. D, Vargas G.F, Raygoza N. P, Olivos E. N, García F. J. M, Martínez D. A. D. Characterization of Excess Death in the Mexican State of Guanajuato, During the COVID-19 Pandemic: An Ecological Study. Biomed Pharmacol J 2022;15(1). Available from: https://bit.ly/3JNk2YG |
Introduction
“Know your epidemic. Know your response” is a way of generating knowledge about an epidemic and provide this information to public health decision makers 1. Since the outbreak of pneumonia cases in Wuhan, China 2 that was later revealed to be caused by the novel severe acute respiratory distress syndrome coronavirus (SARS-CoV-2) 3, there is a need to analyze the mortality caused by this virus in the inhabitants of the Mexican state of Guanajuato.
The weekly reports of excess of mortality allows to identify the magnitude and direction of the epidemic 1. The application of the recommendation of the World Health Organization (WHO) to analyze excess mortality, during the contingency of the disease caused by the new coronavirus (COVID-19), have benefits and impacts for the population of the state.
SARS-CoV-2 is a beta coronavirus recently detected in humans. It primarily causes a respiratory disease called COVID-19. The clinical manifestation varies from person to person, since symptomatic presentation to signs and symptoms including fever, fatigue, dry cough, respiratory distress, diarrhea, and vomiting. The onset of symptoms occurs from 1-14 days after infection 2.
The ways of transmission include contact, droplets, airbone, and fomite, according to Hu, Ben et al. 2. Being COVID-19 a respiratory disease, the most common complication leading to death is pneumonia. Nevertheless, other complications have been reported, including cardiac and related to chronic kidney disease. Also, comorbidities posing a higher risk includes hypertension, diabetes, and chronic kidney disease. The number of comorbidities and complications are related directly proportional 3.
When this study was carried out, there was no scientific evidence of effective therapies to treat COVID-19 2.
By December 7, 2020, 66,422,058 confirmed cases and 1,532,418 deaths have been reported in the world with a case fatality rate of 2.3%, affecting 219 countries. In Mexico 1,182,249 confirmed cases with 110,074 deaths have been reported for a lethality of 9.3% [4]. In the state of Guanajuato, 69,619 cases have been confirmed and there have been 4,523 deaths for a fatality of 6.5% 5.
The objective of this study was to analyze the excess of mortality during the pandemic, in 2020, in the state of Guanajuato.
Material and methods
An analytical, quantitative, retrolective ecological analysis study through time was designed in the state of Guanajuato, using the vital statistics database of the Epidemiological and Statistical Subsystem of Deaths (ESSD) 6.
Epidemiological and Statistical Subsystem of Deaths (ESSD) integrates mortality information, constituting a framework for epidemiological surveillance; it has national, sectoral and occurrence coverage. Information on the deceased and the death is captured in this system 6.
All the records of deaths in the state of Guanajuato from 2015 to 2020 were included for the analysis. These were the ones with registered death in the mentioned period and grouped by epidemiological week. No registry was excluded.
The following variables were considered: age, sex, cause of death, and epidemiological week of death.
Statistical analysis, descriptive statistics were used for all the variables. For the years under study, it is presented the mortality by sex and age group.
The annual mortality rate was calculated with the number of deaths per year divided by the corresponding population of the state of Guanajuato. Also, the absolute differences in rates were calculated.
To verify the excess mortality of 2020 compared to the years from 2015 to 2019, the number of deaths per epidemiological week from 2015 to 2020 was obtained and a graph with this data was generated.
Differences in rates were generated and compared between consecutive years, to verify excess of mortality.
Adjusted mortality rates were computed for all years using the WHO standard population 7.
For the detection of groups, the hierarchical clustering algorithm was used 8. The characteristics taken as basis for the classification were the geographical distribution of deaths, as well as the distribution of deaths by sex and age group, in each year. Statistical analysis was performed in STATA 13.0 ® (Stata Corp., College Station, TX, USA), R 3.6.3 (R Foundation for Statistical Computing, Vienna, Austria), and Microsoft Excel 365 ® (Microsoft Corp. Redmond, WA, USA).
Results and discussion
The ESSD database includes registries of deaths that occurred since the epidemiological week 1 to the 53, from 2015 to 2020.
Table 1 shows the distribution by sex and age for each year included in the analysis. In all the years, the percentages of deaths corresponding to men were higher that the ones corresponding to women. The highest mean age was 63.91 years, in 2016, and the lowest was 61.84 years, in 2019. The mean age of death, by year, ranged between 61 and 64 years.
Table 1: Distribution by sex and age of annual deaths in the state of Guanajuato.
| Variable | 2015
n % |
2016
n % |
2017 n % |
2018 n % |
2019
n % |
2020 n % |
|
Sex Male Female Unknown |
16,688 55.68
13,280 44.31 3 0.01 |
17,792 55.65
14,168 44.32 11 0.03 |
19,847 56.83 15,060 43.12 16 0.04 |
20,654 57.29 15,372 42.64 28 0.07 |
21,656 57.83 15,763 42.10 27 0.07 |
30,082 59.30 20,621 40.65 29 0.06 |
| Age (years)
Range Mean ± S |
0 a 113
63.65 ± 24.86 |
0 a 112 63.91 ± 24.62 |
0 a 109 62.80 ± 24.87 |
0 a 111 62.13 ± 24.94 |
0 a 112 61.84 ± 24.77 |
0 a 120 62.99 ± 22.56 |
Source: ESSD/GDHI 6
The percentage of deaths by sex shows an increment in the one regarding to males that died in 2020. Also, it is noted that the mean age had an increment in 2020. Figure 1 shows that although the mean age was similar among the studied years, taking as baseline the previous years, the variance decreased in 2020.
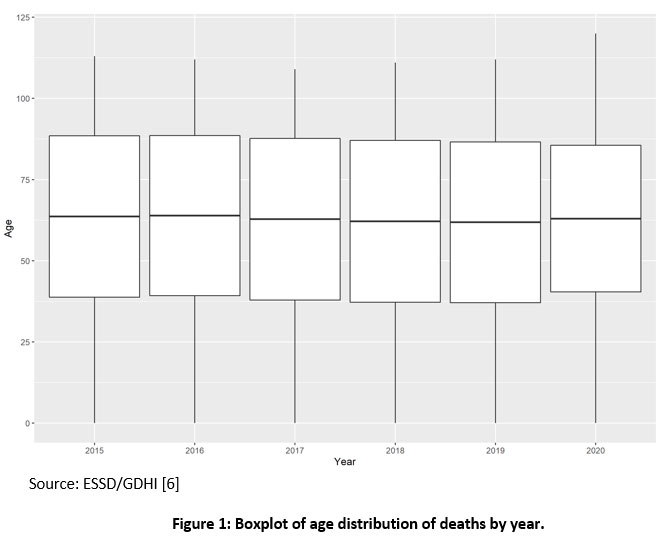 |
Figure 1: Boxplot of age distribution of deaths by year. |
Table 2 shows the ratios between men and women in each year and by age group. In almost all age groups predominated the male sex except for 80-89 years, where is the same between males and females, and the one of 90 or higher were the females predominated.
Table 2: Male/Female ratio of deaths by age group in Guanajuato State
| Variable | 2015 | 2016 | 2017 | 2018 | 2019 | 2020 |
|
Age group (years) 0 – 9 10 – 19 20 – 29 30 – 39 40 – 49 50 – 59 60 – 69 70 – 79 80 – 89 90 + |
1.33 2.82 3.26 2.80 2.00 1.43 1.27 1.15 0.94 0.71 |
1.44 3.06 3.63 3.13 2.00 1.46 1.21 1.13 0.93 0.68 |
1.27 2.62 3.98 3.76 2.36 1.45 1.25 1.18 0.91 0.69 |
1.24 3.12 4.48 4.04 2.41 1.48 1.20 1.12 0.95 0.67 |
1.31 3.51 4.63 3.56 2.56 1.55 1.20 1.12 0.90 0.69 |
1.30 3.47 4.27 3.42 2.35 1.57 1.43 1.25 1.02 0.78 |
Source: ESSD/GDHI 6
Figure 2 shows the percentage of the total deaths per year that represented each age group. It can be observed that in 2020 (solid line), the percentage represented by the age groups between 60 and 75 years old had an increment taking as baseline the percentage from 2019. The percentage represented by the age group from 10 to 49 years old shows high variance among the years.
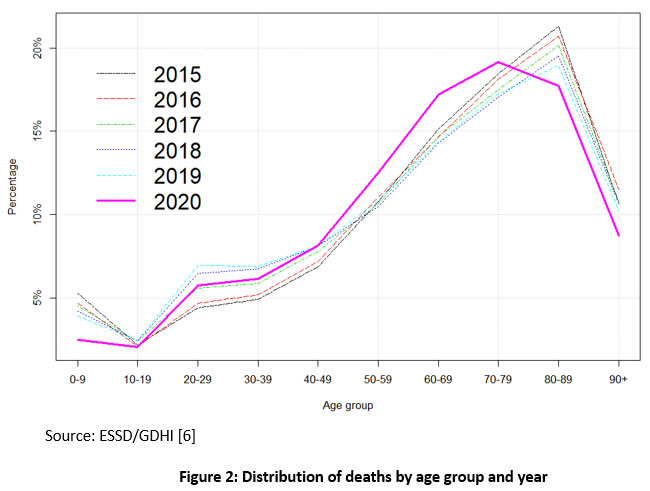 |
Figure 2: Distribution of deaths by age group and year |
The absolute numbers of deaths per year increased notably in 2020, and the Rate Ratio in 2020 increased from 1.02 in 2018 to 1.34 in 2020; In addition, the difference in rates is remarkably high in 2020.
Table 3: Mortality rates / 100,000 inhabitants per year in the state of Guanajuato and rate differences
| 2015 | 2016 | 2017 | 2018 | 2019 | 2020 | |
| Number of deaths | 29,971 | 31,961 | 34,923 | 36,054 | 37,446 | 50,732 |
| Population | 5’930,618 | 5’997,487 | 6’058,569 | 6’117,205 | 6’173,718 | 6,228,175 |
| Rate /100,000 inh. | 505.36 | 532.91 | 576.42 | 589.39 | 606.54 | 814,56 |
| Rate Ratio | — | 1.05 | 1.08 | 1.02 | 1.03 | 1.34 |
| Difference between rates | — | 27.55 | 43.51 | 12.97 | 17.15 | 208.02 |
Source: ESSD/GDHI 6
Figure 3 shows the absolute differences in the number of deaths between each year, and its immediately preceding year. It is visualized the great increase in deaths in 2020 with relation to 2019.
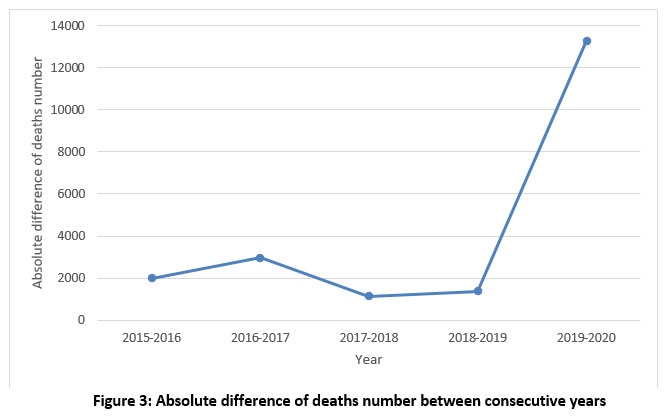 |
Figure 3: Absolute difference of deaths number between consecutive years |
Using the WHO standard population [8], the adjusted mortality rates increased from 29,971 to 37,446 from 2018 to 2019. In 2020 it increased to 50,732, having a difference in adjusted rates of 13,286 (Table 4).
Table 4: Adjusted mortality rates by year in Guanajuato state 2015-2020
| 2015 | 2016 | 2017 | 2018 | 2019 | 2020 | |
| Number of deaths | 29,971 | 31,961 | 34,923 | 36,054 | 37,446 | 50,732 |
| Population* | 100,000 | 100,000 | 100,000 | 100,000 | 100,000 | 100,000 |
| Adjusted Rate /100,000 inh. | 29,971 | 31,961 | 34,923 | 36,054 | 37,446 | 50,732 |
| Rate ratio | — | 1.07 | 1.09 | 1.03 | 1.04 | 1.35 |
| Difference of rates | — | 1,990 | 2,962 | 1,131 | 1,392 | 13,286 |
* Standard population by World Health Organization 8
Source: ESSD/GDHI 6
Figure 4 shows that deaths by epidemiological week remained similar in the years 2015 to 2019, but in 2020 there was a very noticeable excess of deaths between weeks 21 to 53, with a total difference of 13,286 between 2020 and 2019.
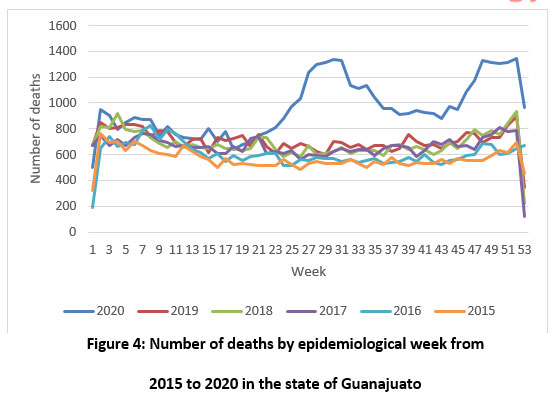 |
Figure 4: Number of deaths by epidemiological week from 2015 to 2020 in the state of Guanajuato |
In figure 5, taking the percentage of deaths by year that represents each municipality, the years were grouped using the hierarchical clustering algorithm. It is shown that even geographically, the distribution of deaths has changed in 2020. It is also shown that the years 2018 and 2019, and 2015 and 2016 are similar among them.
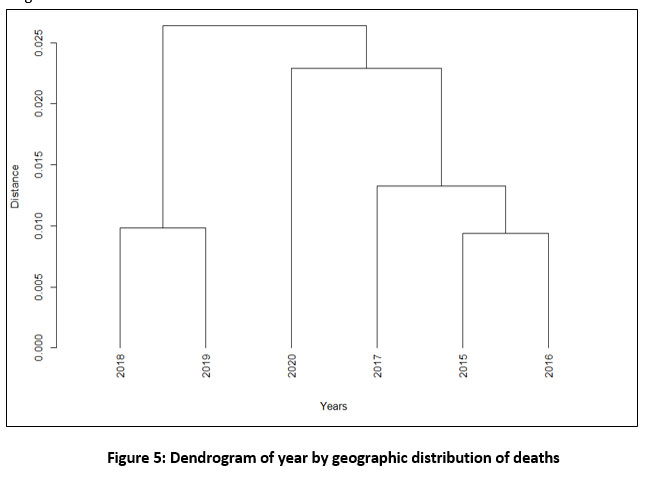 |
Figure 5: Dendrogram of year by geographic distribution of deaths |
In figure 6, taking the percentage of deaths corresponding to females by year in each age group, the years were grouped using the hierarchical clustering algorithm. It is shown that the distribution of deaths by sex and age group has changed in 2020. It is also shown that the years 2018 and 2019, and 2015 and 2016 are similar among them.
 |
Figure 6: Dendrogram of distribution of deaths by age group and sex by year |
Table 5 shows that confirmed and suspicion of covid-19 are among the top 10 causes of death in 2020. Also, it is noted that, since 2017, the cause “Assault by other and unspecified firearm discharge” has taken at least the 4th place.
Complications of diabetes was the main cause of death in all years in the state of Guanajuato, with an excess of 2,007 deaths in 2020 in relation to 2019. The deaths by COVID-19 were 5,700. Acute myocardial infarction was the cause of death for 7,589 in 2020, with a difference of 2,048 in relation to 2019.
Table 5: Top 10 leading causes of death by year
| Cause | 2015
Position (Number of deaths) |
2016 Position (Number of deaths) | 2017 Position (Number of deaths) | 2018 Position (Number of deaths) | 2019 Position (Number of deaths) | 2020 Position (Number of deaths) |
| Acute Myocardial Infarction | 2 (3825) | 2 (4542) | 2 (5017) | 2 (5453) | 2 (5541) | 2 (7589) |
| Diabetes mellitus |
1 (5323) |
1 (5768) | 1 (6140) | 1 (5732) | 1 (6465) | 1 (8472) |
|
Hypertensive diseases |
7 (723) | 7 (752) | 8 (770) | 8 (652) | 8 (720) | 10 (767) |
| Pneumonia | 5 (891) | 4 (1026) | 5 (1078) | 5 (1219) | 5 (1134) | 6 (1501) |
| Cerebrovascular diseases | 4 (969) | 5 (959) | 6 (1049) | 6 (1025) | 7 (957) | 9 (1001) |
| Other liver diseases | 6 (859) | 6 (926) | 7 (966) | 7 (1021) | 6 (1001) | 8 (1064) |
| Alcoholic liver disease | 9 (555) | 9 (650) | 9 (657) | 9 (602) | 9 (663) | 12 (635) |
| Bronchitis, emphysema, and other chronic obstructive pulmonary diseases | 3 (1328) | 3 (1404) | 3 (1485) | 4 (1373) | 4 (1430) | 7 (1335) |
| Renal failure | 8 (568) | 8 (562) | 10 (636) | 10 (561) | 10 (656) | 11 (691) |
| Assault by other and unspecified firearm discharge | 10 (456) | 9 (586) | 4 (1261) | 3 (1831) | 3 (2025) | 4 (2331) |
| COVID-19, Virus identified | 3 (5700) | |||||
| COVID-19, Virus not identified | 5 (1730) |
Source: ESSD/GDHI 6
The presence of the COVID-19 pandemic in Mexico, and specifically in the state of Guanajuato, has caused the increment in the number of deaths during 2020. It has been proven that much of the excess of death is derived from COVID-19. In the state of Guanajuato, during the years from 2015 to 2019 some stability in the number of deaths per epidemiological and annual week is observed, except in 2017. In that year there was an insecurity crisis and deaths from “Assault by other and unspecified firearm discharge” increased (Tables 2,4, 5). Meanwhile, in 2020, the curve of deaths by epidemiological weeks shows the impact of the COVID-19 pandemic between weeks 21 and 52 (Figure 3).
In Guanajuato state, one of the main causes of death is cardiovascular diseases. To determine if the high number of deaths observed in 2020 from this cause is due to COVID-19 requires a closer look to the data. Another risk factor for dying from COVID-19 is diabetes and its complications. In the year 2020, there was an excess of death of 909. Regarding comorbidities and risk factors, Padilla et al.9
reported that diabetes (OR 3.10 CI95% 1.84 – 5.22), cardiovascular disease (OR=3.10, CI95% 1.84 -5.22), hypertension (5.98 CI95% 3.68 – 9.71), and chronic kidney disease (4.18 CI95% 1.06 – 16.49), have a great effect on mortality by COVID-19.
Countries such as Germany, France, Ecuador, and Portugal report an excess of death 10-13. Exceptionally, according to Shun Shin Min et al. 14, Korea did not present a mortality excess in 2020. Most of these reports show a higher mortality excess among older people and males. As concluded by Woolf et al. 15, it is relevant to present all causes of death since only 20% of the mortality excess had as a primary condition COVID-19.
Dendrograms based on the distribution of deaths (Figure 5 and Figure 6) show similar patterns among them. It can be observed that 2020 is far apart from other years. For both dendrograms, there is a cut that form the same 4 groups: 2015-2016, 2018-2019, 2017, and 2020. It is concluded that COVID-19 has changed, at least temporally, the patterns of death.
Figure 6 and Figure 2 show the relationship between age and excess of mortality in 2020. As it is discussed by Modig et al. [16], mortality in age groups over 70 do not show a pattern out of expected.
Although, a clear distinct pattern is observed for those aged from 50 to 70. In previous studies, Padilla et al. 9 reported that 62.50% of deaths by COVID-19 were in male and older than 65 years old.
For future work, a closer look to the change in the geographic pattern (Figure 5) of deaths due to COVID-19 is of interest. As it is mentioned by Cos et al. 17, its main explanation is the density in some municipalities. Although, in big cities, it is expected to have more resilient healthcare facilities. By analyzing the top 10 mortality causes, the geographic distribution of deaths by year, and the gender and age group distribution of deaths by year, some trends can be observed. For example, the increment in the number of deaths due to violence. This is a factor that can introduce biases to
subsequent analysis on the excess of mortality since it can be considered as an extraordinary event. Although the pandemic is still ongoing, it is important to think in the aftermath and how it is changing the structure of society.
Conclusion
One of the reasons for performing the analysis of mortality taking all the causes is because measuring the mortality due to COVID 19 is a challenge for the health system and the civil authorities. The complexity of making the diagnosis of this disease, and the high possibility of under-registration or bad registration, represent the major problems. A limitation of this work is that it assumes that current mortality records have the same quality as the ones in previous years.
The magnitude of the effect of mortality compared to expectations is extremely high, approximately 200 points more, with a rate per 100,000 inhabitants of 814.56 for 2020 and 606.54 for 2019. The highest mortality in all years has been at the expense of men, with an excess in 2020.
The ratio of the male: female mortality rate has been higher historically in the age groups from 20 to 29, with a sustained increase in the period 2015-2018.
COVID 19 ranked 3rd as a cause of death in 2020. However, acute myocardial infarction, as the 2nd cause, and diabetes mellitus, as the 1st cause, also had an excess of mortality above of expected.
It is worth noting that the excess of deaths may be driven too by covid-19 related post complications as diabetes, cardiac or related to kidney 3. Some of these diseases have been already leading causes of death in previous years. In future work it is advisable to check cause by cause the detected mortality excess.
It is important to continue with the studies on the effects of mortality in the medium and long term by age groups and cause with the aim to observe and infer the slowdown in life expectancy. The pandemic, as a disruptive event, has represented a challenge regarding the causes of death, the coding, and the use of ill-defined codes. Moreover, it is still unclear how it will change the population distribution.
It is important to continue with the studies on the effects of mortality in the medium and long term by age groups and cause with the aim to observe and infer the slowdown in life expectancy.
The pandemic, as a disruptive event, has represented a challenge regarding the causes of death, the coding, and the use of ill-defined codes. Moreover, it is still unclear how it will change the population distribution.
Conflict of Interest
There is no conflict of interest.
Ethics Committee
The protocol was approved by Committee of Research Ethics HGP/01474/2020 from Hospital General Penjamo, 23 November 2020.
Funding Source
There are no funding source.
References
- World Health Organization. Revealing the toll of COVID-19: A technical package for rapid mortality surveillance and epidemic response. 2020. https://www.who.int/publications/i/item/revealing-the-toll-of-covid-19
- Hu B, Guo H, Zhou P, and Shi Z. L. Characteristics of SARS-CoV-2 and COVID-19. Nature Reviews Microbiology. 2021; 19(3): 141-154. Doi: https://doi.org/10.1038/s41579-020-00459-7
CrossRef - Drake, T. M., Riad, A. M., Fairfield, C. J., Egan, C., Knight, S. R., Pius, R., … & Lefteri, D. Characterisation of in-hospital complications associated with COVID-19 using the ISARIC WHO Clinical Characterisation Protocol UK: a prospective, multicentre cohort study. The Lancet. 2021; 398 (10296): 223-237. Doi: https://doi.org/10.1016/S0140-6736(20)30183-5
CrossRef - Undersecretariat for Prevention and Health Promotion. Ministry of Health. Daily technical report. December 7th, 2020. Available in: https://www.gob.mx/cms/uploads/attachment/file/597791/Comunicado_Tecnico_Diario_COVID-19_2020.12.07.pdf
- Secretary of Health from Guanajuato State. Coronavirus. December 8, 2020. https://coronavirus.guanajuato.gob.mx/
- Death Epidemiological and Statistical Subsystem, General Directorate for Health Information. Disponible en: http://www.dgis.salud.gob.mx/contenidos/sinais/s_seed.html
- World Health Organization. Analysis Group of the special PAHO Health Analysis Program. Standarization: a classic epidemiological method for the comparison of rates. Epidemiological Bulletin. 2002; 23(3): 9-12. Available in: https://iris.paho.org/handle/10665.2/32740
- Hasti T, Tibshirani R, and Friedman J. Hierarchical clustering. The elements of statistical learning. Second Edition, New York; Springer, 2009: 520-528.
- Padilla-Raygoza N, Navarro-Olivos E, Gallardo-Luna M.J, Magos-Vázquez F.J, Diaz-Martinez D.A, Sandoval-Salazar C, et al. Clinical data, comorbidities, and mortality of COVID-19 in the state of Guanajuato, Mexico until May 20, 2020. Central Asian Journal on Global Health 2020; 9(1): 1-10. Doi: https://doi.org/10.5195/cajgh.2020.527
CrossRef - Stang A, Standl F, Kowall B, Brune B, Böttcher J, Brinkmann, M, et al. Excess mortality due to COVID-19 in Germany. J Infect. 2020; 81(5): 797-801. Doi: https://doi.org/10.1016/j.jinf.2020.09.012
CrossRef - Fouillet A, Pontais I, and Caserio-Schönemann C. Excess all-cause mortality during the first wave of the COVID-19 epidemic in France, March to May 2020. Eurosurveillance. 2020; 25(34): 2001485 Doi: https://doi.org/10.2807/1560-7917.ES.2020.25.34.2001485
CrossRef - Cevallos-Valdiviezo H, Vergara-Montesdeoca A, and Zambrano-Zambrano G. Measuring the impact of the COVID-19 outbreak in Ecuador using preliminary estimates of excess mortality, March 17–October 22, 2020. International Journal of Infectious Diseases. 2021; 104: 297-299 Doi: https://doi.org/10.1016/j.ijid.2020.12.045
CrossRef - Nogueira P.J, de Araújo Nobre M, Nicola P.J, Furtado C, and Carneiro A.V. Excess mortality estimation during the COVID-19 pandemic: preliminary data from Portugal. Acta Médica Portuguesa. 2020; 33(6): 376-383 Doi: https://doi.org/10.20344/amp.13928
CrossRef - Shin M.S, Sim B, Jang W.M, and Lee J.Y. Estimation of excess all-cause mortality during COVID-19 pandemic in Korea. Journal of Korean medical science. 2021; 36(39): e280 Doi: https://doi.org/10.3346/jkms.2021.36.e280
CrossRef - Woolf S. H, Chapman D. A, Sabo R.T, Weinberger D.M, Hill L, and Taylor D.D. Excess deaths from COVID-19 and other causes, March-July 2020. JAMA. 2020; 324(15): 1562-1564 Doi: https://doi.org/10.1001/jama.2020.19545
CrossRef - Modig K., Lamb M., Ahlbom A and Ebeling M. Excess mortality for men and women above age 70 according to level of care during the first wave of COVID-19 pandemic in Sweden: A population-based study. The Lancet Regional Health-Europe. 2021:4. Doi: https://doi.org/10.1016/j.lanepe.2021.100072
CrossRef - Cos O.D, Castillo V. and Cantarero D. Facing a Second Wave from a Regional View: Spatial Patterns of COVID-19 as a Key Determinant for Public Health and Geoprevention Plans. International Journal of Environmental Research and Public Health; 2020:17(22). Doi: https://doi.org/10.3390/ijerph17228468
CrossRef

