
Manuscript accepted on :20-01-2022
Published online on: 15-02-2022
Plagiarism Check: Yes
Reviewed by: Dr. Arsalan Zaidi
Second Review by: Dr. Moumita Hazra
Final Approval by: Dr. Ian James Marti
Harish Shah1 , Arif Naseer1, Nilesh Gupta2 and Raj Singh3*
1Adarsh Vijendra Institute of Pharmaceutical Sciences (AVIPS), Shobhit University, Gangoh, Saharanpur-247341, Uttar Pradesh, India
2Praduman Singh SPS Pharmacy College, Basti-272001, Uttar Pradesh, India
3Department of Biotechnology Maharishi Markandeshwar University, Mullana- Ambala, Haryana- 133203, India
Corresponding Author E-mail: dr.rajsingh09@gmail.com
DOI : https://dx.doi.org/10.13005/bpj/2357
Abstract
The present study was performed to report the quantification of myricetin present in different extracts (i.e. ethanol, methanol, petroleum ether, chloroform and aqueous extract) of root, leaf, bark, stem and seed of Myrica esculenta using TLC densitometric method. Densitometric scanning was performed at 366 nm for the determination and quantitation of standard compounds. The compact spots were achieved at Rf 0.67 corresponding to myricetin. The content of myricetin present in different solvent extracts of M. esculenta was 0.2159 ± 0.002% w/w, 0.3139 ± 0.003% w/w, 0.0184 ± 0.004% w/w, 0.0139 ± 0.003% w/w and 0.2120 ± 0.005% w/w in ethanolic, methanolic, petroleum ether, chloroform and aqueous extract of M. esculenta stem, stem, bark, leaf and leaf plant parts, respectively. The highest myricetin content was found in the order of methanolic stem extract>ethanolic stem extract>aqueous leaf extract>petroleum ether bark extract>chloroform leaf extract of M. esculenta. The developed HPTLC method was a precise, simple, convenient and accurate for screening of large number of active compounds present in various solvent extracts. Thus, the study concluded that the developed HPTLC method for quantification of myricetin can be used for a routine quality check and analysis of any formulation and composition containing M. esculenta.
Keywords
Densitometric Method; Formulation; HPTLC; Myrica esculenta; Myricetin; Quantification; Quality
Download this article as:| Copy the following to cite this article: Shah H, Naseer A, Gupta N, Singh R. A study on HPTLC Quantification for Quality Control of Myricetin a Nutraceutical from Different Plant Parts of Myrica esculenta Linn. Biomed Pharmacol J 2022;15(1). |
| Copy the following to cite this URL: Shah H, Naseer A, Gupta N, Singh R. A study on HPTLC Quantification for Quality Control of Myricetin a Nutraceutical from Different Plant Parts of Myrica esculenta Linn. Biomed Pharmacol J 2022;15(1). Available from: https://bit.ly/3I3f4qg |
Introduction
Myrica esculenta Linn is a member of the Myricaceae family. It is a Himalayan plant, the local people called it ‘Kaiphala’.1 M. esculenta is a well-recognized plant mentioned in the Ayurvedic Pharmacopoeia. This plant has numerous pharmacological activities due to active compounds present in them.2 It has been used for its medicinal properties as folk medicine in the treatment of asthma, cough, chronic bronchitis, inflammation, fever, ulcers, anaemia, diarrhoea and throat disorders.3,4 However, the upsurge demand for this plant has led to its illicit harvesting and loss of habitat.5 It brings plant species to the stage of extinction. The reported pharmacognostical study of plant showed presence of glycosides, flavonoids, alkaloids, tannins and phenolic compounds.6 Myricetin is a polyhydroxyflavonol compound (3, 5, 7, 3′, 4′, 5′-hexahydroxyflavonol), commonly found in the plants of the Myricaceae family.7 It is a well-recognized nutraceutical as a key ingredient of various foods and beverages. Myricetin exhibits a range of activities including anticancer, antioxidant, antidiabetic and anti-inflammatory activities.8
DNA fingerprinting of any plant extract play an immense role in the quality control of complex herbal drugs due to advancements in chromatographic techniques. In this concern, High-Performance Thin Layer Chromatography (HPTLC) has been gaining much importance. It has become a routine analytical technique due on its reliable results at micro and nanogram levels.9,10 HPTLC is a useful technique because of its high sample throughput, cost-effectiveness and minimum sample clean-up requirement. It is also time-efficient and cost-effective.11
Thin Layer Chromatography (TLC) is the fast detection tool of complex compounds. It has an advantage over High-Performance Liquid Chromatography (HPLC) in that TLC detects a large number of compounds, however, the resolution of TLC is poor.12 Thus, HPTLC can be used for the detection of compounds that cannot be eluted through HPLC. HPTLC chromatograms are found to be a promising tool for fingerprinting of phytoconstituents.13 The color pictures of the HPTLC chromatogram looks attractive and more intuitive unlike Gas Chromatography (GC) and HPLC.14 HPTLC method has an advantage over the limitation of plate efficiency and developing distance. Therefore, in this study HPTLC method was developed for quality standard and quantitation of myricetin in different solvent extracts of M. esculenta plant parts. This study would be a milestone for the analysis of the crude drugs regarding quality control and compound analysis.
Methodology
Reagents and standards
The stock solutions (mg/ml) were prepared fresh with the respective solvents before use. The solution was applied on TLC aluminium plates using a Linomat applicator, which was pre-coated with silica gel (Merck, India). The solvents and chemicals used for experimental purposes throughout the experiment were of analytical grade.
Collection and authentically of plant material
The Himalayan region of India present in district of Garhwal where Pinder Velly situated in Chamoli was visited and collected the plants of Myrica esculenta Linn. It was authenticated by Dr Anurag Chandra, Senior Scientist and Incharge, Forest Research Institute (F.R.I.) Dehradun. The plant specimen was deposited in the herbarium of the institute via voucher no.247/Dis/2018/Syst.Bot./Rev.Gen./4-5.
Preparation of Extracts
The plant parts (root, leaf, bark, stem and seed) were washed with distilled water. It was further dried under shade. The dried parts were grounded to form coarse powder. The plant parts were then passed to sieve no. 14. The extraction was performed by placing individual plant parts (20 g) in a Soxhlet apparatus. The extraction was performed using different solvents (300 ml each) i.e. ethanol, methanol, petroleum ether, chloroform and aqueous extract at 60-65℃ for 5 h. The extracts were then filtered and dried in a rotary vacuum evaporator.3
Quantification of Myrica esculenta extracts through High-performance thin-layer chromatography (HPTLC)
Preparation of standard solution
Myricetin (1 mg/ml) of concentration was prepared and dissolved in ethanol and then sonicated. The final volume was made up to 10 ml to get the stock solution of 10 µl/ml.
Preparation of plant extracts
Each extract was weighed, to achieve the concentration of 10 mg/10 ml (1000 µg/ml) and dissolved in a respective solvent, make up the volume to 10 ml in a volumetric flask, sonicated and filtered. It was then applied in the concentrations of 1-10 µl on the stationary phase HPTLC Plates.
Chromatography conditions
HPTLC chromatography was comprised with a pre-activated HPTLC plate coated with Silica gel 60 F254. HPTLC system was equipped with CAMAG Linomat-V; a sample applicator device and CAMAG TLC scanner-4. The automated TLC applicator Linomat-V was used to apply aliquots of each sample separately to the plate, which was 6 mm wide band and 8 mm from the bottom. CAMAG TLC scanner-4 was used to perform a densitometric scan at 254 nm and 366 nm with slit dimensions of 6.00 × 0.30 mm. The micro scanning speed of CAMAG TLC scanner-4 was 20 mm/s. The plates were activated before chromatography at 60°C, which was pre-washed with methanol. The mobile phase was composed of Toluene: Ethyl Acetate: Formic acid: Methanol (3:3:0.6:0.4). The peak height and area as well as spectra were recorded.15
Detection and quantitation
Thin Layer chromatography was developed using ascending mode. The plates were dried using a hairdryer. CAMAG glass reagents spray was used for derivatization of chromatograms. It was sprayed with sulphuric acid (5%) in methanol then heated for 5 min at 105°C. The plates were observed at 366 nm after 30 min. Quantitative analysis was performed using CAMAG TLC scanner-4 for scanning the plates, which was equipped with win-CATS-V 1.2.3 software (CAMAG).16 Figure 1 shows the identification of myricetin. It was confirmed by superimposing the UV spectra of the samples. The standards within the same were Rf 0.67. In 366 nm scan, myricetin showed in track 4, a sharp peak at Rf value 0.67, which was closely matching with the sample track1: stem ethanol with Rf value 0.68; sample track 2 stem methanol with Rf value 0.68, sample track 3 bark petroleum ether with Rf value 0.70, sample track 5 leaf chloroform with Rf value 0.69 and sample tract 6 leaf aqueous extract with Rf value 0.69 indicated the presence of myricetin. The characteristic fingerprint profiles were developed through densitometry HPTLC analysis that may be used as a marker for standardization and analysis of the drugs.
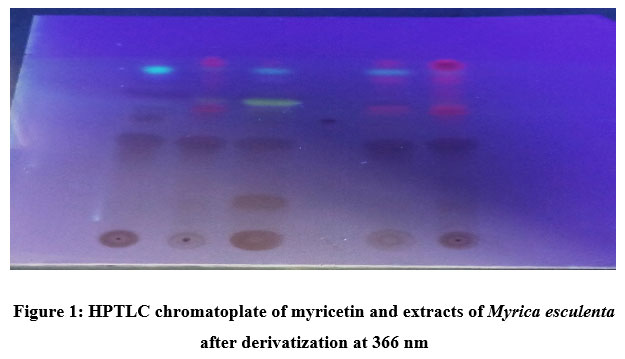 |
Figure 1: HPTLC chromatoplate of myricetin and extracts of Myrica esculenta after derivatization at 366 nm |
Track 1 = stem ethanol, Track 2 = stem methanol, Track 3 = bark petroleum ether, Track 4 = Standard myricetin, Track 5 = leaf chloroform, Track 6 = leaf aqueous extract
Calibration curve of myricetin
The content of myricetin compound in plant extracts was determined by establishing the standard curve with a concentration range from 50-300 ng/spot. The standard sample of myricetin (10 μg/ml) as a stock solution was prepared in methanol. The HPTLC plates were spotted with the stock solution in the volumes of 5, 10, 15, 20, 25 and 30 μl with concentrations of 50, 100, 150, 200, 250 and 300 ng/spot, respectively. The bandwidth was 6 mm and the distance between tracks was 12 mm. The concentration peak was plotted on the basis of concentration of myricetin spotted. Figure 2 shows linear regression line y = 11.278x + 404.8. The concentration of 50–300 ng/spot was showed a good linear relationship based on its regression data. The obtained curve was adhered to Beer’s law. It was due to the high value of correlation coefficient and SD for intercept value less than 2%.
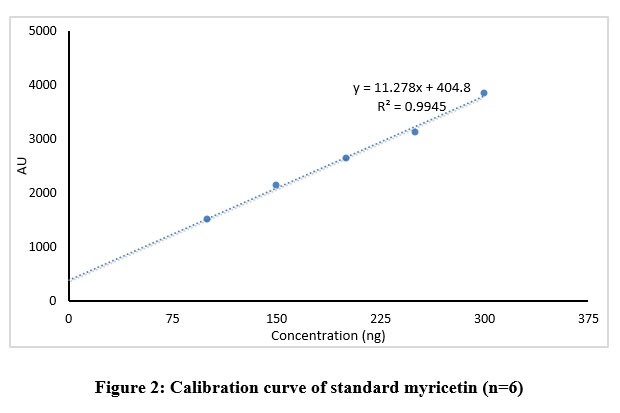 |
Figure 2: Calibration curve of standard myricetin (n=6) |
Estimation of myricetin in the herbal extracts
Myricetin content in herbal extracts was determined by taking 1 g of each sample plant part with 50 ml of selected solvents. The resulting solutions were centrifuged for 15 min at 3000 rpm. The myricetin content was present in the supernatant. The scanning was performed by applying the filtered solutions on the TLC plate. This analysis was repeated 6 times to observe any change of interference.15 The spot at Rf = 0.67 was present in the chromatogram of the extracts corresponding to myricetin. Interestingly, no interference was seen in the tested as shown in Figure 3 and Figure 4-8.
Results
HPTLC fingerprinting and chromatography
Different extracts of M. esculenta i.e. ethanol, methanol, petroleum ether, chloroform and aqueous extracts were evolved using HPTLC fingerprint technique. HPTLC pre-coated plates having silica gel F254 was used to quantify standard myricetin with mobile phase Toluene: Ethyl Acetate: Formic acid: Methanol (3:3:0.6:0.4). The Rf value was about 0.67. Figure 3 and Figure 4-8 showing the peak for Rf value of myricetin. It was matched with the Rf value of extract that was about 0.67.
Quantification of myricetin using HPTLC
The method we developed was simple and precise to quantify myricetin a marker compound in different solvent extracts of M. esculenta. However, TLC procedure was optimized to quantify the herbal extracts. The mobile phase gave sharp, well-defined and better peak resolution. The chromatogram of the standard compound was used for the identification of myricetin and spot at Rf 0.67. The chamber was saturated to get well-defined spots at room temperature.
The derivatization was performed at 366 nm. The identification of myricetin bands obtained in the TLC plate of standard and solvents extracts of different plant parts of M. esculenta was confirmed by the chromatogram. It was compared with the retention factor of myricetin from the standard and sample solution. The corresponding peak of myricetin from the herbal extracts had the same retention factor as that from the myricetin standard (Rf 0.67). The linearity range for myricetin was 50–300 ng/spot. It was correlated with correlation coefficient, intercept and the slope 0.9945, 11.278 and 404.8, respectively (Y = 11.278x + 404.8).
The content of myricetin quantified was found to be 0.1128 ± 0.005, 0.1763 ± 0.002, 0.1491 ± 0.001 and 0.2159 ± 0.002% w/w, respectively in root, leaf, bark and stem of M. esculenta ethanolic extract (Table 1). The content of myricetin in methanolic extract of M. esculenta was found to be 0.2183 ± 0.001, 0.2291 ± 0.004, 0.2393 ± 0.004 and 0.3139 ± 0.003% w/w, respectively in root, leaf, bark and stem of parts of the plant. The content of myricetin in petroleum ether extract of M. esculenta was found to be 0.0184 ± 0.004% w/w in the bark of the plant. The content of myricetin in chloroform extract of M. esculenta was found to be 0.0139 ± 0.003% w/w in the leaf of the plant. The content of myricetin in aqueous extract of M. esculenta was found to be 0.2120 ± 0.005, 0.0200 ± 0.007 and 0.2111 ± 0.003% w/w, respectively in the leaf, bark and stem parts of the plant. The highest myricetin content was found in the order of methanolic stem extract>ethanolic stem extract>aqueous leaf extract>petroleum ether bark extract>chloroform leaf extract of M. esculenta.
Table 1: HPTLC quantification for myricetin content in different extracts of M. esculenta
| Sample extract | Plant parts/ Active content | Retention time (min) | Peak height | Myricetin content (%, w/w) |
| Ethanol | Root | 0.63 | 43.0 | 0.1128 ± 0.005 |
| Leaf | 0.68 | 197.4 | 0.1763 ± 0.002 | |
| Bark | 0.62 | 21.6 | 0.1491 ± 0.001 | |
| Standard (Myricetin) | 0.61 | 175.5 | – | |
| Stem | 0.68 | 452.3 | 0.2159 ± 0.002 | |
| Seed | – | – | – | |
| Methanol | Root | 0.70 | 124.4 | 0.2183 ± 0.001 |
| Leaf | 0.67 | 70 | 0.2291 ± 0.004 | |
| Bark | 0.68 | 92.2 | 0.2393 ± 0.004 | |
| Standard (Myricetin) | 0.68 | 238.2 | – | |
| Stem | 0.68 | 278.5 | 0.3139 ± 0.003 | |
| Seed | 0.68 | 101.7 | – | |
| Petroleum ether | Root | – | – | – |
| Leaf | 0.73 | 125.4 | – | |
| Bark | 0.70 | 411.1 | 0.0184 ± 0.004 | |
| Standard (Myricetin) | – | |||
| Stem | – | – | – | |
| Seed | – | – | – | |
| Chloroform | Root | 0.71 | 132.3 | – |
| Leaf | 0.69 | 380.1 | 0.0139 ± 0.003 | |
| Standard (Myricetin) | 0.70 | 203.0 | – | |
| Seed | 0.70 | 145.0 | – | |
| Aqueous | Leaf | 0.69 | 159.5 | 0.2120 ± 0.005 |
| Bark | 0.72 | 167.6 | 0.0200 ± 0.007 | |
| Standard (Myricetin) | 0.72 | 296.4 | – | |
| Stem | 0.72 | 166.4 | 0.2111± 0.003 |
 |
Figure 3: Densitometric chromatogram of myricetin and methanolic extract of M. esculenta (root, leaf, bark, stem and seed) at 366 nm |
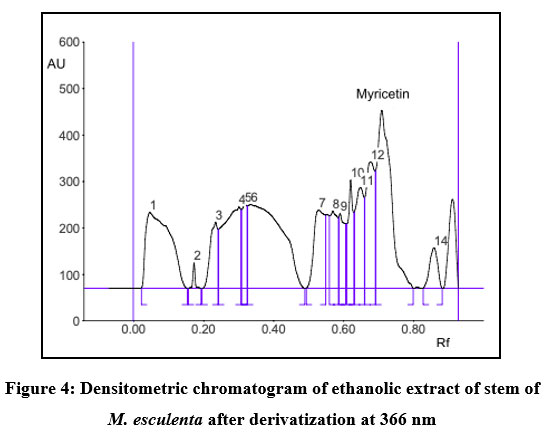 |
Figure 4: Densitometric chromatogram of ethanolic extract of stem of M. esculenta after derivatization at 366 nm |
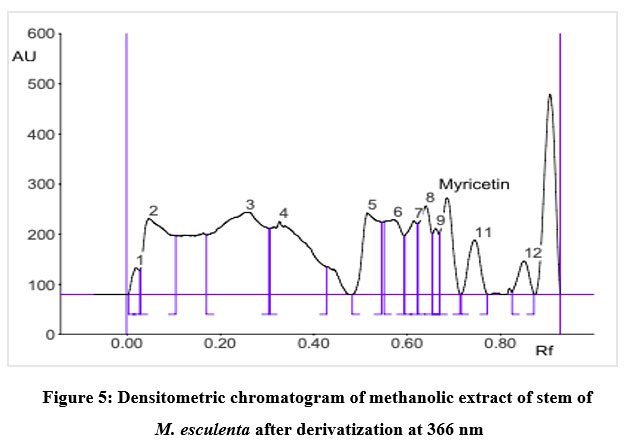 |
Figure 5: Densitometric chromatogram of methanolic extract of stem of M. esculenta after derivatization at 366 nm |
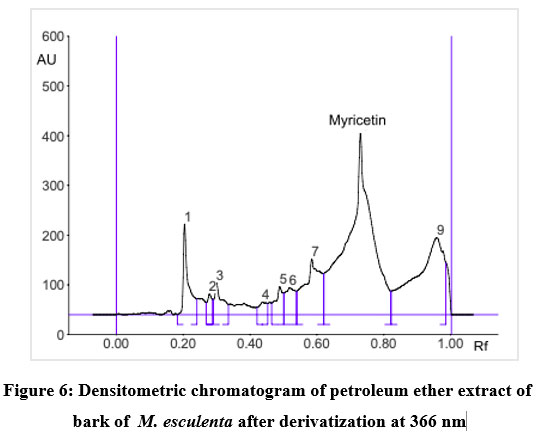 |
Figure 6: Densitometric chromatogram of petroleum ether extract of bark of M. esculenta after derivatization at 366 nm |
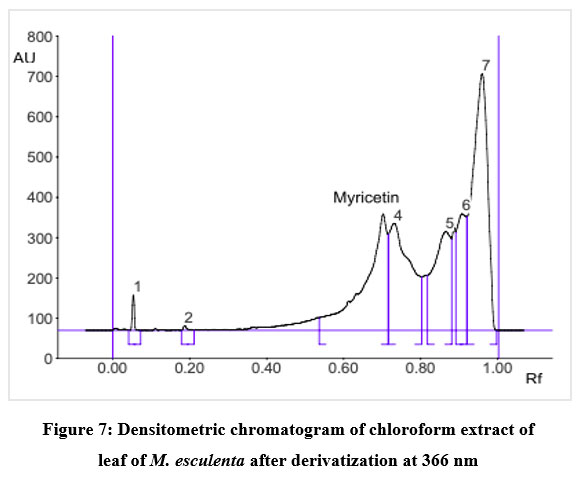 |
Figure 7: Densitometric chromatogram of chloroform extract of leaf of M. esculenta after derivatization at 366 nm |
 |
Figure 8: Densitometric chromatogram of aqueous extract of leaf of M. esculenta after derivatization at 366 nm |
Discussion
In this study, the quantification of myricetin was performed by developing the HPTLC method on different solvent extracts of M. esculenta plant parts. Results showed that the highest quantity of myricetin was found in methanolic and ethanolic extracts of M. esculenta stem and aqueous extract of M. esculenta leaf. Kamboj and Saluja, 2017 developed the HPTLC method for stigmasterol from stem and leaf of Bryophyllum pinnatum.17 They reported that the highest amount of active constituent was seen methanolic extract of the plant. Patel et al., 2010 also reported the quantification of active compounds was seen in methanolic extract of the plant.15 The HPLC-ESI-MS can separate and identify anthocyanins and flavonoids from onion with high efficiency and high quality.18 The identification and quantification of active compounds responsible for antiplasmodial activity was also reported in different plant parts viz. leaf, stem and root of Cissampelos pareira.19 Kumar et al., 2017 reported the presence of gallic acid in M. esculenta by HPTLC in the methanolic extract of leaves.20
A comparative study has shown that myricetin present in higher amount in methanolic extract of stem part followed by ethanolic extract of stem part and aqueous extract of leaf part of M. esculenta. The quantity of active constituents present in any plant extract affects the activity of plant extract.21 Since myricetin is used in the treatment of a variety of diseases, therefore, its quantification may be helpful in the standardization of herbal formulation. Our results were in agreement with the study of Patel et al., 2015 on HPTLC method development for quantification of myricetin in M. esculenta.21 They reported a similar quantity of myricetin found in the stem bark of the plant. This study further play a significant role in the conservation and sustainable pharmaceutical uses of plant wealth from the Himalayan region. The unorganized activities brings plant species to the stage of extinction. There are different studies involved in the conservation and documentation of medicinal plants from hilly areas.22-30 The quality of nutraceuticals and medicinal substrates are subjects of standardization and copyright.31-33
Conclusion
The developed HPTLC method for quantification of myricetin present in M. esculenta plant was simple, rapid, accurate, precise method. The data present study can be used as a quality control standard. The shape of the peak generated through this method enabled a good resolution of myricetin. No interference with the peak of myricetin was seen, it may be due to recovery (96.77–99.44%) that was close to 100%. The HPTLC images shown in Figures 1 and 3 indicating samples separated without any diffuseness and tailing. It can be concluded from the study that the proposed HPTLC method is sensitive, simple and economic for routine quality control analysis. It can also be useful for the quantification of myricetin from different parts of M. esculenta and for standardization purposes.
Acknowledgement
We are thankful to the Institute for providing all facilities required while performing this experiment. I will be forever grateful to my esteemed supervisor Dr. Arif Naseer from Adarsh Vijendra Institute of Pharmaceutical Sciences (AVIPS), Shobhit University, Gangoh, Saharanpur, Uttar Pradesh, India for providing me all facilities required during this experiment.
Conflict of Interest
The authors declared no conflict of interest.
Funding Sources
There is no funding source.
References
- Kabra A, Martins N, Sharma R, Kabra R, Baghel US. Myrica esculenta-Ham. ex D. Don: A Natural Source for Health Promotion and Disease Prevention. Plants (Basel); 8(6):149 (2019).
CrossRef - Kabra A, Sharma R, Singla S, Kabra R, Baghel U S. Pharmacognostic characterization of Myrica esculenta leaves. J Ayurveda Integr Med; 10(1):18–24 (2019).
CrossRef - Kabra A, Sharma R, Hano C, Kabra R, Martins N, Baghel U S. Phytochemical Composition, Antioxidant, and Antimicrobial Attributes of Different Solvent Extracts from Myrica esculenta-Ham. ex. D. Don Leaves. Biomolecules; 9(8):357 (2019).
CrossRef - Singh C, Chauhan N, Upadhyay S.K, Singh R, Rani A. The Himalayan natural resources: Challenges and conservation for sustainable development. pharmacogn. Phytochem; 10(1): 1643-1648 (2021).
- Shah, H, Naseer A, Gupta N, Patil S M, Upadhyay S K, Singh R. Proximate Analysis and Phytochemical Screening of different Plant Parts of Myrica esculenta Extracts. Plant Cell Biotechnol Mol Biol; 22(55-56):90-102 (2021).
- Kabra A, Baghel US, Hano C, Martins N, Khalid M, Sharma R. Neuroprotective potential of Myrica esulenta in Haloperidol induced Parkinson’s disease. J Ayurveda Integr Med; 11(4):448–54 (2020).
CrossRef - Semwal DK, Semwal RB, Combrinck S, Viljoen A. Myricetin: A Dietary Molecule with Diverse Biological Activities. Nutrients; 8(2):90 (2016).
CrossRef - Song X, Tan L, Wang M, Ren C, Guo C, Yang B, et al. Myricetin: A review of the most recent research. Biomed Pharmacother; 134:111017 (2021).
CrossRef - Alam P, Ezzeldin E, Khalil N Y, Foudah A I. Simple and Accurate HPTLC-Densitometric Method for Quantification of Delafloxacin (A Novel Fluoroquinolone Antibiotic) in Plasma Samples : Application to Pharmacokinetic Study in Rats. (Dlx). Antibiotics; 9(134):1-12(2020).
CrossRef - Saraf AY, Saraf AA. HPTLC fingerprinting: A tool for simplified analysis of phenolics in medicinal plants. Indian J Pharm Educ Res; 54(4):1098-1103 (2020).
CrossRef - Thomas A, Kanakdhar A, Shirsat A, Deshkar S, Kothapalli L. A High Performance Thin Layer Chromatographic Method Using a Design of Experiment Approach for Estimation of Phytochemicals in Extracts of Moringa oleifera Turkish J Pharm Sci; 17(2):148–58 (2020).
CrossRef - Attimarad M, Ahmed KKM, Aldhubaib BE, Harsha S. High-performance thin layer chromatography: A powerful analytical technique in pharmaceutical drug discovery. Pharm Methods; 2(2):71–5 (2011).
CrossRef - Senguttuvan J, Subramaniam P. HPTLC Fingerprints of Various Secondary Metabolites in the Traditional Medicinal Herb Hypochaeris radicata Smith W K, editor. J Bot; 5429625 (2016).
CrossRef - Rathee D, Rathee S, Rathee P, Deep A, Anandjiwala S, Rathee D. HPTLC densitometric quantification of stigmasterol and lupeol from Ficus religiosa. Arab J Chem; 8(3):366–71 (2015).
CrossRef - Patel K, Patel V, Patel K, Gandhi T. Validated HPTLC method for quantification of myricetin in the stem bark of Myrica esculenta Ham. Ex D. Don, Myricaceae. JPC – J Planar Chromatogr – Mod TLC; 23(5):326–31 (2010).
CrossRef - Shah H, Verma S, Tripathi R. Anti-fungal screening and quantification of Datura metel CJPS; 9907:1–9 (2014).
- Kamboj A, Saluja A K. Development of validated HPTLC method for quantification of stigmasterol from leaf and stem of Bryophyllum pinnatum. Arab J Chem; 10:S2644–50 (2017).
CrossRef - ZHANG SL, Peng DE, XU YC, Lü SW, WANG JJ. Quantification and analysis of anthocyanin and flavonoids compositions, and antioxidant activities in onions with three different colors. J Integr Agric; 15(9):2175-81 (2016).
CrossRef - Bhatt V, Kumari S, Upadhyay P, Agrawal P, Sahal D, Sharma U. Chemical profiling and quantification of potential active constituents responsible for the antiplasmodial activity of Cissampelos pareira. J Ethnopharmacol; 262:113185 (2020).
CrossRef - Kumar P, Gupta A, Singh A. Pharmacognostic evaluation and determination of secondary plant metabolites by HPTLC and its antioxidant activity in Myrica esculenta. Phcog J; 9(6s) (2017).
CrossRef - Patel N G, Patel K G, Patel K V, Gandhi T R. Validated HPTLC Method for Quantification of Luteolin and Apigenin in Premna mucronata, Verbenaceae. Adv Pharmacol Sci; 682365-7 (2015).
CrossRef - Singh C, Singh M, Rani A, Singh R. Peculiarities Observed In Ferns. J Multidiscip Res Info; 3(1):440-442(2017).
- Singh C, Brijesh, Rani A, Dhyani K, Singh R. Biodiversity and Conservation Fern diversity in different forests of Dehradun District. Int J Pharm Res; 9(3):35-41(2017).
- Singh C, Chauhan N, Rani A, Singh R. Restoration of world heritage site Nanda Devi Biosphere Reserve, Uttarakhand. J Agri For Meteo Res; 3(5):405-8(2020).
- Singh C, Chauhan N, Upadhyay S K, Singh R. Phytochemistry and ethnopharmacological study of Adiantum capillus-veneris L.(Maidenhair fern). Plant Arch; 20(2):3391-8(2020).
- Kumar M, Sharma I, Verma P K, Singh B J, Singh R, Upadhyay S K. A study on diversity and distribution of Ficus(Dicotyledonae: Moraceae) species at Forest Research Institute (FRI), Dehradun (Uttarakhand), India. J.Appl. Nat. Sci; 13(2):552-60(2021).
CrossRef - Kumar M, Upadhyay SK, Negi R, Sharma I, Singh R. Phytodiversity, socioeconomic and ethnomedicinal study of bamboos Dendrocalamus nees in new forest of forest research institute (FRI), Dehradun (Uttarakhand), india. j. botany stud; 6(3):412-416(2021).
- Kumar M, Kaur H, Verma R, Negi R, Sharma I, Upadhyay SK, Singh R. Taxonomical diversity, socioeconomic and ethnomedicinal significance of Bambusa Schreber 1789 (Poaceae: Bambusoideae) in Forest Research Institute (FRI), Dehradun (Uttarakhand), India. Asian Journal of Biological and Life sciences. Asian J. Sci; 10(2):346-351(2021).
CrossRef - Chauhan N, Singh C, Singh R, Rani A, Upadhyay S K, Kishore K, Singh K. Adhatoda vasica: Pharmacological Characterization for the Development of Herbal Drug. Plant Arch, 21(2): 873-880(2021).
- Singh C, Chauhan N, Rani A, Kishore K, Singh K, Singh R. Ethnobotanical and pharmacological studies of pteridophytes (Ferns) from Mussoorie region, Dehradun district, Uttarakhand. j. botany stud; 6(6):694-702(2021).
- Malik A, Gochhayat G, Alam M D, Kumar M, Pal, P, Singh, R, Saini Quality By Design: A New Practice For Production Of Pharmaceutical Products. J drug deliv Ther; 9(1-s):416-424(2019).
CrossRef - Malik A, Rana S, Alam M S, Kumar M, Singh R, Kumar P, Saini V. The Potential Role of Nutraceutical In Health And Disease. Int J Pharma Biol Sci; 9:763-71(2019).
- Aggarwal D, Upadhyay S K, Singh R, Tuli H S. Recent patents on therapeutic activities of xanthohumol: a prenylated chalconoid from hops (Humulus lupulus L.). Pat. Anal; 10(1):37-49(2021).
CrossRef

