
Manuscript accepted on :15-01-2022
Published online on: 25-01-2022
Plagiarism Check: Yes
Reviewed by: Dr. Nicolas Padilla
Second Review by: Dr. Deepak kumar
Final Approval by: Dr. Ayush Dogra
Pradip C Warghane, V. C. Patil*, Aparna Patange and Shilpa Patil
Department of Medicine, Krishna Institute of Medical Sciences, Karad, Maharashtra – 415110.
Corresponding Author E-mail: : virendracpkimsu@rediffmail.com
DOI : https://dx.doi.org/10.13005/bpj/2355
Abstract
Background and Objectives: Anemia is the most common condition in older population. Failure to diagnose anemia may lead to delayed diagnosis of treatable conditions. Therefore, this study was conducted to study the clinical, biochemical, and hematological profile of elderly anemic patients in a tertiary care center. Materials and Method: This prospective, observational study was conducted in 207 elderly patients with hemoglobin (Hb) <12 g/dL in females and <13 g/dL in males. A detailed history was obtained and thorough clinical examination and symptom analysis was done in all the patients. Hematological investigations including peripheral smear and biochemical investigations were conducted. The morphological pattern of anemia was analyzed based on red cell indices and peripheral smear. Pearson’s Chi-square test was used to test the association between presenting symptoms and anemia grade. P<0.05 was considered statistically significant. Results: Majority of the patients presented with moderate anemia, and the most common presenting symptoms were generalized weakness and anorexia. A significant association was observed between severity of anemia and fatigue (p=0.006), headache (p=0.04), and dyspnea (p=0.010). Patients with pallor (P=0.01) and nail changes (P=0.0005) had significantly severe anemia. All the hematological parameters were within the reference range. Normocytic anemia was the most common type of morphological anemia among elderly patients . Conclusion: The incidence of anemia was quite high among elderly patients with chronic diseases and malignancies. Hence, it is very important to diagnose the cause of anemia by detailed investigations before initiating the required therapy.
Keywords
Anemia; Chronic disease; Dyspnea; Erythrocyte indices; Fatigue
Download this article as:| Copy the following to cite this article: Warghane P. C, Patil V. C, Patange A, Patil S. A Prospective Observational Study of Clinical, Biochemical, and Hematological Profile of Elderly Anemic Patients in a Tertiary Care Hospital. Biomed Pharmacol J 2022;15(1) |
| Copy the following to cite this URL: Warghane P. C, Patil V. C, Patange A, Patil S. A Prospective Observational Study of Clinical, Biochemical, and Hematological Profile of Elderly Anemic Patients in a Tertiary Care Hospital. Biomed Pharmacol J 2022;15(1). Available from: https://bit.ly/33M5DN6 |
Introduction
Iron deficiency is the most frequently encountered nutritional problemworldwide.1It mainly leads to anemia, which is a common and significant problem in the elderly population. Anemia in the elderly is associated with increased morbidity and poor health-related quality of life.2It is characterized by low hemoglobin (Hb) concentration and insufficient oxygen-carrying capacity to meet the body’s physiological needs. WHO has reported that 164 million people aged ≥60 years and residing in low-income and middle-income countries had anemiaglobally.3According to WHO, anemia in adults is defined as females with Hb <12 g/dL and males with Hb <13 gm/dL.4The incidence of anemia was found to be 11% in men aged >65 years as compared to women.5
Approximately one-third of the cases in the elderly can be attributed to nutritional deficiencies such as vitamin B12/folate and iron deficiency. Iron deficiency alone accounts for almost half of the nutrient deficiency-related anemia cases6whereas vitamin B12/folate deficiencies account for 14% of the anemia cases inthe elderly population.7Other causes of anemia in elderly people include chronic infection and inflammation, gastrointestinal bleeding due to lesions, and chronic kidney disease.8 The onset of signs and symptoms is usually insidious, and many elderly patients are accustomed as their bodies make physical adaptations to the conditions. Pallor could be a helpful diagnostic clue, but detection is difficult in elderly patients. However, conjunctival pallor could be a reliable sign to prompt the clinician for blood tests.9Other signs of anemia such as congestive heart failure, dizziness, and apathy make the patients’ condition worse. Severe symptoms of anemia result in health consequences such as weakness, fatigue, and shortness of breath leading to functional disability for mobility, reduced bone density and muscle mass, reduced cognitive function, increased debility, and increased risk of comorbid conditions and recurrent falls and mortality.7,10Furthermore, parasitic infections such as hookworm and malaria were also noted to be important causes of anemia.11
Various studies conducted in plain geographical regions of the country have reported high incidence of anemia among elderly patients in the range of 21% to 96%.12-17 However, there is paucity of data on the effects of anemia in these patients, especially in India. Therefore, this cross-sectional study was conducted to evaluate the clinical, biochemical, and hematological profile of elderly anemic patients, to correlate the hematological findings with possible etiopathologies, and to study the morphological types of anemia.
Materials and Method
Study design
This prospective, observational, and non-interventional study was conducted in a tertiary care hospital, over a period of 18 months from Oct 2014 to Mar 2016. The Institutional ethics committee’s clearance and prior written informed consent were obtained from the study participants.
Sample size calculation
Formula used for sample size calculation is
n is the required sample size, p is the percentage occurrence of a state or condition (proportion or prevalence), d is the percentage maximum error required, z is the value corresponding to level of confidence required.
Prevalence of hematological disorders is assumed as 21% with 95% confidence level and 5% error.

Minimum sample size required for the study is 196 subjects.
The sample size was determined using the non-conventional sampling method. Patients aged >60 years with hemoglobin (Hb) <12 g/dL in females and <13 g/dL in males were included. Those below 60 years of age with known hematological disorders since childhood were excluded.
A total of 207 patients, in the age range of 60 to >85 years were included in the study. A detailed physical examination; chief complaints; clinical, personal, dietary, drug, environmental, and past history; and socioeconomic status were recorded before proceeding withdetailed relevant investigations. All the patients underwent hematological and biochemical investigations which included complete blood count, iron studies, serum vitamin B12/folic acid levels, stool examination, liver and renal function tests, thyroid profile, bone marrow examination, Coomb’s test, radiological and endoscopic examinations, viral markers, and tumor markers when required.
Complete blood count
Complete blood count included the following: hemoglobin (Hb); hematocrit (HCT); red blood cell (RBC) count; RBC indices such as MCV, MCH, MCHC; RBC distribution width (RDW); and platelet count.All investigations were carried out onan automated cell counter (XT-1800i autoanalyzer; Sysmex Corporation, Kob, Japan). As per the WHO criteria, anemia was graded based on the severity as: mild (>10g/dL), moderate (7-10 g/dL), and severe (<7g/dL) respectively.18
Totally, 207 venous blood samples were subjected to routine hematological investigations. The autoanalyzer works on the principle of aperture impedance technology. Blood cells were suspended in an electrically conductive electrolyte solution and made to flow from an outlet chamber in an inner chamber through a 100 µm wide orifice. When the cells passed through the orifice during the counting process, they imparted resistance to the electrical conductivity between the electrodes which was recorded electronically as a voltage pulse wherein the height of the pulses was proportional to the volume of cells passing through the orifice. The number of voltage pulses that was recorded corresponded to the number of cells. The Hb concentration, cell counts, HCT, and RDW were measured electronically, whereas the erythrocyte indices were calculated by the microprocessor. The morphology of RBC, white blood cells (WBCs),and platelets was studied in detail through peripheral smears using Leishman’s stain and subsequently studied under a microscope using an oil immersion lens for RBC morphology, i.e., size, shape, color, and presence of any inclusions.
Iron studies included serum iron, total iron binding capacity (TIBC), and serum ferritin levels. Serum vitamin B12 and folic acid levels were estimated by means of Cobase-411 (HITACHI) automated analyzer. Bone marrow aspiration, trephine biopsy, marrow section, and staining of slides were carried out. Coomb’s test was performed using direct antiglobulin test.
Statistical analysis
Data was analyzed and interpreted using statistical software SSPS 15.0, MedCalc 9.0.1.Pearson’sChi-square test was used to test the association between presenting symptoms and grades of anemia.
Results
The frequency distribution of basic demographic variables is presented in Table 1. Majority of the patients(50.7%) were in the age range of 60-65 years. Most of the patients were males(51.7% males vs 48.1% females).
Table 1: Demographic characteristics and frequency of symptoms in anemic patients
| Variables | Number (%) |
| Age (years) | |
| 60-65 | 105 (50.7) |
| 66-70 | 48 (23.2) |
| 71-75 | 27 (13.0) |
| 76-80 | 13 (6.3) |
| 81-85 | 10 (4.8) |
| >85 | 4 (19) |
| Total | 207 (100) |
| Gender | |
| Males | 107 (51.7) |
| Females | 100 (48.1) |
Most of the patients presented with moderate (45.89%) andmild-grade (40.1%) anemia. In terms of hospitalization, majority of the patients (70.53%) were inpatients as compared to outpatients (29.47%). Moderate-grade (35.27%) anemia was common among the hospitalized patients whereas, mild-grade anemia was prevalent among patients treated in the outpatient department (OPD) (Table 2).
With regard to the gender-wise distribution of anemia, moderate anemia (27.05%) was seen in majority of the males and mild anemia was seen in most of the females (23.19%).
Table 2: Grades of anemia and pattern of hospitalization in anemic patients
| Grade | IPD
n (%) |
OPD
n (%) |
Total
n (%) |
| Mild (10-12) | 48 (23.19) | 35 (16.91) | 83 (40.1) |
| Moderate (7-10) | 73 (35.27) | 22 (10.63) | 95 (45.89) |
| Severe (<7) | 25 (12.08) | 4 (1.93) | 29 (14.01) |
| Total | 146 (70.53) | 61 (29.47) | 207 (100) |
IPD: inpatient department, OPD: outpatient department
The most common presenting symptoms in this study were generalized weakness and anorexia (89.9%) followed by fatigue (85.5%). With respect to the association between presenting symptoms and grades of anemia, a statistically significant association was observed between severity of anemia and fatigue (P=0.006), headache (P=0.04), and dyspnea (P=0.010), respectively. The most common clinical signs in the present study were pallor (97.1%) andskin changes (33.8%). A statistically significant association was observed between pallor and nail changes with severity of anemia(P=0.01 and P=0.0005). Although skin changes were the common clinical symptoms, it was not statistically significant (Table 3).
Table 3: Frequency of presenting symptoms and signs of anemia and their association with anemia grades
| Variables | Number (%) | Chi-square | Pvalue (simulated) |
| Symptoms | |||
| Generalized weakness | 186 (89.9) | 0.5733473 | 0.774612694 |
| Fatigue | 177 (85.5) | 10.3536924 | 0.006496752* |
| Giddiness | 80 (38.65) | 1.0175319 | 0.633683158 |
| Headache | 19 (9.2) | 5.8Wi94112 | 0.047976012* |
| Anorexia | 186 (89.9) | 1.5566288 | 0.47876062 |
| Weight loss | 59 (28.65) | 1.8257883 | 0.415292354 |
| Dysphagia/Dyspepsia | 4 (1.9) | 0.5984891 | ~1 |
| Nausea/vomiting | 106 (51.2) | 3.1501923 | 0.226886557 |
| Fever | 20 (9.7) | 4.7565034 | 0.100949525 |
| Dyspnea | 170 (82.1) | 9.2940988 | 0.010494753* |
| Edema | 3 (1.4) | 0.7474206 | ~1 |
| Cough/cold | 73 (35.3) | 4.3473493 | 0.117941029 |
| Pain in abdomen | 158 (76.3) | 4.5857922 | 0.116441779 |
| Bleeding manifestations | 12 (5.8) | 1.5440019 | 0.51324337 |
| Signs | |||
| Pallor | 201 (97.1) | 9.23143 | 0.01099* |
| Icterus | 10 (4.8) | 0.84332 | 0.68816 |
| Nail changes | 8 (3.9) | 26.2236 | 0.0005* |
| Cyanosis | 1 (0.5) | 1.50123 | 0.55222 |
| Lymphadenopathy | 12 (5.8) | 1.21776 | 0.61019 |
| Edema | 6 (2.9) | 0.39469 | 0.86807 |
| Glossitis | 25 (12.1) | 3.80184 | 0.16342 |
| Skin changes | 70 (33.8) | 2.28744 | 0.32334 |
*p<0.05 considered as statistically significant
With regard to chronic blood loss, 4.34% of the cases were associated with anemia. Malignancy (44.4%) and hemorrhoids (33.33%) were the most common causes of chronic blood loss. Duodenal ulcer and hookworm infection accounted for 11.11% of chronic blood loss.
In the present study, the various hematological parameters like Hb, total leukocyte count (TLC), MCV, MCH, MCHC, RBC count, packed cell volume (PCV), RDW, reticulocyte count (RETIC), and erythrocyte sedimentation rate (ESR)were within the reference range. Normocytic normochromic anemia was the most common (60.4%) form of anemia seen on peripheral smear followed by microcytic (19.3%) anemia. Other types of morphological patterns observed were dimorphic (7.2%), macrocytic (5.8%), normocytic hypochromic (4.3%),macrocytic hypochromic (1.9%), and fragmented red cells (1.0%).Platelet count, bleeding time (BT),clotting time (CT), prothrombin time (PT), and internationalized normal ratio (INR)were within normal limits
The ranges and mean values of the various hematological parameters observed in different forms of anemia in the study were within the reference range (Table 4).
Table 4: Mean values and range of hematological parameters in different morphological patterns of anemia
| Hematological parameters | Dimor (Range) | Macro (Range) | Macro Hypo (Range) | Micro Hypo (Range) | Nc Hypo (Range) | NcNc (Range) | NcNc FRC (Range) |
| Hb ( g/dL) | 9.3 (6.5-11.1) | 8.1 (5.1-10.2 | 8.4 (7.9-9.2) | 8.0 (3.5-11) | 9.9 (8.5-11.2) | 9.6 (4-12.3) | 4.9 (4-5.8) |
| TLC | 9552 (1180-23000) | 25456.7 (2780-230000) | 6902.5 (4200-9100) | 8543.1 (1000-30340) | 11033.3 (6700-14000) | 17262.3 (900-420000) | 8150 (6500-9800) |
| MCV (fL) | 81.6 (72.3-93.1) | 105.9 (88-116.3) | 70.5 (57.7-75.9) | 73.8 (56.6-
116.5) |
81.3 (77-89) | 85.6 (10.6-
101) |
93.5 (93.4-93.6) |
| MCH (pg) | 37.8 (21.7-
211.5) |
32.6 (29.3-
36.8) |
20.5 (13.4-24.3) | 24.1 (14.5-
86.4) |
24.5 (21.9-26.7) | 28.2 (10.6-
33.2) |
30.2 (29.7-30.7) |
| MCHC (%) | 31.4 (27.5-35.2) | 33.1 (30.3-
37.2) |
28.4 (23.3-32.5) | 29.5 (23.7-
34.3) |
30.5 (28.4-32) | 32.3 (22.8-
40.7) |
32.2 (31.3-33.1) |
| RBC count (millions/cu.mm) | 3.3 (1.9-4.5) | 2.8 (1.9-4.3) | 3.2 (2.5-3.9) | 5.9 (1.7-34.3) | 3.8 (2.7-4.6) | 3.6 (1.7-31) | 3.3 (2.9-3.7) |
| PCV | 29.1 (20.1-34.9) | 25.6 (16.4-
32.3) |
27.9 (24.6-29.7) | 23.3 (3.9-36.3) | 32.4 (26.9-35.9) | 29.3 (10.1-
35.7) |
16.1 (13.8-18.3) |
| RDW (%) | 17.0 (11.8-36.2) | 15.9 (10.2-
31.4) |
14.6 (12.4-16.8) | 18.8 (10.1-
36.3) |
14.9 (10.2-20.9) | 14.7 (9.3-
51.1) |
14.9 (13.1-16.7) |
| RETIC | 1.2 (1-2) | 1.2 (1.1.3) | 1.1 (1-1.3) | 1.3 (1-2) | 1.2 (1-1.3) | 1.2 (1-2) | 3.6 (3.2-4) |
| ESR | 52.9 (10-110) | 83.8 (40-120) | 100 (95-105) | 58.4 (15-120) | 87.1 (20-120) | 75.9 (5-135) | 120 (110-130) |
| Platelet count (lakhs/cu.mm) | 237000 (75000-510000) | 191250 (75000-450000) | 273750 (105000-510000) | 255375 (75000-510000) | 181666.7 (45000-510000) | 243240 (45000-510000) | 292500 (75000-510000) |
| BT (min) | 3.1 (2-4) | 3 (2-4) | 3.8 (3-4) | 2.9 (2-4) | 2.8 (2-3) | 2.9 (2-4) | 3 (3) |
| CT (min) | 6.4 (6-7) | 6.3 (6-7) | 6.8 (6-7) | 6.3 (6-7) | 6 (6) | 6.2 (6-7) | 6 (6) |
| PT (sec) | 13 (13) | 15.4 (13-30) | 13 (13) | 13 (13) | 13 (13) | 13.4 (13-18) | 13 (13) |
| INR | 1.1 (1.1) | 1,4 (1.1-2.8) | 1.1 (1.1) | 1.1 (1.1) | 1.1 (1.1) | 1.1 (1.1-4.1) | 1.1 (1.1) |
BT: bleeding time, CT: clotting time, ESR: erythrocyte sedimentation rate, Hb: hemoglobin, INR: internationalized normal ratio, MCH: mean corpuscular hemoglobin, MCHC: mean corpuscular hemoglobin concentration, MCV: mean corpuscular volume, NcNc FRC: normocytic normochromic fragmented red blood cells; Nc hypo: normocytic hypochromic, NcNc: normocytic normochromic; PCV: packed cell volume, RBC: red blood cell, RDW: red cell distribution width, RETIC: reticulocyte count, TLC: total leukocyte count,
Out of 207 patients, only 13 patients underwent bone marrow aspiration. The bone marrow analysis showed predominance of iron deficiency in 5 patients, hemolytic anemia in 3 patients and megaloblastic anemia in 5 patients. Hematological malignancies were noted in 12 cases (25%) and non-hematological malignancies in 36 cases (75%).Hematological malignancies included chronic lymphocytic leukemia (CLL) and non-Hodgkin’s lymphoma (NHL) in 4 patients each, chronic myelogenous leukemia (CML) and multiple myeloma in 1 patient each, and acute myeloid leukemia (AML) in 2 patients. Normocytic normochromic (31/44 cases) anemia was the most common type of anemia with underlying malignancies. Gastrointestinal malignancies formed the largest group (10/36 cases) of non-hematological malignancies.
With regard to the etiologies of anemia in the elderly patients in the present study, anemia of chronic disease was seen in majority of the cases (62.3%) followed by iron-deficiency anemia (IDA) (18.8%). The association between the various etiologies and grades of anemia is depicted in Table 5. Mild-grade anemia was noted in majority cases with anemia of chronic disease (29.47%) whereas moderate-grade anemia was observed mostly in cases of anemia of chronic disease (28.5%) and IDA (10.14%). Severe-grade anemia was noted in auto-immune hemolytic anemia (0.96%).
Table 5: Association between etiology and grades of anemia
| Etiologies | Mild
n (%) |
Moderate
n (%) |
Severe
n (%) |
Total
n (%) |
| Anemia of chronic disease | 61 (29.47) | 59 (28.5) | 9 (4.35) | 129 (62.3) |
| Auto-immune hemolytic anemia | 0 | 0 | 2(0.96) | 2 (0.966) |
| Combined-deficiency anemia | 7 (3.38) | 5 (2.42) | 1 (0.48) | 13 (6.2) |
| Iron-deficiency anemia | 7 (3.38) | 21 (10.14) | 11 (5.31) | 39 (18.8) |
| Megaloblastic anemia | 1 (0.48) | 6 (2.9) | 4 (1.92) | 11 (5.3) |
| Anemia with chronic blood loss | 5 (2.42) | 2 (0.96) | 2 (0.96) | 9 (4.3) |
| Unexplained anemia | 2 (0.96) | 2 (0.96) | 0 | 4 (1.9) |
| Total | 83 (40.1) | 95 (45.89) | 29 (14.01) | 207 (100) |
In anemia of chronic disease, carcinoma was the most common (17.39%) etiology followed by hypertension (14.98%), diabetes mellitus (11.11), chronic kidney disease (8.7%), chronic obstructive pulmonary disease (5.8%), and ischemic heart disease (5.8%) (Figure 1).
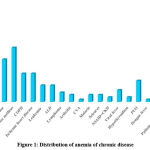 |
Figure 1: Distribution of anemia of chronic disease |
ALD: Alcoholic liver disease, COPD: Chronic obstructive pulmonary disease, CVA: Cardiovascular anemia, IHD: Ischemic heart disease, NSAID + CKD: Nonsteroidal anti-inflammatory drugs + Chronic kidney disease, PUO: Pyrexia of unknown origin
With regard to the causes of IDA, out of 39 cases,5.1% cases were hemorrhagic and 94.9% were nutritional.
Discussion
In elderly patients with high prevalence of anemia, the hemoglobin threshold or the etiology of anemia cannot be easily established. This is an important shortfall because even mild anemia can compromise a patient’s well-being and survival, regardless of the underlying cause. Anemia is recognized as a significant contributor to morbidity and mortality in elderly patients. Therefore, a better understanding of its pathophysiology is necessary for clinical intervention to improve the survival and quality of life in the aging population. Hence, the present study was specifically aimed at analyzing the hematological and clinical characteristics of anemia and investigating the etiology of this disease in elderly patients attending a tertiary care hospital.
In the present study, a slight male predominance was noted which was similar to that observed in a few other studies as well.15,19,20Thiscould be explained by the fact that beyond the age of 30 years, the concentration of free and bioavailable testosterone declines sharply in males. This could have a negative impact on the enhanced metabolic processes of the bone marrow. As the testosterone level decreases with aging, the rate of erythropoiesis also tends to decline and predispose men to increased risk of anemia.17,21
Majority of the patients in the current study had moderate (45.89%) and mild (40.1%)anemia. Similar findings were observed in studies conducted by Raina et al and Mann et al.22,23In contrast, studies carried out by Geisel et al and Tettamanti et al reported majority of patients with mild anemia.24,25Mild anemia in elderly patients often goes unscreened and undiagnosed as patients might be unaware of being anemic. The reason for more cases of moderate anemia in our study could be that the patients presented with a variety of clinical conditions either related or unrelated to anemia. In terms of hospitalizations, majority of the patients with moderate anemia were inpatients as compared to outpatients. Direct comparison with other hospital-based data is difficult because most of the data available in the literature are derived from community-dwelling residents from a university hospital anemia clinic, wherein selection bias can be assumed because of referral to a specialized outpatient clinic.
With regard to the symptoms in the present study, it was observed that generalized weakness (89.9%), anorexia (89.9%),and fatigue (85.5%)accounted for majority of the symptoms. A study conducted by Raina et al also found generalized weakness as the most common presenting symptom among the elderly anemic patients.22Studies conducted by Bhasin et al and Prakash et al reported fatigue as the most common presenting symptom in theirpatients.13,15 The reason could be lack of iron in the diet or chronic disease in these patients which could have hampered the production of RBCs. A significant association was observed between severity of anemia and symptoms such as fatigue (P=0.006), headache (P=0.04), and dyspnea (P=0.010). These results warrant early diagnosis and treatment of anemia in elderly patients to prevent its worsening.
The most common clinical sign in the present study was pallor which was observed in 97.1% of the patients which was almost similar to that in Raina et al’s study where in they reported pallor in 100% of the elderly patients.22A hospital-based study carried out by Kalantri et al reported that pallor can modestly increase the probability of severe anemia where as its absence can rule out severe anemia.26Pallor, being a subjective finding, is observer-specific and its presence could raise suspicion of anemia. Hence, further evaluation should be done to rule out the severity of anemia. Also, the severity of anemia was significantly higher (P=0.01 and P=0.0005) inpatients with pallor and nail changes, indicating severe anemia. As a result, these signs in patients could help in the accurate assessment of severity of anemia.
The most common cause of chronic blood loss in the current study was underlying malignancies which accounted for44.4%. In a study conducted by Corona et al, non-hematological malignancies accounted for about 75%.27This could be due to the remarkable number of somatic mutations in leukocytes with increase inage.28With regard to the morphological patterns of anemia, normocytic normochromic anemia was the most common (60.4%) pattern observed in the present study which is in accordance with the studies conducted by Bhasin et al, Jain et al, and Tilak et al which showed 64% of the patients with normocytic normochromic anemia.13,18,29 Anemia of chronic disease is the most common form of anemia in the elderly which may be the cause for the highest prevalence of normocytic anemia in these studies. Hence, it was concluded that the morphological pattern alone is not sufficient for etiological diagnosis of anemia and therefore, further evaluation is required for proper diagnosis.
In terms of etiology, anemia of chronic disease was the most common cause of anemia in the present study. In contrast, Bhasin et al and Alwar et al reported nutritional deficiencies as the most common cause of anemia in the elderly patients in their studies.13,30This could be due to the fact that the current study was conducted in a tertiary care center with good facilities for oncosurgical treatment and hence, more number of patients with malignancies were referred to this center. Iron deficiency was the second leading cause of anemia noted in 39 out of 207 cases in the present study. These results were almost similar to the studies conducted by Tilak et al and De Amicis et al.29,31Chronic blood loss was found to be one of the key factors for iron-deficiency anemia reported in 9 out of 207 cases.
The present study highlights the fact that most of the anemic elderly patients have an underlying treatable cause of anemia. Hence, it is essential for the treating physician to be aware of the different presenting manifestations of anemia in the elderly. It is more pertinent for elderly patients to undergo routine blood investigations regularly for the identification of anemic condition. More detailed and in-depth studies are required for a proper understanding of the burden of this disease. This study recommends the incorporation of screening for anemia as a component of comprehensive geriatric assessment.
Conclusion
The incidence of anemia was quite high among the elderly patients with chronic diseases and malignancies. The present study underlines the importance of routine screening and individual assessment of the etiological causes of anemia in the elderly, allowing for timely initiation of optimal and appropriate therapy for improvement in the overall outcome and quality of life of geriatric patients.
Acknowledgment
None.
Conflict of Interests
There are no conflicts of interest to declare.
Funding Sources
This research received no specific grant from any funding agency in the public, commercial, or any profit sectors.
References
- Miller JL. Iron deficiency anemia: A common and curable disease. Cold Spring HarbPerspect Med 2013;3(7):a011866.
CrossRef - Vanasse GJ, Berliner N. Anemia in elderly patients: An emerging problem for the 21st century. Hematology Am Soc Hematol Educ Program 2010;2010(1):271-5.
CrossRef - Worldwide Prevalence of Anaemia. WHO Report. 2005:51. Available from: https://apps.who.int/iris/ bitstream/handle/10665/43894/ 9789241596657_eng.pdf;jsessionid=55B0443892154C46D837B83E696C5F10?sequence=1. Accessed on 19 May 2020.
- Izaks GJ, Westendorp RG, Knook DL. The Definition of Anemia in Older Persons. J Am Med Assoc 1999;281:1714-7.
CrossRef - Guralnik JM, Eisenstaedt RS, Ferrucci L, Klein HG, Woodman RC. Prevalence of anemia in persons 65 years and older in the United States: Evidence for a high rate of unexplained anemia. Blood 2004;104(8):2263–8.
CrossRef - Singh T. Deficiency anaemia. In: Atlas and text of Hematology. 2nd ed. Sirmour: Avichal Publishing Company; 2011:33-55.
- Patel KV, Harris TB, Faulhaber M, Angleman SB, Connelly S, Bauer DC, et al. Racial variation in the relationship of anemia with mortality and mobility disability among older adults. Blood 2007;109:4663-70.
CrossRef - Mugisha JO, Baisley K, Asiki G, Seeley J, Kuper H. Prevalence, types, risk factors and clinical correlates of anaemia in older people in a rural Ugandan population. PLoS One 2013;8(10):e78394.
CrossRef - Smith DL. Anemia in the elderly. Am Fam Physician 2000;62(7):1565-72.
- Steensma DP, Tefferi A. Anemia in the elderly: How should we define it, when does it matter, and what can be done? Mayo Clin Proc 2007;82(8):958–66.
CrossRef - Nair MK, Iyengar V. Iron content, bioavailability & factors affecting iron status of Indians. Ind J Med Res 2009;130(5):634–45.
- Renjini BA, Raj A, Krishnendu VK, Rajiv M, Divyamol S, Rakesh PS. High prevalence of malnutrition and anemia among elderly at old age homes in Kerala, India. J Med Allied Sci 2019;9(1):32-5.
CrossRef - Bhasin A, Rao MY. Characteristics of anemia in elderly: A hospital based study in South India. Indian J Hematol Blood Transfus 2011;27(1):26–32.
CrossRef - Malhotra VM, Kabra PR, Bhayya S, Malhotra R. Prevalence and correlates of anemia among elderly population of rural Nalgonda: A cross-sectional analytic study. Public Health Review 2016;3(4):168–73.
CrossRef - Prakash KG, Devendrappa KR, Madhukumar MH, Priyashree R, Avinash B. Clinical Profile of Anaemia in Elderly: A Cross Sectional Study from aTertiary Care Centre. Sch J App Med Sci 2015;3(3C):1266-70.
CrossRef - Ferrucci L, Maggio M, Bandinelli S, Basaria S, Lauretani F, Ble A, et al. Low testosterone levels and the risk of anemia in older men and women, Arch Intern Med 2006;166(13):1380–88.
CrossRef - Carrero JJ, Bárány P, Yilmaz MI, Qureshi AR, Sonmez A, HeimburgerO, et al.Testosterone deficiency is a cause of anaemia and reduced responsiveness to erythropoiesis-stimulating agents in men with chronic kidney disease. Nephrol Dial Transplant2012;27(2):709–15.
CrossRef - Jain V. Pattern of anemia in elderly patients. Int J Res Med Sci 2019;7(7):2524-29.
CrossRef - Vojjala R, Paul MNP. Clinicopathological profile of anaemia in geriatric patients. Int Arch of Integrated Med 2017;4(12):117-21.
- Srikanth N, Sangeetha SR. Anaemia in the elderly- A clinicopathological perspective. IOSR Journal of Dental and Medical Sciences 2015;14(1):49-54.
- Ferrucci L, Guralnik JM, Bandinelli S, Semba RD, Lauretani F, Corsi A, et al. Unexplained anaemia in older persons is characterised by low erythropoietin and low levels of pro‐inflammatory markers. Br J Haematol 2007;136(6):849-55.
CrossRef - Raina A, Kumar A, Singh A, Gupta G, Malhotra P, Raina SK. A clinicohaematological profile of elderly patients being investigated for anaemia in a tertiary care centre in north-west India. Egypt J Haematol. 2014;39(4):190–4.
CrossRef - Mann S, Kumar A, Singh SK, Katyal S, Chopra G, Varma SK. Clinical Evaluation of Anemia in GeriatricPatients – A Cross Sectional Study Conducted at Tertiary Care Hospital. Natl J Community Med 2014;5(3):316-20.
CrossRef - Geisel T, Martin J, Schulze B, Schaefer R, Bach M, Virgin G, et al. An Etiologic Profile of Anemia in 405 GeriatricPatients. Anaemia2014;2014:932486.
CrossRef - Tettamanti M, Lucca U, Gandini F, Recchia A, Mosconi P, Apolone G et al. Prevalence, incidence and types of mild anemia in the elderly: The “Health and Anemia” population-based study. Haematologica 2010; 95(11):1849-56.
CrossRef - Kalantri A, Karambelkar M, Joshi R, Kalantri S, Jajoo U. Accuracy and reliability of pallor for detecting anaemia: Ahospital-based diagnostic accuracy study. PLoS One 2010; 5(1):e8545.
CrossRef - Corona LP, Duarte YA, Lebrao ML. Prevalence of anemia and associated factors in older adults- Evidence from the SABE study. Rev Saude Publica. 2014;48(5):723-31.
CrossRef - Jaiswal S, Fontanillas P, Flannick J, Manning A, Grauman PV, Mar BG, et al. Age-related clonal hematopoiesis associated with adverse outcomes. N Engl J Med 2014;371(26):2488-98.
CrossRef - Tilak V, Tilak R. Elderly anemia-A public health crisis in hematology. Indian J Prev Soc Med 2012;43(2):153-7.
- Alwar V, Reethi K, Rameshkumar K. Geriatric Anemia: An Indian Perspective. Indian J Hematol Blood Transfus 2013;29(2):126-7.
CrossRef - DeAmicis MM, Poggiali E, Motta I, Minonzio F, Fabio G, Hu C, et al. Anaemia in elderly hospitalized patients: prevalence and clinical impact. Intern Emerg Med 2015;10(5):581-86.
CrossRef

