
Manuscript accepted on :20-11-2021
Published online on: 08-12-2021
Plagiarism Check: Yes
Reviewed by: Dr. Rajesh Dumpala
Second Review by: Dr. Sally A. EL-Zahaby
Final Approval by: Dr. Ayush Dogra
Deepshi Arora1, 2 , Manish Kumar1 , Shailendra Bhatt3, Yugam Taneja4, Abhishek Tiwari5 and Varsha Tiwari5
1M.M. College of Pharmacy, Maharishi Markandeshwar (Deemed to be University), Mullana-Ambala, Haryana-133207, India
2Guru Gobind Singh College of Pharmacy, Yamuna Nagar, Haryana- 135001 India
3Department of Pharmaceutics, Department of Pharmaceutics, School of Medical and Allied Sciences, G.D. Goenka University, Gurugram, Haryana-122103 India.
4Zeon Lifesciences Pvt.Ltd, Paonta Sahib, Himachal Pradesh-173025 India
5Department of Pharmacy, Devsthali Vidyapeeth College of Pharmacy, Rudrapur, U. S. Nagar (Uttarakhand)-263148 India
Corresponding Author E-mail: manish_singh17@rediffmail.com
DOI : https://dx.doi.org/10.13005/bpj/2314
Abstract
Background: Rivastigmine Tartrate belongs to the class of cholinesterase inhibitors in Anti-alzheimer’s disease with optimum therapeutic efficacy. Till now no validated method of its quantification has been reported in simulated nasal fluid. Objective: The current research investigation aims to develop a rapid, simple, and reliable UV spectrophotometric method for the quantitative determination of the pure form of Rivastigmine Tartrate in SNF. Method: A suitable method was developed by using double beam UV spectrophotometer and selection of a suitable solvent system for estimation of Rivastigmine Tartrate at absorbance maxima 263nm in SNF. The method was validated for various parameters like including accuracy, linearity and precision as per the International Conference on Harmonization guidelines. Results: The method developed by selecting simulated nasal fluid as the solvent system satisfied the optimum condition of the good quality peak at the selected wavelength. The results proposed the developed method for Rivastigmine Tartrate quantification in the simulated nasal fluid to be linear in the working concentration range of 5-60 µg/ml with a co-relation coefficient of 0.998. The % accuracy was found to be 99.8 -100.57. The % RSD values were < 2 while LOD & LOQ values were detected to be 0.316 and 1.053 respectively. Conclusion: The stated method was analyzed to be rapid, accurate, reliable, and precise. Further, it can be used in checking the quality control parameters of the Rivastigmine Tartrate in routine analysis.
Keywords
Inter-Day; Intra-Day; Rivastigmine; Spectrophotometer; Simulated Nasal Fluid
Download this article as:| Copy the following to cite this article: Arora D, Kumar M, Bhatt S, Taneja Y, Tiwari A, Tiwari V. UV Spectrophotometric Method for Quantification of Rivastigmine Tartrate in Simulated Nasal Fluid: Development and Validation. Biomed Pharmacol J 2021;14(4). |
| Copy the following to cite this URL: Arora D, Kumar M, Bhatt S, Taneja Y, Tiwari A, Tiwari V. UV Spectrophotometric Method for Quantification of Rivastigmine Tartrate in Simulated Nasal Fluid: Development and Validation. Biomed Pharmacol J 2021;14(4).Available from: https://bit.ly/31x36pd |
Introduction
Rivastigmine Tartrate (RT), structure shown in Fig 1, is an acetylcholinesterase inhibitor that inhibits both the acetylcholinesterase and butyrylcholinesterase enzymes reversibly, which has been found to be superior in terms of specificity of action and minimal side effects 1.
 |
Figure 1: Structure of Rivastigmine Tartrate |
Literature survey revealed that it is widely used for mild to severe stages of Alzheimer 2-3, including treatment of dementia that is associated with Parkinson’s disease as it improves cognition, ADL and global function 4. RT was the first approved drug to be marketed for Alzheimer’s in Switzerland in the year 1997, and then became popular in 80 countries worldwide, including the Canada, Europe etc 5. RT cause minimal interactions when taken with other drugs especially in elderly individuals, who are on different medications for concurrent illness that increase its importance further in the market 6. Though it is BCS class 1 drug and has both good solubility and permeability, still its use is limited due to its low bioavailability 7, poor penetration through BBB 8, short half-life and gastrointestinal side effects when administered orally 9. It is freely soluble in a wide range of solvents 10 like distilled water, ethanol, acetone, phosphate buffers etc and shows absorption maxima at 263 nm. To solve problems like short half life, poor penetration across BBB 11 due to presence of efflux transporters and gastrointestinal disorders various lipid particulate systems like SLNs 12 and NLC 13, nanocarriers like polymeric nanoparticles, nanosponges have been developed.
As UV spectrophotometry is rapid, accurate and reliable 14 it continues to be a popular method for quantitative determination of drugs 15. The research aimed to formulate an intranasal delivery of RT to bypass the BBB for its increased bioavailability so the solubility of drug in SNF was eminent and it is evident from the literature review that there is lack of simple method for UV determination of RT in simulated nasal fluid 16-17. Therefore, the current research findings aim to develop and validate a method using UV-Visible spectrophotometer in SNF for the estimation of RT.
Materials and Methods
Chemicals
RT was procured as a gratis sample from Alembic Pharmaceuticals (Vadodra, Gujarat). Potassium chloride, Sodium chloride and Calcium chloride were purchased from Sigma Aldrich, Bangalore, India. The other reagents that were used were of analytical grade. Double distilled water was used.
Method development
Instrumentation
The spectrophotometric analytical determination of RT was done by using UV- Visible Spectrophotometer (Kyoto, Japan) 18 having model no.1601 with a pair of quartz cells and 10 mm path length.
Preparation of SNF
Simulated nasal fluid was prepared by dissolving accurately weighed (1.29 mg/ml) KCl, (7.45 mg/ml) NaCl, (0.32 mg/ml) CaCl2.2H2O in 1000 ml of distilled water. Orthophosphoric acid was used to adjust the pH of solution to 6.35.
Standard stock solution
Stock solution I
Primary standard stock solution of 1mg/ml(1000 µg/ml) of RT was prepared by dissolving pure drug 25 mg in a volumetric flask of 25 ml with SNF and the resultant solution will give the concentration of 1000 µg/ml . Primary stock solution was stored at refrigerating conditions.
Stock solution II
From the primary standard stock solution prepared, aliquot of 1ml was transferred to 10 ml of volumetric flask to get a secondary stock solution with concentration of 100µg/ml. After that different test solutions of concentration (5–60)µg/ml was prepared by transferring aliquots to a 10 ml volumetric flask and their volume was made up with SNF.
Determination of lambda max (λmax)
RT-test solution of 50 µg/ml was prepared and then scanned at a wavelength of 200 to 400 nm against the blank. The λmax obtained for the prepared solution was noted where absorbance was found to be maximum and considered as absorption maxima which will be used used for preparation of the calibration curve.
Calibration Curve of Rivastigmine Tartrate in SNF
RT calibration curve was prepared in SNF. The test solutions prepared were shaken properly before checking the absorbance at 263nm (Fig 2) against SNF as the blank solvent. The procedure was performed in triplicate and the mean absorbance was noted.
 |
Figure 2: Preparation of RT test solutions(5-60 µg/ml) in SNF |
Analytical method Validation
Linearity [19]
Linearity is the ability of an analytical method to produce the observed concentrations results of the tested samples proportionally to the theoretical concentration of analyte in the measured samples either directly or by a suitable mathematical transformation. The calibration curve of abs. vs conc. was plotted in which dependent variable (absorbance Y) was taken on Y axis as a function of an independent variable (concentration X) on X-axis.
Accuracy[19]
An analytical method is said to be accurate if the obtained test results are closer to the theoretical value. % Analyte recovery studies is performed at three levels 50,100 and 150 % and the test solutions are analyzed by the proposed methods and observed concentrations are back calculated using the regression equation obtained from the prepared calibration curve and compared with the theoretical concentrations.
Precision
Precision of the developed method is done to check the reliability, reproducibility and repeatability in case the same analytical procedure is applied repeatedly used on the same sample under normal experimental conditions agreement among individual test results when the procedure is applied repeatedly to multiple sampling of homogenous sample 10. Inter- day and intra-day precision of the samples was carried out at three quality control concentrations (Low, Medium, High) and the variations in the results are expressed as %RSD 20.
Limit of Detection (LOD)
LOD can be quantified as the minimal analyte concentration that is detectable in a sample under given experimental conditions with acceptable degree of precision and accuracy. The values of LOD for a given sample are specific under specified conditions and for a given set of experimental conditions. Its a quantitative method whose values changes with the change in method, instrument etc 20.
LOQ is the lowest analytical concentration of a tested sample within a sample set that may be measured and its value is almost 10 times higher than that of the blank.
Robustness
The robustness of the method was determined by selecting concentration of RT-test solution of 30 µg/ml as working concentration and changing the wavelength by 263 nm.
Repeatability
Repeatability of RT-test solution was also determined by the same working concentration (30 µg/ml) for six times.
Results and discussion
Determination of UV absorbance maxima and preparation of calibration curve
The maxima absorption of the RT-test solution was obtained at 263 nm which has not been reported earlier in SNF and can be seen in the Fig 3. The test solutions were scanned at different concentrations of the RT-solution and overlay plot was obtained as shown in the Fig 4.
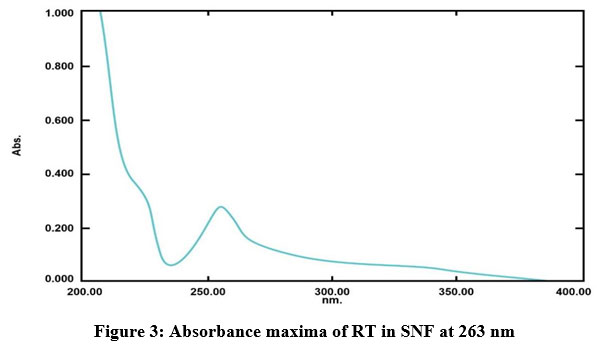 |
Figure 3: Absorbance maxima of RT in SNF at 263 nm |
 |
Figure 4: Overlay plot of RT test solutions (5-60) µg/ml in SNF |
Linearity
The data obtained for linear regression of RT-test solutions over the range of (5– 60) µg/ml shows good linearity in the range of (5-60) µg/ml with low limits of standard deviation that reveals that solutions have good consistency. The linear regression equation was found to be y = 0.017x -0.023 and R² = 0.998 as shown in Fig 5 and Table 1.
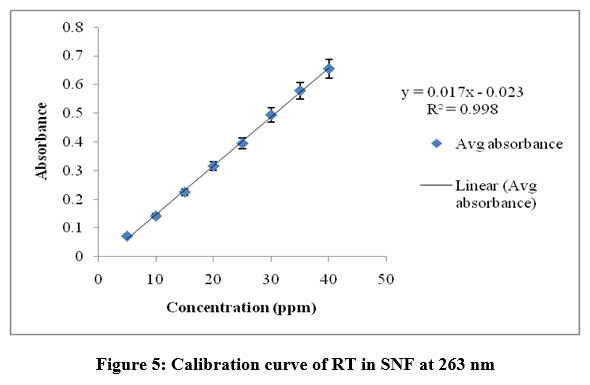 |
Figure 5: Calibration curve of RT in SNF at 263 nm |
Table 1: Linearity results of RT test solutions in SNF
| Simulated nasal Fluid | 5-60 µg/ml | 3 | 5-60 µg/ml | y = 0.017x -0.023 | R2 = 0.998 |
Accuracy
The accuracy of the re-analyzed RT-Test solutions prepared in SNF ranged from 99.8-100.57% as recorded in the table.The results of recovery studies suggest the accuracy of method as shown in Table 2.
Table 2: %Accuracy results of RT test solutions in SNF
| Theoretical
Concentration (µg/ml) |
Calculated
Concentration (µg/ml)* (±SD) |
% Accuracy |
| 5 | 5.02 ± 0.0013 | 100.40 |
| 30 | 29.96 ±0.0015 | 99.8 |
| 60 | 60.32 ±0.0025 | 100.57 |
| Average | 100.2 |
Precision
The %RSD results for intra- and inter day variability are typically low i.e <2% and <1% respectively of the absolute value which signifies that the developed method for estimation at all the concentration level is optimum. The results for both the inter-day and intra-day precision are shown in Table 3 and Table 4 respectively.
Table 3: Inter-Day Precision Studies
| Run# | Inter-Day Precision Studies | |||||
| Low QC of RT, 5 µg/ml |
Medium QC of RT, 30µg/ml | High QC of RT, 60 µg/ml |
||||
| Observed | % Relative | Observed | % Relative | Observed | % Relative | |
| Conc. | Error | Conc. | Error | Conc. | Error | |
| SET 1 | ||||||
| RUN 1 | 5.02 | 0.4 | 30.14 | 0.47 | 60.12 | 0.200 |
| RUN 2 | 4.96 | -0.8 | 29.69 | -1.03 | 60.96 | 1.600 |
| RUN 3 | 5.05 | 1 | 30.11 | 0.37 | 61.42 | 2.367 |
| MEAN | 5.01 | 0.2 | 29.98 | 60.833 | 1.389 | |
| SD | 0.045826 | 0.205 | 0.538 | -99.103 | ||
| %RSD | 0.914686 | 0.685 | 0.884758 | -98.525 | ||
| RUN 1 | 4.99 | -0.2 | 30.25 | 0.83 | 60.59 | 0.983 |
| RUN#2 | 5.11 | 2.2 | 29.55 | -1.50 | 59.95 | -0.083 |
| RUN#3 | 5.12 | 2.4 | 29.86 | -0.47 | 59.25 | -1.250 |
| MEAN | 5.073333 | 29.887 | 59.930 | |||
| SD | 0.072342 | 0.351 | 0.670 | |||
| %RSD | 1.425922 | 1.174 | 1.118 | |||
| RUN#1 | 4.99 | -0.2 | 30.49 | 1.63 | 60.16 | 0.267 |
| RUN#2 | 5.11 | 2.2 | 30.99 | 3.30 | 60.66 | 1.100 |
| RUN#3 | 5.09 | 1.8 | 31.4 | 4.67 | 59.25 | -1.250 |
| MEAN | 5.063333 | 30.96 | 60.023 | |||
| SD | 0.064291 | 0.46 | 0.715 | |||
| %RSD | 1.269737 | 1.4720322 | 1.191 | |||
Table 4: Intra-Day Precision Studies
| Run# | Intra- Day Precision Studies | |||||
| Low QC of RT, 5 µg/ml |
Medium QC of RT, 30µg/ml | High QC of RT, 60 µg/ml |
||||
| Observed | % Relative | Observed | % Relative | Observed | % Relative | |
| Conc. | Error | Conc. | Error | Conc. | Error | |
| SET 1 | ||||||
| RUN#1 | 5.02 | 0.4 | 30.29 | 0.97 | 60.32 | 0.533 |
| RUN#2 | 4.98 | – 0.4 | 29.87 | – 0.43 | 60.45 | 0.750 |
| RUN#3 | 5.09 | 1.8 | 30.15 | 0.50 | 61.02 | 1.700 |
| MEAN | 5.03 | 0.6 | 30.1033 | 60.597 | 0.994 | |
| SD | 0.05567764 | 0.175 | 0.304 | -99.493 | ||
| %RSD | 1.1069114 | 0.580 | 0.50169 | -99.164 | ||
| RUN#1 | 5.01 | 0.2 | 30.35 | 1.17 | 59.89 | -0.183 |
| RUN#2 | 5.11 | 2.2 | 29.48 | -1.73 | 59.65 | -0.583 |
| RUN#3 | 5.02 | 0.4 | 29.99 | -0.03 | 60.79 | 1.317 |
| MEAN | 5.05 | 29.940 | 60.110 | |||
| SD | 0.05507571 | 0.437 | 0.601 | |||
| %RSD | 1.09132838 | 1.460 | 1.000 | |||
| RUN#1 | 4.99 | -0.2 | 29.89 | -0.37 | 61.16 | 1.933 |
| RUN#2 | 5.03 | 0.6 | 30.29 | 0.97 | 60.26 | 0.433 |
| RUN#3 | 5.55 | 11 | 30.15 | 0.50 | 59.55 | -0.750 |
| MEAN | 100.2567 | 30.11 | 60.323 | |||
| SD | 0.261024 | 0.20 | 0.807 | |||
| %RSD | 0.260355 | 0.67412 | 1.338 | |||
LOD and LOQ
The sensitivity of the proposed method was detected by LOD and LOQ whose value was found to be 0.316 and 1.053 respectively as shown in the Table 5.
Table 5. Values of LOD and LOQ for RT
| Conc(µg/ml) | Absorbance (Avg) | Std. Dev | LOD | LOQ |
| 5 | 0.072 | 0.002 | 0.353 | 1.176 |
| 10 | 0.142 | 0.0013 | 0.229 | 0.765 |
| 15 | 0.225 | 0.003 | 0.529 | 1.765 |
| 20 | 0.316 | 0.0011 | 0.194 | 0.647 |
| 25 | 0.395 | 0.0021 | 0.371 | 1.235 |
| 30 | 0.494 | 0.001 | 0.176 | 0.588 |
| 35 | 0.569 | 0.00258 | 0.455 | 1.518 |
| 40 | 0.623 | 0.00211 | 0.372 | 1.241 |
| 45 | 0.674 | 0.0011 | 0.194 | 0.647 |
| 50 | 0.715 | 0.0022 | 0.388 | 1.294 |
| 55 | 0.775 | 0.0019 | 0.335 | 1.118 |
| 60 | 0.835 | 0.0011 | 0.194 | 0.647 |
| Average | 0.316 | 1.053 |
Robustness
When λ max was varied within a limit of ± 2.0 nm, the % recovery data obtained lied in between 99.804 to 100.784 with a ± 2% confidence interval. The results of the robustness data are shown in Table 6.
Table 6: Results of Robustness
| S.No | Conc(µg/ml) | λ max | Analyzed Conc. | Abs(Avg.) | Std.Dev | % RSD | % Assay |
| 1 | 30 | 261 | 30.118 | 0.489 | 0.013 | 0.0432 | 100.392 |
| 2 | 30 | 263 | 30.235 | 0.491 | 0.015 | 0.0498 | 100.784 |
| 3 | 30 | 265 | 29.941 | 0.486 | 0.011 | 0.0365 | 99.804 |
Repeatability
The repeatability of the proposed method was evaluated by analyzing 30 µg/ml RT-test solution for a set of six times. The value of % RSD was found to be < 2 as shown in Table 7.
Table 7: Repeatability Result for RT-test solutions
|
Conc (µg/ml) |
Avg. conc. (n=6) |
Std.dev | %RSD |
| 30 | 30.113 | 0.0015 | 0.004981 |
Summary
The validation parameters evaluated as per the proposed methods are found within the chosen range. The summary is shown in Table 8.
Table 8: Results of validated parameters
| Validation parameter | Results |
| Absorption maxima (nm) | 263 nm |
| Regression equation | 0.017x-0.023 |
| Linearity range (µg/ml) | 5-60 µg/ml |
| Slope (m) | 0.017 |
| Intercept (c) | 0.023 |
| Value of R2 | 0.998 |
| % Recovery | 100.25 % |
| Inter-day | 0.685-1.472 |
| Intra-day | 0.260 -1.338 |
| Value of LOD | 0.316 |
| Value of LOQ | 1.053 |
Conclusion
The created UV spectrophotometric strategy is exact, straightforward, fast, exact, solid, delicate, reproducible, and prudent for the assurance of RT and its drug tablet dose structures. The reagents used in the proposed strategies are monetary, promptly accessible and the methodology doesn’t include any basic response conditions or dreary example readiness. The techniques are more specific than a significant number of the revealed spectrophotometric strategies and utilize higher frequencies to gauge absorbance readings where the blunders because of idle fixings are limited generally. The strategies are liberated from obstructions from the normal excipients. The measurable boundaries and the recuperation information uncover great exactness and accuracy of the techniques. These strategies can be utilized as broad techniques for the assurance of RT in mass powder and measurements structures. The techniques enjoy numerous upper hands over the division procedures like HPLC and incorporate diminished expense, and speed with high exactness. Subsequently, the strategies can be utilized in routine examination of medications in quality control labs.
Acknowledgement
Authors are thankful to Alembic Pharmaceuticals (Vadodra, Gujarat) for providing RT as a gift sample and Maharishi Markandeshar (Deemed to be) University (Mullana,Haryana) and Guru Gobind Singh College of Pharmacy (Yamunanagar, Haryana) for providing space and chemicals to carry out the research work.
Conflict of Interest
There is no conflict of interest.
Funding Sources
There is no funding source.
References
- Ferri CP, Prince M, Brayne C et al. Global prevalence of dementia: a Delphi consensus study. Lancet 2005; 366:2112-2117.
CrossRef - Cummings BJ,Cotman CW. Image analysis of β-amyloid load in Alzheimer’s disease and relation to dementia severity. Lancet 1995; 346:1524-1528
CrossRef - Polinsky RJ. Clinical pharmacology of rivastigmine:a new-generation acetylcholinesterase inhibitor for the treatment of Alzheimer’s disease. Clin. Ther 1998; 20:634-647.
CrossRef - Corrada MM, Brookmeyer R ,Paganini-Hill A et al. Dementia incidence continues to increase with age in the oldest old: the 90+ study. Ann. Neurol 2010; 67:114-121.
CrossRef - Raschetti R, Albanese E, Vanacore N et al.Cholinesterase inhibitors in mild cognitive impairment: a systematic review of randomised trials. PLOS Med 2007; 4:e338.
CrossRef - Barnes DE, Yaffe K. The projected effect of risk factor reduction on Alzheimer’s disease prevalence. Lancet Neurol 2011;10:819-828.
CrossRef - Mutlu NB, Degim Z. Bioavailability file: Rivastigmine tartrate. Fabad J.Pharm Sci 2005;30:150.
- Pardridge WM. The blood-brain barrier:bottleneck in brain drug development. NeuroRx 2005; 2:3-14.
CrossRef - Misra A, Ganesh S, Shahiwala A et al. Drug delivery to the central nervous system: a review. Int. J. Pharm. Sci. Res 2003;6:252-273.
- Sharma S, Sharma JB, Bhatt S et al. Method development and validation of UV spectrophotometric method for the quantitative estimation of curcumin in simulated nasal fluid. Drug Res 2020;70:356-359.
CrossRef - Vijaya Raghavan C, Tamil Selvan N, Balakumar K et al. Blood Brain Barrier: Surface Modified Nanocarriers and In Vitro Models to Treat Alzheimer’s disease – A Review. Int. J. Adv. Pharm. Res 2012;798-804.
- Singh MP, Kumar M, Shankar R. Development and Optimization of Methscopolamine Bromide Gastroretentive Floating Tablets Using 32 Factorial Drug Res 2020;70:576-582.
CrossRef - Frey WH. Intranasal delivery:Bypassing the blood-brain barrier to deliver therapeutic agents to the brain and spinal cord. Drug Deliv Technol 2002; 2:46-49.
- Shukla D, Chakraborty S, Singh S et al. Lipid-based oral multiparticulate formulations–advantages, technological advances and industrial applications. Expert Opin. Drug Deliv 2011; 8:207-224.
CrossRef - Schwarz C, Mehnert W, Lucks JS et al.Solid lipid nanoparticles (SLN) for controlled drug delivery. I. Production, characterization and sterilization.J. Control. Release 1994; 30: 83-96.
CrossRef - Pulido A, Ruisanchez I, Boque R et al. Uncertainty of results in routine qualitative analysis. Trends Anal. Chem 2003; 22:647-654.
CrossRef - Bhatt J, Subaiah G, Kambli S. et al. A rapid and sensitive liquid chromatography tandem mass spectrometry (LC-MS/MS) method for estimation of rivastigmine in human plasma. Electrophoresis. 2007; 852:115-121
CrossRef - Illum L. Nasal drug delivery—possibilities, problems and solutions. J.Control. Release.2003;87:187-198.
CrossRef - Katariya H, Prajapati J. Development and validation of UV Spectrophotometric method for determination of isradipine loaded into solid lipid nanoparticles. Int J Pharm Sci Rev. 2013;20:162-166.
- Jadhav K, Dhamecha D, Tate A et al. Application of UV spectrophotometric method for easy and rapid estimation of lafutidine in bulk and pharmaceutical formulation. Pharm. Methods. 2011;2:264-267.
CrossRef

