
Manuscript accepted on :08-12-2021
Published online on: 21-12-2021
Plagiarism Check: Yes
Reviewed by: Dr. Hind Shakir
Second Review by: Dr. Ceren Acir
Final Approval by: Dr. Francesca Gorini
Tarso Rudiana1* , Nani Suryani1, Dimas D. Indriatmoko2, Yusransyah Yusransyah3, Muhammad A. Hardiyanto4, Ricky Yohanes4, Siti Nurbayti4, Eka Nurdiansyah2, Hidayatul Fajri1, Noviany Noviany5, Sutopo Hadi5
1Department of Chemistry Faculty of Science, Pharmacy and Health, Universitas Mathla’ul Anwar, Jalan Raya Labuan-Pandeglang KM 23, Pandeglang Banten 42273, Indonesia
2Department of Pharmacy Faculty of Science, Pharmacy and Health, Universitas Mathla’ul Anwar, Jalan Raya Labuan-Pandeglang KM 23, Pandeglang Banten 42273, Indonesia
3Department of Pharmacy, Sekolah Tinggi Ilmu Kesehatan Salsabila, Jalan Raya Serang-Pandeglang KM 06 No. 33 Serang Banten 42211, Indonesia
4Department of Chemistry Faculty of Science and Technology, Universitas Islam Negeri (UIN) Syarif Hidayatullah Jakarta, Jalan Ir. H. Juanda No. 95, South Tangerang Banten 15412, Indonesia
5Department of Chemistry Faculty of Mathematic and Natural Sciences Universitas Lampung, Bandar Lampung, Lampung 35141, Indonesia
Corresponding Author E-mail: tarso.rudiana@gmail.com
DOI : https://dx.doi.org/10.13005/bpj/2293
Abstract
Gandaria (Bouea macrophylla Griff) is a typical Asian plant that is commonly found in In-donesia with various secondary metabolite compounds such as phenolic, flavonoid and ter-penoid. The purpose of this study was to isolate secondary metabolites from the stem extract of B. macrophylla and determine their activity against cancer cells MCF-7, A549, MDA-MB 231 and HCC-1954. The isolation of the compounds was conducted using various chromatographic techniques, the determination of the chemical structure of the isolates was performed using physicochemical methods including mass spectrometer and nuclear magnetic resonance, the determination of anticancer activity was carried out using 3-(4,5-dimethylthiazol-2-yl)-5-(3-carboxymethoxyphenyl)-2-(4-sulfophenyl)-2H-tetrazolium (MTS) i.e. MCF-7 and A549 cell lines; and dimetiltiazol-2-il) -2,5-diphenyltetrazolium bromide (MTT) for MDA-MB 231 and HCC-1954 cell lines. Four compounds namely stigmasterol (1), fustin (2), garbanzol (3) and methyl galat (4) were successfully isolated from the stem extract of B. macrophylla, which was obtained from Serang Regency, Indonesia. These compounds were then tested their anticancer activity against the cancer cells of Michigan Cancer Foundation-7 (MCF-7), human alveolar epithelial cells (A549), human breast cancer cell line-1954 (HCC-1954) and M.D. Anderson-Metastatic Breast-231 (MDA-MB-231). The results of anticancer test indicated that based on the IC50 values for all compounds tested, the compounds 2 and 4 were more active on HCC-1954 cell with IC50 values of 134.35 ± 44.62 and 153.69 ± 12.54 µg/mL, respectively, while the compound 3 was found to be the most active against MDA-MB-231 cell line with IC50 value of 233.41 ± 91.57 µg/mL
Keywords
Anticancer, B. Macrophylla, Cytotoxicity, Phytoconstituents
Download this article as:| Copy the following to cite this article: Rudiana T, Suryani N, Indriatmoko D. D, Yusransyah Y, Hardiyanto M. A, Yohanes R, Nurbayti S, Nurdiansyah E, Fajri H, Noviany N, Hadi S. The Anticancer Activity of Phytoconstituents of the Stem of Bouea macrophylla. Biomed Pharmacol J 2021;14(4). |
| Copy the following to cite this URL: Rudiana T, Suryani N, Indriatmoko D. D, Yusransyah Y, Hardiyanto M. A, Yohanes R, Nurbayti S, Nurdiansyah E, Fajri H, Noviany N, Hadi S. The Anticancer Activity of Phytoconstituents of the Stem of Bouea macrophylla. Biomed Pharmacol J 2021;14(4). Available from: https://bit.ly/3qkdF75 |
Introduction
The B. macrophylla (Anacardiaceae) is a high fruit-producing plant rich in antioxidant compounds. It is common in Indonesia, especially on the islands of Sumatra, Java, Kalimantan and Maluku.1, 2 The methanol extract of B. macrophylla fruit has antioxidant activity with an IC50 value of 16.29 mg/mL.2 The methanol extract and the fruit skin as well as the fruits of B. macrophylla has been reported to be active as antioxidant.3-7 The fruit of B. macrophylla contains compounds of flavonoid class with an antioxidant activity value of IC50 2.43 μg/mL, using in vitro 2,2-Diphenyl-1-Picrylhydrazyl (DPPH) radical scavenging activity method.1, 7 The antioxidant activity has an important correlation with anticancer activity. Kulsum et al. (2018) reported that the activity of antioxidants is proportionally correlated with anticancer activity in the test of amla and ginger extract with a probability value under 0.05.8 Their results indicated that compounds in the extract with an excellent antioxidant activity also have good anticancer activity. Gandaria has been reported to show a good antioxidant activity; thus it makes gandaria has possibility to show a good anticancer activity, too.
Andina and Musfirah reported that the ethanol extract of B. macrophylla leaves has strong antioxidant activity with an IC50 value of 55.83 μg/mL.9 They also demonstrated that the antioxidant activity of the ethanol extract of the stem bark of B. macrophylla with an IC50 value of 20.03 mg/mL is greater than that of the leaf ethanol extract with an IC50 value of 55.83 mg/mL.9 According to Rudiana et al. (2018)10 the ethyl acetate extract from gandaria stems (B. macrophylla) has the best antioxidant activity compared to n-hexane and methanol extracts with an IC50 value of 4.89 µg/mL.
The seed extract of B. macrophylla has been reported to have anticancer activity against human hypopharyngeal FaDu (HTB-43), MCF-7 and MDA-MB-231 cells with IC50 values of 34.36; 59.07; 28.65 μg/mL, respectively.11 The seed extract of B. macrophylla contains pentagalloyl glucose and ethyl gallate compounds, which can inhibit MCF-7 cells through the apoptotic pathway.11-13 Besides that, the seed extract of B. macrophylla can inhibit the growth of leukemia and lung cancer cells with IC50 values ranging from 3 to 45 μg/mL.11, 12
The exploration of pure phytoconstituents isolation of the stem of B. macrophylla has not been investigated. In our previous work, two compounds, luteolin and naringenin, have been identified in the ethyl acetate extract of B. macrophylla stem using liquid chromatography-mass spectrometry. Still, they were not isolated.14 The previous works on B. macrophylla mostly focused on the chemical content of their extracts.10-14 The present work aims to study the isolation of of secondary metabolites in the stem of B. macrophylla and determined the anticancer activity of the compounds isolated against MCF-7, HCC-1954, MDA-MB-231, and A549 cell lines.
Materials and Methods
Plant Material
The stem of B. macrophylla was obtained from Serang District, Banten Province of Indonesia and identified at the Herbarium Bogoriense, a Center for Biological Research, Indonesian Institute of Research, Cibinong with voucher specimen number of 1068/IPH.1.01./If.07/VI/2018.
General Experiment
Thin layer chromatography analysis was carried out using silica gel on an aluminum layer (Merck Kieselgel 60 F254), monitoring TLC under UV lamps 254 and 365 nm. The vacuum liquid chromatography was performed using silica gel 60 G (Merck) as the stationary phase and silica gel 60 (Merck) in chromatography gravity column. The chemical structure of the isolates was determined using spectroscopic techniques including mass spectroscopy (Waters UPLC-MS/MS H-Class TQD), and 1H- and 13C-NMR spectroscopy which were obtained with JEOL ECA 500 with frequencies at 500 MHz and 125 MHz, respectively.
Extraction and Isolation
The stem powder of B. macrophylla (7.6 kg) was macerated in stages with n-hexane, ethyl acetate, and methanol (Technical, Pha Che, Indonesia) for 3 x 24 hours each using similar procedure available in the literatures.15, 16 Each extract was tested anticancer activity against MCF-7, HCC 1954, MDA-MB 231, and A549 cell lines. The n-hexane extract (21 g) was separated by VLC using the mobile phase n-hexane: ethyl acetate: methanol: acetone: methanol in a 10% polarity gradient in such a way that the A-B fraction was obtained. Fraction A was purified by CC using n-hexane, ethyl acetate as the stationary phase to produce compound 1 (28 mg).
The ethyl acetate extract (19.90 g) was separated by VLC using methylene chloride: ethyl acetate: ethanol as the mobile phase to produce the A-K fraction. The G fraction (594.70 mg) was purified by CC using n-hexane: MTC: ethyl acetate as the mobile phase to produce compound 2 (5.1 mg). The methanol extract (15 g) was separated by VLC using n-hexane: ethyl acetate: methanol in 10% gradient as the mobile phase to obtain the A-J fraction. The G fraction (778.2 mg) was purified by CC using n-hexane: ethyl acetate as the mobile phase to produce compound 3 (4.7 mg). Fraction J (7 g) was purified by CC using n-hexane: ethyl acetate: methanol in a polarity gradient to give compound 4 (20 mg).
Anticancer Activity
The anticancer activity of MCF-7 breast adenocarcinima (ATCC HTB-22) and A549 Lung Carcinoma (ATCC CCL-185) cell lines were analysed using the MTS assay method which were carried out at The Biological Activity Laboratory, the Central Laboratory, Universitas Padjadjaran, Bandung, Indonesia: the cells were cultured on RPMI media (Sigma-Aldrich) containing 10% FBS and antibiotics, and trypsin-EDTA was added and incubated for 5 minutes. When the growth of cells reached confluent level where the numbers of cell lines were minimum 70%, they were then transferred to 96-microtube well plates, and each of the microtube was added with samples of various concentrations and incubated for 48 hours. The mixture was then added with presto blue gluing as cell staining and incubated for 1-2 hours until a discoloration was observed. PrestoBlue® reagent is reduced by the blue compound resazurin to resorufin, which is pink and very fluorescent. The absorbance measurements were carried out at 570 nm (resorufin) and 600 nm (resazurin) wavelengths using a multimode reader, and cisplatin was used as a positive control and DMSO as a negative control.17
The anticancer activity against HCC 1995 and MDA-MB 231 cell lines was analyzed using the MTT assay method which were carried out at The Culture Cell and Cytogenitics Laboratory, Medical Faculty, Universitas Padjadjaran, Bandung, Indonesia. The HCC-1954 and MDA-MB-231 cells were cultured in RPMI 1640 media (Sigma-Aldrich) containing 10% fetal calf serum, antibiotics, and streptomycin. The cells and media were incubated for 24 hours, and then the cells were then added with samples with various concentrations and phosphate buffer saline. Furthermore, the mixture was then incubated again for 24 hours, and 3-(4,5- Dimetiltiazol-2-il)-2,5-diphenyltetrazolium bromide (MTT) compound was added to each well containing 15,000 cells and incubated for 2 hours. The MTT reaction was stopped using n-hexane, and the absorbance of the reaction was measured using an ELISA reader at a wavelength of 550 nm.18
Results and Discussion
The Isolated Compounds
Four compounds were successfully isolated. The separation is guided by spot pattern. The compounds were as follows: Stigmasterol (1) (Figure 1): colourless crystal, 1H-NMR (in CDCl3, 500 MHz) δH (ppm) 1.83 (2H, m, H-1); 1.51 (2H, t, H-2); 3.53 (1H, m, H-3); 2.26 (2H, d, J=6.5 Hz, H-4); 5.33 (1H, d, J=4.9, H-6); 1.97 (2H, m, H-7); 1.47 (1H, m, H-8); 0.95 (1H, m, H-9); 1.50 (2H, m, H-11); 1.97 (2H, m, H-12); 1.05 (1H, m, H-14); 1.52 (2H, m, H-15); 1.23 (2H, m, H-16); 1.15 (1H, m, H-17); 0.66 (3H, s, H-18); 0.99 (3H, s, H-19); 1.97 (1H, m, H-20); 1.00 (3H, d, J=9.7 Hz, H-21); 5.13 (1H, m, H-22); 5.12 (1H, m, H-23); 1.47 (1H, m, H-24); 1.81 (1H, m, H-25); 0.81(3H, d, J= Hz, H-26); 0.82 (3H, m, H-27); 1.15 (2H, m, H-28) and 0.78 (1H, s, H-29). 13C-NMR (in CDCl3, 125 MHz): δC (ppm): 36.3 (C-1); 32.5 (C-2); 71.9 (C-3); 42.3 (C-4); 140.9 (C-5); 120.7 (C-6); 32.0 (C-7); 32.0 (C-8); 50.3 (C-9); 36.5 (C-10); 21.4 (C-11); 39.2 (C-12); 42.4 (C-13); 56.9 (C-14); 24.5 (C-15); 29.2 (C-16); 56.2 (C-17); 12.2 (C-18); 19.5 (C-19); 39.9 (C-20); 23.2 (C-21); 138.5 (C-22); 129.4 (C-23); 51.4 (C-24); 31.8 (C-25); 20.0 (C-26); 21.2 (C-27); 25.6 (C-28) and 12.2 (C-29). UPLC-QTOFMS m/z 411.24 [M-] (calculated (calcd.) for C29H48O, m/z 412.69).
Fustin (2) (Figure 1): yellow amorphous, 1H-NMR (in acetone-d6, 500 MHz) δH (ppm): 6.40 (1H, d, J = 2.5 Hz, H-8); 6.62 (1H, dd, J = 8.5 and 2 Hz, H-6); 6.86 (1H, dd, J = 8 and 2.5 Hz, H-5’); 6,92 (1H, td, J = 8 and 2 Hz, H-6’); 7.07 (1H, d, J = 2.5 Hz, H-2’); 7.72 (1H, d, J = 8.5 Hz, H-5); 4.98 (1H, d, J = 12 Hz, H-2) and 4.53 (1H, d, J = 11.5 Hz, H-3). 13C-NMR (in acetone-d6, 125 MHz): δC (ppm): 74.0 (C-3); 85.0 (C-2); 103.1 (C-8); 111.8 (C-6); 115.8 (C-2’); 113.1 (C-10); 115.9 (C-5’); 120.9 (C-6’); 129.8 (C-5); 130.1 (C-1’); 145.8 (C-4’); 146.6 (C-3’); 164.6 (C-9); 165.8 (C-7); and 193.2 (C-4). UPLC-QTOFMS m/z 287.28 [M–] (calcd. for C15H12O6, m/z 288.25).
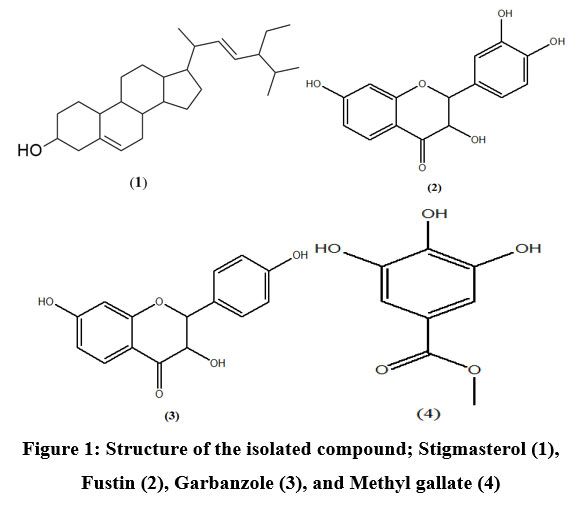 |
Figure 1: Structure of the isolated compound; Stigmasterol (1), Fustin (2), Garbanzole (3), and Methyl gallate (4) |
Garbanzole (3) (Figure 1): yellow needle crystal. 1H-NMR (in acetone-d6, 500 MHz) δH (ppm): 7.70 (1H, d, J= x, H-5); 6.60 (1H, dd, H-6); 6.37 (1H, d, H-8); 7.41 (2H, d, H-2’ and 6’); 6.87 (2H, d, H-3’ and H-5’) 5.02 (1H, d, H-2); and 4.45 (1H, dd, H-3). 13C-NMR (in acetone-d6, 125 MHz): δC (ppm): 84.9 (C-2); 73.9 (C-3); 193.3 (C-4); 129.8 (C-5); 111.8 (C-6); 165,9 (C-7); 103.7 (C-8); 164.6 (C-9); 113.1 (C-10); 129.4 (C-1’); 130.4 (C-2’ and C-6’); 115.9 (C-3’ and C-5’); and 158. 9 (C-4’). UPLC-QTOFMS m/z 273.0559 [M+2] (calculated for C15H12O5, m/z 272.0559).
Methyl gallate (4) (Figure 1): yellow needle crystal. 1H-NMR (in acetone-d6, 500 MHz) δH (ppm): 3.75 ppm (3H, s,-OCH3); 7.07 (2H, s, H-2 and H-6); and 8.19 (1H, s, -OH). 13C-NMR (in acetone-d6, 125 MHz): δC (ppm): 166.3 (C-7); 145.2 (C-3 and C-5); 137.9 (C-4); 120.9 (C-1); 108.9 (C-2 and C-6); and 51,1 (-OCH3). UPLC-QTOFMS m/z 183.09 [M-] (calcd. for C15H118O5, m/z 184.15).
Compound 1 is a colorless crystal. The UPLC-QTOFMS spectrum for compound 1 has the molecular formula C29H48O, m/z 412.69. The 1H-NMR spectrum of isolate 1 is similar to the reference compound reported by others19 and it showed a typical signal for the group of steroid compound in which the signal accumulated in the area below 2 ppm δH was typical for steroids. Four signals in the δH 1.00 region (3H, d, J = 9.74 Hz); 0.81 (3H, s); 0.82 (3H, m); and 0.79 (1H, s) ppm indicated the presence of a methyl signal bound to C-21, C-26, C-27 and C-29, respectively. Furthermore, it is believed that 9 signals indicated the presence of methylene protons in the δH region of 1.82 (2H, m); 1.51 (2H, m); 2.26 (2H, d, J = 6.5 Hz); 1.97 (2H, m); 1.50 (2H, m); 1.97 (2H, m); 1.52 (2H, m); 1.23 (2H, m); 1.15 (2H, m) ppm, which is binds to C-1, C-2, C-4, C-7, C-11, C-12, C-15, C-16 and C-28 respectively. The proton signal from methine is believed to appear at δH 1.47 (1H, m); 0.95 (1H, m); 1.05 (1H, m); 1.15 (1H, m); 1, 97 (1H, m); 1.47 (1H, m); and 1.81 (1H, m) ppm bound to C-8, C-9, C-14, C-17, C-20, C-24, and C-25, respectively. There is a typical signal for olefinic protons at δH 5 ppm and there is a signal for oxygenated protons at δH 3 ppm, which is commonly reported in the class of the steroid compound.19, 20 The signal was detected as an oxygenated proton at δH 3.51 (1H, m) ppm. The signal in the region δH13 (1H, d); 5.12 (1H, m) and 5.15 (1H, m) ppm are from the olifinic methine double bond protons attached to C-6, C-20 and C-21, respectively.
Rings A, B, and C consist of six carbon or cyclohexane atoms, and ring D consists of five or cycloheptane. Furthermore, most of the steroids have properties, which includes the oxygen functional group (as = O or OH) at C-3, and contains side groups at C-17, many of which contain double bonds at C-4 – C-5 or C-5 – C-26. The carbon signal that appears in the area above δC is 100 ppm (140.9; 120.7; 138.5; and 129.4 ppm), which are at C-5, C-6, C-22, and C, respectively. C-23 was confirmed by the presence of two double bonds in the analyzed compound. The double bond signal is reported in the δC 140.9 region; 120.7; 138.5; and 129.4 ppm. The methyl signal is believed to be in the δC 12.2 (C-18) region; 19.5 (C-19); 23.2 (C-21); 20.0 (C-26); 21.2 (C-27) and 12.2 (C-29) ppm. The signal from the methylene group is believed to be present in the region: δc 36.3 (C-1); 32.5 (C-2); 42.3 (C-4); 32.0 (C-7); 21.4 (C-11); 39.2 (C-12); 24.5 (C-15); 29.2 (C-16) and 25.6 (C-28). In addition, the signal in the region 32.0 (C-8); 50.3 (C-9); 56.9 (C-14); 56.2 (C-17); 39.9 (C-20); 51.4 (C-24), and 31.8 (C-25) ppm were believed to indicate the presence of a methine group.
The quaternary carbon group containing 3 signals was predicted in the δc 140.9 (C-5) region; 36.5 (C-10) and 42.4 (C-13) ppm. Figure 1 shows that the methyl proton at position C-29 δH – 0.78 correlates with C-26 (δc – 20.0) and C-28 (δc – 25.6). The methyl proton at position C-18 (δH – 0.66) correlates with C-12, C-13, C-14 and C-17 with each value δc, namely 39.2; 42.4; 56.9; and 56.2 ppm. The methyl proton at position C-19 (δH – 0.99) correlates with C-1, C-5, C-9, and C-10 with values of δc – 36.3, δc – 141 δc – 50.1 and δc – 37. 9, respectively. The methyl protons at position C-26 (δH – 0.81) and position C-27 (δH – 0.82) correlate with C-25 (δc – 31.8). In the methyl proton δH – 0.79, the C-29 position correlates with C-28 and C-24 with δc values of 25.6 and 52.4 ppm, respectively. The position of the hydroxyl group is strengthened and proven by the correlation at C-3 with methylene protons at positions C-2 (δH -1.51) and C-4 (δH – 2.26) with carbon C-3 with values (δc – 71, 9). The position of the proton group (δH – 2.26) at C-4 also strengthens the position of the hydroxyl group, which correlates with C-3, C-5, C-2 and C-10 with the respective values of δc 71.9, 140, 9, 32.5 and 36.5 ppm. The important HMBC correlation of 1 is shown in Figure 2.
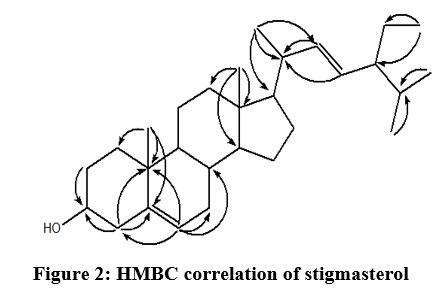 |
Figure 2: HMBC correlation of stigmasterol |
Compound 2 is a yellow amorphous solid. The 6-proton aromatic signal appears at δH 6.40 (1H, d, J = 2.5 Hz) and 6.62 (1H, dd, J = 8.5 Hz; 2 Hz), δH 6.86 (1H, dd, J = 8 Hz; 2.5 Hz), 6.92 (1H, td, J = 8 Hz; 2 Hz), and 7.07 (1H, d, J = 2.5 Hz), 7.72 (1H, d, J = 8.5 Hz). This characterization is in agreement to reported values [21]. According to Mabry et al.,22 the proton signal in the range of 6 to 8 ppm with a pattern of ortho and meta coupling values indicated that the isolates obtained are in the flavonoid group. The proton signal in the range 6.0 to 6.7 ppm appears up to 2 signals at δH 6.40 (1H, d, J = 2.5 Hz) and 6.62 (1H, dd, J = 8.5 Hz; 2 Hz), which indicates the characteristics of the H-8 and H-6 protons in ring A. Furthermore, one proton signal appears at a shift of 7.72 ppm (1H, d, J = 8.5 Hz). The spectral patterns showing the proton matchmaking characteristics of the AB system were observed at δH 6.62 (1H, dd, J = 8.5; 2 Hz) and 7.72 (1H, d, J = 8.5 Hz) indicated the specificity for protons at H-6 and H-5. Protons H-6 and H-5 have ortho correlation with each other. In the range of 6.7 to 7.7 ppm there were 3 signals, namely at δH 6.86 (1H, dd, J = 8 Hz; 2.5 Hz), 6.92 (1H, td, J = 8 Hz; 2 Hz), and 7.07 (1H, d, J = 2.5 Hz).
The proton characteristics of the ABX system are shown in this shift. The three signals indicate the proton signal for ring B with each signal representing H-5 ‘, H-6′, and H-2’ and the three signals are ortho and meta correlated with each other. The H-3 proton on the flavone produced a single sharp signal at a shift of about δH 4.53 ppm. H-2 signal appear at a shift of approximately δH 4.9 ppm. This signal appears in pairs with the H-3 proton signal that appears at a shift of about δH 4.2 ppm.22 The spectrum of isolate 2 shows the flavonoid pattern of the dihydroflavonoid type where the signal appears at δH 4.98 (1H, d, J = 12 Hz) as H-2 and δH 4.53 (1H, d, J = 11.5 Hz) as H- 3. The results of the analysis on the 13C-NMR spectrum showed that isolate 2 had 15 carbon signals. The results of the DEPT 135o NMR analysis showed 8 signals of methine carbon (δC 74.0; 85.0; 103.1; 111.8; 115.8; 115.9; 120.9; 129.8 ppm) and there were 7 carbon signals quaternary (δC 113.1; 130; 1; 145.8; 146.6; 164.6; 165.8; 193.2 ppm). The 13C-NMR spectrum shows a signal at a shift below 100 ppm, namely at δC 85.0 and 74.0 ppm as a characteristic of saturated carbon sp3 which binds to electronegative atoms such as oxygen.23 The carbon signal at 193.2 ppm shift is characterized by carbonyl carbon, which has a shift range between 185-220 ppm.23 The 2D NMR COSY spectrum of 1H-1H correlation shows that there is a correlation between H-3 (δH 4.53 ppm) with H-2 (δH 5.00 ppm) and H-5 (δH 7.72 ppm) with H-6 (δH 6.62 ppm). This confirms that the basic structure of the isolate is a flavonoid with 2 protons in ring A and ring B, each of which is correlated. The results of the 2D NMR HMQC spectrum analysis showed that there were 8 correlations between the proton and the carbon signal. The correlation shows a direct bond between protons and carbon, namely the proton signal δH 4.53 (H-3); 5.00 (H-2); 6.40 (H-8); 6.62 (H-6); 6.86 (H-5′); 6.92 (H-6′); 7,07 (H-2′); 7.72 (H-5) ppm, respectively correlated with carbon at δC 74.0 (C-3); 85.0 (C-2); 103.6 (C-8); 111.8 (C-6); 115.8 (C-5′); 120.9 (C-6′); 115.9 (C-2′); and 129.8 (C-5) ppm. The important HMBC correlation of 2 was shown in Figure 3.
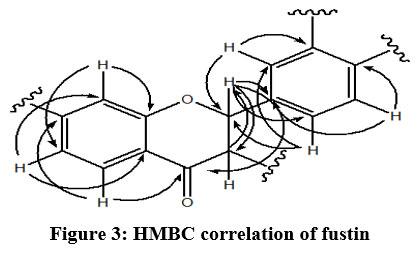 |
Figure 3: HMBC correlation of fustin |
The 1H-NMR spectrum of isolate 3 showed that there were 5 proton signals in the aromatic region of 6-8 ppm. The isolates are believed to be a flavonoid class compound as the data obtained are close to the reported values.24, 25 The proton signal δH 6.60 ppm was assumed to be H-6, ortho and meta coupling correlating with the proton signal δH 7.70 (H-5) and 6.37 ppm (H-8), respectively. The proton characterization of ABX is shown in the typical shear of ring A of the flavonoid framework for H-6, H-5 and H-8. Meanwhile, the proton signal δH 7.41 is assumed to be H-2’/ H-6′, which has an ortho coupling correlating with the proton signal δH 6.87 that has an ortho coupling value (H-3’/H-6′). The 13C-NMR and DEPT 135 analysis showed that there were 7 methine carbon signals (δC 74.0; 84.9; 103.7; 111.8; 115.9; 129.8 and δc 130.4 ppm) and 6 quaternary carbon signals (δC 113.1; 129.4; 158.9; 164.6; 165.9 and δc 193.3 ppm). In the spectrum, a signal appears at 193.3 ppm, which indicates the type of carbonyl carbon (C = O). The 13C-NMR spectrum shows that there are 10 carbon signals, which ranges from 100-167 ppm that are believed to be aromatic carbon. Furthermore, HMQC 2D spectrum shows a direct correlation between protons and carbon. The correlation signal appears up to 7 signals at δH 4.55 (H-3); 5.03 (H-2); 6.37 (H-8); 6.60 (H-6); 6.87 (3’/5′); 7.41 (2’/6′); and 7.70 (H-5) ppm with carbon at δC signal 73.9 (C-3), respectively; 84.9 (C-2); 103.7 (C-8); 111.8 (C-6); 115.9 (C-3’/5′); 130.4 (C-2’/6′); and 129.8 (C-5) ppm. 2D HMBC analysis was performed, and the structure of the isolate was believed to be a flavonoid. This is reinforced by the signal that appears at δC 5.04 ppm (C-2), which correlates with δC 73.9 (C-3); 193.3 (C-4); 129.4 (C-1′); 130.4 (C-2’/6′). This signal shows the correlation between the C and B rings of flavonoids. The important HMBC correlation of 3 was shown in Figure 4.
 |
Figure 4: HMBC correlation of garbanzol |
Based on the 1H-NMR spectrum of compound 4, there is CH3 (-OCH3), which is oxygenated at δH 3.75 ppm (3H, s). A typical aromatic signal appears at δH 7.07 (2H, s) with a symmetrical plane, hydroxy proton (-OH) appears at δH 8.19 (1H, s). Seven carbon signals that are a C = O signal at δC 167.9 ppm (indicating the presence of carbon ester), one signal indicates the presence of aromatic carbon (C-OH) at δC 145.2 ppm, at δC 137.9 ppm indicates aromatic carbon (C-OH), δC 120.9 contains aromatic carbon (C-C), δC 108.9 ppm contains aromatic carbon (C-H), at δC 51.1 indicates the presence of –O-CH3. These values are in agreement with reported values available in the literature.26
Anticancer Activity of Extracts and Compounds 1-4
The anticancer activity against MCF-7 and A549 was measured using the MTS assay method, while the anticancer activity of HCC-1954 and MDA-MB 231 cells was measured using the MTT assay method and the results of the anticancer activity test are shown on the Table 1 and the comparison of their IC50 values are shown in Figure 5.
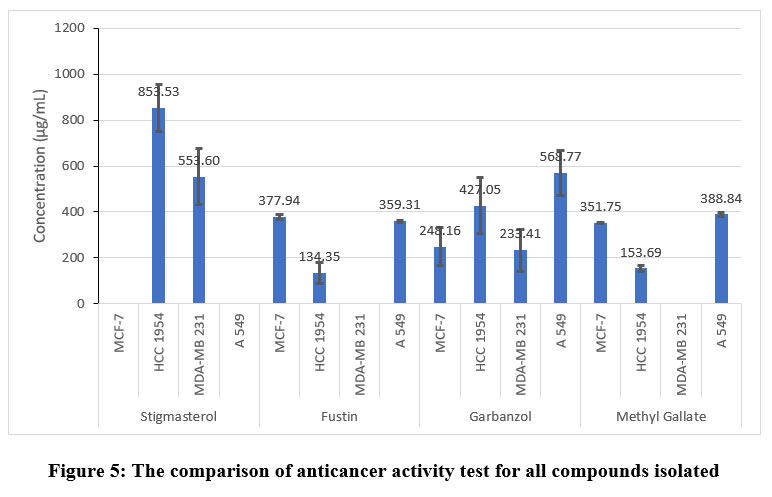 |
Figure 5: The comparison of anticancer activity test for all compounds isolated |
Table 1: Toxicity of extract and compound 1-4
| No | Sample | IC50 (µg/mL) | |||
| MCF-7 | A549 | HCC-1954 | MDA-MB-231 | ||
| 1 | Stigmasterol (1) | 1209.25 ± 47.92 | 5757.60 ± 4173.23 | 853.53 ± 103.87 | 553.60 ± 121.35 |
| 2 | Fustin (2) | 377.94 ± 9.17 | 359.31 ± 3.58 | 134.35 ± 44.62 | 5704.28 ± 289.08 |
| 3 | Garbanzole (3) | 248.16 ± 83.12 | 568.77 ± 98.13 | 427.05 ± 122.71 | 233.41 ± 91.57 |
| 4 | Methyl gallate (4) | 351.75 ± 3.80 | 388.84 ± 9.75 | 153.69 ± 12.54 | 311360.41 ± 262865.2 |
All compounds 1 – 4 were assayed for their anticancer property against MCF-7, A549, HCC-1954 and MDA-MB231 cell lines. All isolated compounds exhibited moderate anticancer activity against almost cell lines tested. Compounds 2 and 4 were more active on HCC-1954 cell with IC50 values of 134.35 ± 44.62 and 153.69 ± 12.54 µg/mL, respectively than other isolated compounds. It presumably that the anticancer activity increase with the absence or with the decreasing number of hydroxyl groups.27 Additionally, among all isolated compounds, compound 3 gave the most active in the anticancer activity test against MDA-MB-231 cell line with IC50 value of 233.41 ± 91.57 µg/mL. While compounds 2 and 3 demonstrated respectable anticancer activity against MCF-7, A549, and HCC-1954 cell lines with IC50 values ranging from 134.35 ± 44.62 to 568.77 ± 98.13 µg/mL. The compounds 2 and 3 are flavanones containing a chiral carbon on chroman-4-one ring unit which is flexible. According Woo et al., 28 the wide range of the flavanone bioactivity may be due to its chiral structure. In addition, the carbonyl group at C-4 on the flavan skeleton is very important for anticancer activity.27
However, the structure-activity relationship study is required to provide better understanding of their anticancer activity. The results of the anticancer test for the compounds isolated in this work are lower compared to other compounds reported by others both in the synthetic compounds such as organotin (IV) carboxylates29, 30 or other isolated compounds from other plants31, 32 although the cell lines used were different. However, the results reported in this work are believed still very important results in attempts to find new candidate for anticancer drugs.
Conclusions
Four compounds namely stigmasterol (1), fustin (2), garbanzol (3), and methyl gallate (4) were successfully isolated from the stem of B. macrophylla. These compounds were well characterized and the characterization data obtained were similar to the known compounds previous published. These compounds were tested for their anticancer activities against 4 cell lines. The result showed based on the IC50 values of compounds 2 and 4 were more active on HCC-1954 cell with IC50 values of 134.35 ± 44.62 and 153.69 ± 12.54 µg/mL, respectively. The compound 3 was the most active against MDA-MB-231 cell line with IC50 value of 233.41 ± 91.57 µg/mL.
Conflict of Interest
There is no conflict of interest.
Funding Sources
This research was funded by the Ministry of Research and Technology-National Agency for the Research and Innovation of the Republic of Indonesia through a higher education collaboration research scheme with the contract number 226/SP2H/LT/DRPM/2019 and No. 011/LT-AMAND/LP3M-UNMA/2020.
References
- Lim TK. Bouea macrophylla. In: Edible Medicinal and Non-Medicinal Plants. Springer. Dordrecht. 2012: 69-71.
CrossRef - Hanifa D, Susilawati Review artikel: Potensi tanaman gandaria (Bouea macrophylla Griff) sebagai obat herbal yang beraktivitas antioksidan. Farmaka. 2017; 15(3): 134-142. https://doi.org/10.24198/jf.v15i3.13559 (In Indonesian)
- Rajan NS, Bhat Antioxidant compounds and antioxidant activities in unripe and ripe kundang fruits (Bouea macrophylla Griffith). Fruits. 2016; 71(1): 41–47. https://doi.org/10.1051/fruits/2015046
CrosssRef - Thummajitsakul S, Silprasit K. Genetic differentiation and antioxidant activities of Bouea macrophylla Griffith in Nakhon Nayok province. Appl. Biol. Chem. 2017; 60(1): 41-47. https://doi.org/10.3839/jabc.2017.008
CrossRef - Rajan NS, Bhat R. Volatile constituents of unripe and ripe kundang fruits (Bouea macrophylla Griffith). J. Food. Prop. 2017: 20(8): 1751-1760. https://doi.org/10.1080/10942912.2016.1218892
CrossRef - Putri Aktivitas Antioksidan Ekstrak Metanol Kulit Buah Ramania (Bouea macrophylla Griff) dengan Metode DPPH. Proc. Mulawarman Pharm. Conf. 2018; 7: 28-31. https://doi.org/10.25026/mpc.v7i1.287 (In Indonesian).
CrossRef - Sukalingam K. Preliminary phytochemical analysis and in vitroantioxidant properties of Malaysian ‘Kundang’ (Bouea macrophylla Griffith). Trends Phytochem. Res. 2018: 7(1): 261-266.
- Kulsum S, Suresh A, Mehta A. Correlation of Antioxidant and Antiproliferative Activity of Amla and Ginger. Asian J Pharm Clin Res. 2018; 11(8): 263– https://doi.org/10.22159/ajpcr.2018.v11i8.26073
CrossRef - Andina L, Musfirah Total phenolic content of cortex and leaves of ramania (Bouea macrophylla Griffith) and antioxidant activity assay by DPPH method. Res. J. Pharm. Biol. Chem. Sci. 2017; 8(1): 134–140.
- Rudiana T, Fitriyanti F, Adawiah A. Aktivitas Antioksidan Dari Batang Gandaria (Bouea macrophylla Griff). Educhemia. 2018; 3(2): 194-204. https://doi.org/30870/educhemia.v3i2.3328. (in Indonesian)
CrossRef - Dechsupa N, Kantapan J, Tungjai M, Intorasoot S. Maprang “Bouea macrophyllaGriffith” seeds: proximate composition, HPLC fingerprint, and antioxidation, anticancer and antimicrobial properties of ethanolic seed extracts. 2019; 5(7): e02052. https://doi.org/10.1016/j.heliyon.2019.e02052.
CrossRef - Nguyen NH, Mguyen TT, Ma PC, Ta QTH, Doung TH, Vo VG. Potential Antimicrobial and Anticancer Activities of an Ethanol Extract from Bouea macrophylla. 2020; 25(8): 1-15. https://doi.org/10.3390/molecules25081996.
CrossRef - Kantapala J, Paksee S, Chawapun P, Sangthong P, Dechsupa N. Pentagalloyl Glucose- and Ethyl Gallate-Rich Extract from Maprang Seeds Induce Apoptosis in MCF-7 Breast Cancer Cells through Mitochondria-Metiated Pathway. Evid.-Based Compl. Alt. Med. 2020; 2020: 1-19. https://doi.org/10.1155/2020/5686029.
CrossRef - Rudiana T, Suryani N, Indriatmoko DD, Yusransyah Y, Amelia A, Noviany N, Hadi S. Characterization of antioxidative fraction of plant stem Bouea macrophylla IOP J. Phys.: Conf. Ser. 2019; 1341(7): 1-8. https://doi.org/10.1088/1742-6596/1341/7/072008.
CrossRef - Noviany N, Nurhidayat A, Hadi S, Suhartati T, Aziz M, Purwitasari N, Subarman I. Sesbagrandiflorain a and b: isolation of two new 2-arylbenzofurans from the stem bark of Sesbania grandiflora. Prod. Res. 2018; 32(21): 2558–2564. https://doi.org/10.1080/ 14786419.2018.1425858
CrossRef - Noviany N, Samadi A, Yuliyan N, Yuliyan N, Hadi S, Aziz M, Purwitasari N, Mohamad S, Ismail NN, Gable KP, Mahmud T. Structure characterization and biological activity of 2-arylbenzofurans from an Indonesian plant, Sesbania grandiflora (L.) Pers. Lett. 2020; 35(2020): 211–215. https://doi.org/10.1016/j.phytol.2019.12.008
CrossRef - Shekan P, Storeng R, Scudiero D, Monks A, McMahon J, Vistica D, Warren JT, Bokesch H, Kenney S, Boyd MR. New Coloricmetric Cytotoxicity assay for anticancer drug screening. J. Natl. Cancer. 1990; 82(13): 1107-1112. https://doi.org/ 1093/jnci/82.13.1107.
CrossRef - Ciapetti G, Cenni E, Pratelli L, Pizzoferrato A. In vitro evaluation of cell/biomaterial interaction by MTT assay. 1993; 14(5): 359-364. https://doi.org/ 10.1016/0142-9612(93)90055-7.
CrossRef - Forgo P, Kövér Gradient enhanced selective experiments in the 1H NMR chemical shift assignment of the skeleton and side-chain resonances of stigmasterol, a phytosterol derivative. Steroids. 2004; 69(1): 43-50. https://doi.org/10.1016/j.steroids.2003.09.012.
CrossRef - Darwati D, Nurlelasari N, Mayanti Isolasi Senyawa Steroid dari Akar Tumbuhan Asam Kandis (Garcinia cowa Roxb.ex DC ) Sebagai Obat Penurun Demam. J. Penel. Hasil Hutan. 2019; 37(1): 51–57. https://doi.org/10.20886/jphh.2019.37.1.51-57 (in Indonesian)
CrossRef - Shrestha S, Lee D, Park J, Cho JG, Lee DS, Li B, Kim YC, Jeon YJ, Yeon SW, Baek NI. Flavonoids from the Fruits of Nepalese Sumac (Rhus parviflora) Attenuate Glutamate-induced Neurotoxicity in HT22 Cells. Food Sci. Biotechnol.2013; 22: 895–902. https://doi.org/1007/s10068-013-0161-2.
CrossRef - Mabry TJ, Markham KR, Thomas The Determination and Interpretation of NMR Spectra of Flavonoids. In: The Systematic Identification of Flavonoids. Springer: Berlin, Heidelberg, Germany, 1970: 253-273. https://doi.org/10.1007/978-3-642-88458-0_8.
CrossRef - Pavia DL, Lampman GM, Kriz GS, Vyvyan JR. Introduction to Spectroscopy (4th ed.). Brooks/Cole: Belmont, Ca, USA, 2009.
- Hashida K, Tabata M, Kuroda K, Otsuka Y, Kubo S, Mekino R, Kubojima Y, Tonosaki M, Ohara S. Phenolic Extractives In The Trunk of Toxicodendron Vernicifluum: Chemical Characteristics, Contents and Radial Distribution. J Wood Sci.2014; 60: 160–168. https://doi.org/1007/s10086-013-1385-8.
CrossRef - Lee TH, Chiou JL, Lee CK, Kou YH. Separation and Determination of Chemical Constituents in the Roots of Rhus javanica var. roxburghiana. J. Chinese Chem. Soc. 2005; 52: 833-841. https://doi.org/10.1002/jccs.200500117.
CrossRef - Chiang E, Tan Y, Lim Potent Quorum Sensing Inhibition by Methyl Gallate Isolated From Leaves of Anacardium occidentale L. (Cashaw). Chiang Mai J. Sci. 2015; 42(3): 650-656.
- Fotso GW, Kamga J, Ngameni B, Uesugi S, Ohno M, Kimura KI, Momma H, Kwon E, Furuno H, Shiono Y, Inggrid SK, Yeboah SO, Ngadjui BT. Secondary metabolites with antiproliferative effects from Albizia glaberrima var glabrescens Oliv. (Mimosoideae). Prod. Res. 2017; 31(17): 1981-1987. https://doi.org/
CrossRef - Woo Y, Shin SY, Hyun J, Lee SD, Lee YH, Lim Y. Flavanones inhibit the clonogenicity of HCT116 cololectal cancer cells. J. Mol. Med. 2012; 29: 403-408. https://doi.org/ 10.3892/ijmm.2011.85
- Hadi S, Rilyanti Synthesis and In Vitro Anticancer Activity of Some Organotin(IV) Benzoate Compounds. Orient. J. Chem. 2010; 26(3): 775-779.
- Hadi S, Rilyanti M, Suharso. In Vitro Activity and Comparative Studies of Some Organotin(IV) Benzoate Derivatives Against Leukemia Cancer Cell: L-1210. Indo. J. Chem. 2012; 12(2): 172-177. https://doi.org/10.22146/ijc.21359
CrossRef - Suhartati T, Hernawan, Suwandi JF, Yandri Y, Hadi S. Isolation of Artonin E from the Root Bark of Artocarpus rigida, Synthesis of Artonin E Acetate and Evaluation of Anticancer Activity. Maced. J. Chem. Chem. Eng. 2018; 37(1): 35-42. https://doi.org/ 10.20450/mjcce.2017.1406
CrossRef - Suhartati T, Epriyanti E, Borisha I, Yandri Y, Suwandi JF, Qudus HI, Yuwono SD, Hadi S. In Vivo Antimalarial Test of Artocarpin and in vitro Antimalarial Test of Artonin M Isolated from Artocarpus. Rev. Chim. 2020; 71(5): 400-408. https://doi.org/ 10.37358/ RC.20.5.8150
CrossRef

