
Manuscript accepted on :18-11-2021
Published online on: 27-11-2021
Plagiarism Check: Yes
Reviewed by: Dr. Y. Chen

Second Review by: Dr. Cherry Bansal
Final Approval by: Dr. Fai Poon
Nithyaa. A. N 1*, Prem Kumar R1, Gokul .M2 and Geetha Aananthi C.3
1Biomedical Engineering . Department, Rajalakshmi Engineering College, Chennai, India, 602105
2Biomedical Engineering . Department, Kalasalingam Academy of Research and education, Krishnankoil, , 626128
3Biomedical Engineering . Department, Dhanalakshmi Srinivasan College of Engineering, Coimbatore, India, 641105
Corresponding Author E-mail: nithyaa.an@rajalakshmi.edu.in
DOI : https://dx.doi.org/10.13005/bpj/2328
Abstract
This paper aims to automate the detection of cancer using digital image processing techniques in MATLAB software. The analysis of white blood cells (WBC) is a powerful diagnostic tool for the prediction of Leukemia. The automatic detection of leukemia is a challenging task, which remains an unresolved problem in the medical imaging field. This Automation in Biological laboratories can be done by extracting the features of the blood film images taken from the digital microscopes and processed using MATLAB software. The aim of this approach is to discover the WBC cancer cells in an earlier stage and to reduce the discrepancies in diagnosis, by improving the system learning methodology. This paper presents the potent algorithm, which will eliminate the dubiety, in diagnosing the cancers with similar symptoms. This Algorithm concentrates on major WBC cancers, such as Acute Lymphocytic Leukemia, Acute Myeloid Leukemia, Chronic Lymphocytic Leukemia and Chronic Myeloid Leukemia. As they are life threatening diseases, rapid and precise differentiation is necessary in clinical settings. These cancers are categorized by segmentation and feature extraction, which will be further, classified using Random forest classification (RFC). RFC will classify the cancer using a decision tree learning method, which uses predictors at each node to make better decision.
Keywords
Automated Diagnosis; Decision Tree; Leukemia; MATLAB; RFC algorithm; WBC Cancer
Download this article as:| Copy the following to cite this article: Nithyaa A. N, Kumar R. P, Gokul M, Aananthi C. G. Matlab Based Potent Algorithm for Wbc Cancer Detection and Classification. Biomed Pharmacol J 2021;14(4). |
| Copy the following to cite this URL: Nithyaa A. N, Kumar R. P, Gokul M, Aananthi C. G. Matlab Based Potent Algorithm for Wbc Cancer Detection and Classification. Biomed Pharmacol J 2021;14(4). Available from: https://bit.ly/3xBIFTn |
Introduction
The Group of uncontrolled and abnormal cell growth leads to a stage called cancer. Blood cancer is predominant cancer, which will affect the normal blood cell growth and development in bone marrow. It leads to the absence of the blood cell’s function, at the place where it needs to fight pathogens. As per the statistics (2019) of Leukemia & Lymphoma Society, more than 1.7 lakh people are diagnosed with a blood cancer 1. In most of the high severity diseases, early diagnosis could reduce the high mortality rates. For blood cancer, the patient might need several blood tests and biopsies, before and after starting the cancer treatment. The current system used by the pathologists for identification of blood parameters is costly and the time involved in the generation of the reports is also comparatively more. The two major methods in exist are manual and automated blood tests, for diagnosing cancerous cell. In manual diagnosis, the time and manpower for diagnosis is high. In automated diagnosis, highly advanced equipment is used, so the cost could be a major drawback. Hence, there should be an automated process, where the blood cell images can be diagnosed in very little time with as minimum cost as possible. With the help of this new potent algorithm, the images can be diagnosed automatically, and the classification of the tumor will be followed efficiently with respect to the morphological features extracted from the cell image. While in the detection process, several methods used for the segmentation of red blood cells (RBC) from white blood cells (WBC), using a color space model with the help of MATLAB software 17, 20. Based on the training set, a random forest classier will finally identify and name the exact cancer type in the WBC.
Pathology of leukemia
Leukemia is the uncontrolled and abnormal group of white blood cells, produced in the bone marrow. Due to the morphological and functional malfunction in leukocytes, the protection against the foreign organisms is at risk. As per the national cancer institute report, more than sixty thousand people are diagnosed with leukemia in 2019. The two main categories of leukemia, such as acute and chronic leukemia 2, 12. Acute leukemia will develop faster and rapidly, In this case, treatment should be initiated, upon the diagnosis as soon as possible. The most common treatment methods are chemotherapy and stem cell therapy. Chronic leukemia progression is slow and the diagnosis could not be made until the symptoms are in the picture. The four most common types of leukemia are followed 3, 12.
Acute lymphocytic leukemia
In this type, the tumor will be grown in the immature WBC such as B or T lymphocytes. It will affect bone marrow in all parts as well as spread to lymph nodes, spleen, and liver. The children are mostly affected by this type of tumor.
Acute myeloid leukemia
This tumor will affect the blood components and develop quickly. The myeloid stem cells are mostly mature into abnormal myoblasts or WBC. The adult population is highly affected by this type of cancer.
Chronic lymphocytic leukemia
It will start growing in the B lymphocytes slowly and, they crow out the healthy cells. The symptom of this type of tumor is slow invisible appearance. Older adults are highly affected by this type of cancer.
Chronic myeloid leukemia
This is a rare type of tumor that will occur when a genetic change modifies the myeloid cells into immature tumor cells. Like acute myeloid, adults are more likely than children 13, 24.
The possibility of curing leukemia depends on the subtypes and the factors associated with its growth. Physicians often discover that a person has leukemia through, regular blood testing. So, this automated image diagnosis will assist them effectively to classify the type of leukemia 4, 8.
Flow of Automated Diagnosis
The automated diagnosis of images begins with the loading of the input image from the Digital microscope or any other digital source 5. After initializing the image into the algorithm, the following flow (Fig. 1) will be followed and executed to get the desired output 6, 9.
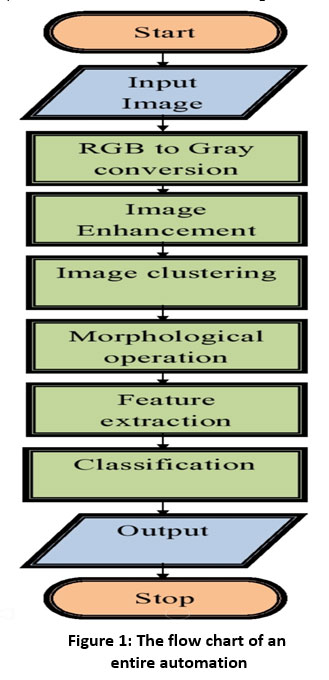 |
Figure 1: The flow chart of an entire automation |
RGB to Gray conversion
The input image, which is initialized in the algorithm, is shown in Fig. 2. To reduce the complexity, the image is converted from a 3D pixel value (R, G, B) to a 1D (gray) value. Some tasks do not fare better in 3D pixels, like edge detection 6, 10.
 |
Figure 2: Input image |
So, after resizing the input image into the matrix of [512,512], the grayscale operation is executed. The converted image is shown in Fig. 3.
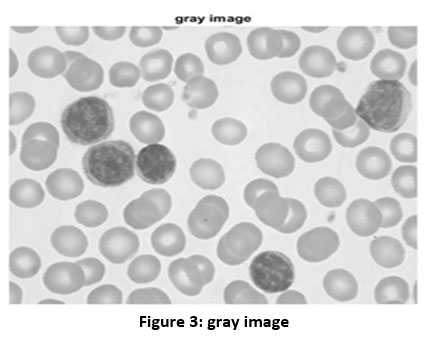 |
Figure 3: gray image |
Image Enhancement and clustering
By using the inbuilt function, the image is further enhanced for better visualization of WBC cells. The better visualization is occurring, because of the even distribution of pixels by the enhancement function. The enhanced image is shown in Fig. 4.
 |
Figure 4: Enhanced image |
Clustering is an effective and efficient way to segment an image. Because for performing the morphological operation, the segmented image will be easier than a normal image 14. So, the cluster technique will utilize the input image and group the similar data information into three clusters 19. The clustered image is shown in Fig. 5. The major WBC and rest components in the image are partitioned, due to the clustering technique 15,16.
 |
Figure 5: Clustered images |
Morphological Operation
The processing of cell’s shape, border and other small objects around the targeted cell was taken care by morphological operation. Initially, Dilation and erosion process was performed to convert the image into binary with the pixel value of 0 and 1. Then the value of 0 is assigned to WBC and 1 is assigned to rest components. After getting this image, complement function is used to swap the pixel values, to get the complement image, which is shown in Fig. 6.
 |
Figure 6: Binary and complement images |
To remove the other small unwanted objects in the image, the magnification value has been assigned.
magnification_value=2000;
II=round(magnification_value/15);
bw1 = bwareaopen(bw,II);
The above function is used to remove the unwanted objects in the image. To remove the unwanted boundaries of rest cell components in the image is executed by the following function.
bw2=imclearborder(bw1);
 |
Figure 7: Removal of small objects and unwanted boundaries |
After the removal of both small objects and unwanted boundaries (Fig. 7), the final output image for morphological operation (Fig. 8) is obtained by following the dilation function.
bw5=imdilate(bw2,strel(‘disk’,2));
 |
Figure 8: Dilated final image for morphological operation |
For easy counting of the WBC, the centroid is calculated for each cell, with the help of following bounding box function.
S=regionprops(bw5,’All’);
for i=1:length(S)
box_temp1 =S(i).BoundingBox;
a = box_temp1(1) + (box_temp1(3)/2);
b = box_temp1(2) + (box_temp1(4)/2);
Elong(i) = 1 -(box_temp1(3)/box_temp1(4));
center1_temp = S(i).Centroid;
viscircles([a,b],20);
Feature Extraction
Feature extraction is an important phase, where geometry texture, and color features are extracted from the input image, for classification. In the geometric features, the mean of area, diameter, radius, perimeter, eccentricity, solidity and elongation is calculated and the following matrix is formed 7, 11.
Geome_Fea = [Area dia rad perimeter ecc elg Elongation];
For texture feature, Grey level co-occurrence matrix (GLCM) features extraction is done. The absolute value of angular momentum, energy, entropy, homogeneity and correlation values are calculated using abs() function. The following matrix is the overall texture feature matrix 17.
Tex_Fea = [angular_momentum Energy Entropy Homogeneity Correlation];
Finally, color features are extracted by finding the mean of all three colors and the following matrix is formed 20.
Co_Fea = [R G B];
After, extracting all three features, the following final matrix is formed.
Feature = [Geome_Fea Tex_Fea Co_Fea];
Classifier and its Decision tree
Random Forest classifier is used to classify the WBC tumor with the help of decision trees [21]. Decision trees (Fig. 9) are the base for the RFC algorithm, which uses predictors at each node to make the best decision [22]. Basically, RFC behaves like an ensemble, with a large number of individual decision trees. Based on the fundamental RFC’s concept, WBC feature value matrix forms a large number of relatively uncorrelated trees and produces ensemble predictions.
 |
Figure 9: Decision tree |
The four major thresholds (for four tumor types) have been fixed, and the training has been given to the classifier [18], [23]. Each threshold is initialized in the variables (yfit4) and the loop if formed for final output. The following algorithm is the basic format for classification, where the values mentioned are derived from the previous training set.
md2 = generic_random_forests(C,lab,60,’classification’);
yfit4 = predict(md2,Feature);
if yfit4{1}==’1′
msgbox(‘Acute Lymphocytic Leukemia’);
elseif yfit4{1}==’2′
msgbox(‘Acute Myeloid Leukemia’);
elseif yfit4{1}==’3′
msgbox(‘Chronic Lymphocytic Leukemia’);
elseif yfit4{1}==’4′
msgbox(‘Chronic Myeloid Leukemia’);
end
Results and Discussion
The efficiency and the accuracy of the tumor classification are tested with the image of acute lymphocytic leukemia. The input image is taken from the digital microscope which is initialized in the algorithm. After initializing the JPEG format image, the complexity of the image is reduced and the pixels are evenly distributed to enhance the image quality. The similar information in the processed image is, further, clustered for effective segmentation. Then the morphological operation is performed to get the binary image. With the help of binary and complement image, we can clearly figure out WBC cells in the image. The boundaries and the unwanted objects around the WBC cells were fixed, and the numbers of WBC cells are calculated using the bounding box. Then, geometric, texture and color features are extracted in the matrix format for the classification process. After getting the features matrix, the threshold of the input image is verified with the training set 25. Then the decision tree is constructed, and the values of the predictors are initialized in the variable of yfit4. Finally,the predicator value at each node will match the values with a training set for final output. The decision tree and the cancer classification of input image (acute lymphocytic leukemia) are shown in fig. 10.
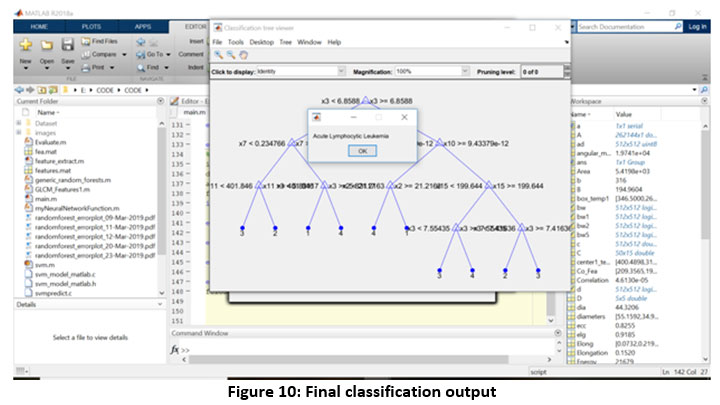 |
Figure 10: Final classification output |
Conclusion
The efficiency of this automated diagnosis will cause a huge impact in the Blood cell diagnosis domain. Due to its, adaptive threshold characteristics, the feature can be extracted for all kinds of images and the derivation of the thresholds can be done automatically using predictors. Comparing the time taken for manual blood tests, this automated and computerized diagnosis takes very less time, which is around 1 to 2 minutes. With all these captivating features, this software will be effective for Hematologists, by eliminating the difficulties in classifying cancer with similar symptoms. Training the classifier is the notable difficulty in this research work. It took huge time for an efficient classification. With the help of this strong training set and potent algorithm, we can extend this work to classify all other blood cancers by adding the features. In future work, the classification could be extended in the detection of all other types of blood cancer, irrespective of WBC. Even, it could be tested and developed with some other artificial neural network for some better efficiency, in order to reduce the time taken for training the classifier.
Acknowledgment
NIL
Conflict of interest
NIL
Funding sources
NIL
References
- Schlenk, R. F., Benner, A., Krauter, J., Büchner, T., Sauerland, C., Ehninger, G., … Heil, G. (2004). Individual Patient Data–Based Meta-Analysis of Patients Aged 16 to 60 Years With Core Binding Factor Acute Myeloid Leukemia: A Survey of the German Acute Myeloid Leukemia Intergroup. Journal of Clinical Oncology, 22(18), 3741–3750. doi:10.1200/jco.2004.03.0122.
CrossRef - Redaelli, A., Stephens, J. M., Laskin, B. L., Pashos, C. L., & Botteman, M. F. (2003). The burden and outcomes associated with four leukemias: AML, ALL, CLL and CML. Expert Review of Anticancer Therapy, 3(3), 311–329. doi:10.1586/14737140.3.3.3113.
CrossRef - Andreeff, M., Darzynkiewicz, Z., Sharpless, T., Clarkson, B., & Melamed, M. (1980). Discrimination of human leukemia subtypes by flow cytometric analysis of cellular DNA and RNA. Blood, 55(2), 282–293. doi:10.1182/blood.v55.2.282.2824.
CrossRef - Barua, K., & Chakrabarti, P. (2016). Detection and Classification for Blood Cancer – A Survey. International Journal of Computer Trends and Technology, 36(2), 65–70. doi:10.14445/22312803/ijctt-v36p1115.
CrossRef - H., A. (2011). Diagnosis of Acute Leukemia in Under-Resourced Laboratories. Acute Leukemia – The Scientist’s Perspective and Challenge. doi:10.5772/19800
CrossRef - Automatic Blood Cancer Detection Using Image Processing. (2018). International Journal of Recent Trends in Engineering and Research, 4(3), 204–210. doi:10.23883/ijrter.2018.4117.o3kbv
CrossRef - Nasir, A. S. A., Mashor, M. Y., & Rosline, H. (2011). Detection of Acute Leukaemia Cells Using Variety of Features and Neural Networks. 5th Kuala Lumpur International Conference on Biomedical Engineering 2011, 40–46. doi:10.1007/978-3-642-21729-6_163.
CrossRef - Abdul-Hamid, G. (2011). Classification of Acute Leukemia. Acute Leukemia – The Scientist’s Perspective and Challenge. doi:10.5772/198484.
CrossRef - Raje, C., & Rangole, J. (2014). Detection of Leukemia in microscopic images using image processing. 2014 International Conference on Communication and Signal Processing. doi:10.1109/iccsp.2014.69498405.
CrossRef - Begum, A. R. J., & Razak, T. A. (2017). Diagnosing Leukemia from Microscopic Images Using Image Analysis and Processing Techniques. 2017 World Congress on Computing and Communication Technologies (WCCCT). doi:10.1109/wccct.2016.63
CrossRef - Mohapatra, S., & Patra, D. (2010). Automated leukemia detection using hausdorff dimension in blood microscopic images. INTERACT-2010. doi:10.1109/interact.2010.57061962.
CrossRef - White Blood Cell. (n.d.). Encyclopedia of Cancer, 3200–3200. doi:10.1007/978-3-540-47648-1_62433.
CrossRef - Behm, F. G. (n.d.). Classification of Acute Leukemias. Treatment of Acute Leukemias, 43–58. doi:10.1385/1-59259-307-0:43 4.
CrossRef - Zhang, C., Xiao, X., Li, X., Chen, Y.-J., Zhen, W., Chang, J., … Liu, Z. (2014). White Blood Cell Segmentation by Color-Space-Based K-Means Clustering. Sensors, 14(9), 16128–16147. doi:10.3390/s1409161285.
CrossRef - Jiang, K., Liao, Q.-M., & Xiong, Y. (2005). A novel white blood cell segmentation scheme based on feature space clustering. Soft Computing, 10(1), 12–19. doi:10.1007/s00500-005-0458-z6.
CrossRef - Kan Jiang, Qing-Min Liao, & Sheng-Yang Dai. (n.d.). A novel white blood cell segmentation scheme using scale-space filtering and watershed clustering. Proceedings of the 2003 International Conference on Machine Learning and Cybernetics (IEEE Cat. No.03EX693). doi:10.1109/icmlc.2003.1260033
CrossRef - Mishra, Shailesh J., and A. P. Deshmukh. “Detection of leukemia using matlab.” International Journal of Advanced Research in Electronics and Communication Engineering 4.2 (2015): 394-398.
- Paswan, S., & Rathore, Y. K. (2017). Detection and Classification of Blood Cancer from Microscopic Cell Images Using SVM KNN and NN Classifier. Int. J. Adv. Res. Ideas Innov. Technol, 3, 315-324.2.
- Salem, N. M. (2014). Segmentation of white blood cells from microscopic images using K-means clustering. 2014 31st National Radio Science Conference (NRSC). doi:10.1109/nrsc.2014.6835098
CrossRef - LI, G., WANG, Z., & HOU, Z. (2010). Color image segmentation algorithm based on K-means clustering and region merging. Journal of Computer Applications, 30(2), 354–358. doi:10.3724/sp.j.1087.2010.00354
CrossRef - Ko, B. C., Gim, J. W., & Nam, J. Y. (2011). Cell image classification based on ensemble features and random forest. Electronics Letters, 47(11), 638. doi:10.1049/el.2011.08315.
CrossRef - Lan Guo, Yan Ma, Cukic, B., & Singh, H. (n.d.). Robust Prediction of Fault-Proneness by Random Forests. 15th International Symposium on Software Reliability Engineering. doi:10.1109/issre.2004.35
CrossRef - Wu, H.-S. (2000). Iterative thresholding for segmentation of cells from noisy images. Journal of Microscopy, 197(3), 296. doi:10.1046/j.1365-2818.2000.00653.x2.
CrossRef - Fuchs, O. (2011). Molecular Markers for Risk Stratification in Adult Acute Myeloid Leukemia with Normal Cytogenetics. Acute Leukemia – The Scientist’s Perspective and Challenge. doi:10.5772/198443.
CrossRef - S, D., Vignesh, R., & Revathy, R. (2019). A Distincitve Model to Classify Tumor Using Random Forest Classifier. 2019 Third International Conference on Inventive Systems and Control (ICISC). doi:10.1109/icisc44355.2019.9036473
CrossRef

