
Manuscript accepted on :09-08-2021
Published online on: 18-08-2021
Plagiarism Check: Yes
Reviewed by: Dr. Salman Ahmed Pharmacognosy

Second Review by: Dr. Sabu Thomas
Final Approval by: Dr Anton R Kiselev
Shrookmousa1, Ahmed Laymouna2 , NagwaAbd El Ghaffar Mohamed3, Mary Wadie4 and Mariana V Philip1.
1Department of internal medicine, faculty of medicine, Cairo University.
2Department of internal medicine department, rheumatology and immunology subdivision, faculty of medicine, Cairo University.
3Department of Clinical and Chemical Pathology, National Research Center, Egypt.
4Department of internal medicine, rheumatology and immunology subdivision, faculty of medicine, Cairo University.
Corresponding Author E-mail: ahmedlaymouna@gmail.com
DOI : https://dx.doi.org/10.13005/bpj/2246
Abstract
Background: Prediction ofthe risk of atherosclerosis in Egyptian patients with systemic lupus erythematosus (SLE) by measuring serum osteoprotegerin (OPG) level and correlation between OPG levels and SLE disease activity (assessed by Systemic Lupus Erythematosus Disease Activity Index [SLEDAI] score), is the aim of this study. Methods:A cross sectional study in which all patients were subjected to full medical history, full clinical examination (with special emphasis to SLE symptoms and signs e.g. photosensitivity, arthralgia, arthritis, malar rash, blood pressure and lower limb edema), laboratory investigations (CBC, random blood sugar [RBS], ESR, albumin/creatinine ratio, serum urea and creatinine, serum albumin, C3, total cholesterol, LDL-cholesterol, HDL-cholesterol, triglycerides, calcium and phosphorus). Electrocardiography (ECG) was done to calculate QTc interval using Bazett’s formula: QTC = QT / √ RR. Serum osteoprotegerin level was measured using ELISA technique. All participants were subjected to imaging in the form of: Carotid duplex: to assess intima-media thickness just two cm before carotid bifurcation, and to assess any plaques, if present. Also brachial artery flow mediated dilatation method: for detection of subclinical atherosclerosis. Results: There was a statistically significant negative correlation between serum levels of osteoprotegerin and brachial flow mediated dilation percentage (FMD %) values (P value > 0.001) which means a significant correlation between high serum OPG levels and subclinical atherosclerosis in SLE patients. There were statistically significant differences between SLE cases and controls in right and left carotid intima-media thickness (P value: 0.034 & 0.036 respectively), serum osteoprotegerin levels (P value: > 0.001) and QTc values (P value: 0.011) which were all statistically significantly higher in SLE patients, while brachial FMD % was statistically significantly lower in SLE patients than in controls (P value: > 0.001). Also, there was a statistically significant positive correlation between serum OPG levels and QTc interval (P value: 0.006). Conclusion: We have concluded that serum OPG level has a significant correlation with subclinical atherosclerosis and endothelial dysfunction, which was measured by CIMT and brachial mediated flow dilation method.
Keywords
Atherosclerosis; Carotid Intima-Media Thickness; Osteoprotegerin; SLE
Download this article as:| Copy the following to cite this article: Shrookmousa s, Laymouna A, Mohamed N. E. G, Wadie M, Philip M. V. Serum Osteoprotegerin Level as a Risk Factor for Atherosclerosis in Systemic Lupus Erythematosus Patients: A Cross Sectional Study. Biomed Pharmacol J 2021;14(3) |
| Copy the following to cite this URL: Shrookmousa s, Laymouna A, Mohamed N. E. G, Wadie M, Philip M. V. Serum Osteoprotegerin Level as a Risk Factor for Atherosclerosis in Systemic Lupus Erythematosus Patients: A Cross Sectional Study. Biomed Pharmacol J 2021;14(3). Available from: https://bit.ly/37Xu2O8 |
Introduction
Osteoprotegerin (OPG) is a tumor necrosis factor (TNF) receptor family member. It is a regulator of bone resorption (1). OPG is produced by a variety of organs and tissues, including the cardiovascular system (heart, arteries, veins), lung, kidneys, bone and immune tissues 1. The expression and production of OPG is complicated and is regulated by various cytokines and hormones 2. Osteoprotegerin is a soluble protein that seems to exert proatherogenic effect and serum OPG has been involved in the development of atherosclerosis in general population 3. High levels were considered as a novel marker for stroke in women 4.
Atherosclerosis prevalence is higher in patients with SLE than in the general population, becoming a leading cause of morbidity and mortality in these patients 5. Carotid ultrasound is animaging modality that allow non-invasive assessment of vascular anatomy and function 6. Use of this technique allows measurement of a variety of parameters including intima-media thickness (IMT), arterial diameter and presence of plaques 6. Corrected QT interval (QTc), measured by electrocardiogram, is prolonged in SLE patients and can predict subclinical atherosclerosis 7.
Methods
Design: A cross sectional study
Population of the study were divided into 2 separate groups
Group A
Forty five SLE patients: were selected from the outpatient clinic of rheumatology and immunology at Kasr Al-Ainy Hospital, Cairo university who are fulfilling the American College of Rheumatology (ACR) revised classification criteria (1982) for SLE 8.
All patients were subjected to
Full medical history
Thorough clinical examination (with special emphasis to SLE symptoms and signs e.g. photosensitivity, arthralgia, arthritis, malar rash, blood pressure and lower limb edema … etc.).
Laboratory investigations in the form of: CBC, RBS, ESR, albumin/creatinine ratio, serum urea and creatinine, serum albumin, C3, calcium and phosphorus. Total cholesterol, LDL-cholesterol, HDL-cholesterol, triglycerides after fasting for 12 hours.
Serum osteoprotegerin level was be measured using ELISA technique.
ECG using 12-lead-ECG to calculate QTc interval using Bazett’s formula: QTC= QT / √ RR 9.
All patients were subjected to imaging in the form of
Carotid duplex: was done using a linear probe 7.7 MHz using HDI 5000 machine to assess intima-media thickness of both common carotid arteries just two cm before carotid bifurcation by the same operator while the patient is lying flat in bed, and to assess the presence of any plaques, if present.
Brachial artery flow mediated dilatation method: by a linear probe, 7.5 MHz using a machine. The diameter of the brachial artery was measured while the patient is lying flat in bed and then it was re-measured after in response to an increase in blood flow during reactive hyperemia (induced by cuff inflation and then deflation). The cuff inflation period of 5 minutes is decided to produce adequate hyperemia to allow flow-mediated dilatation, but not to compromise patient comfort. The usual scanning period used in our laboratory is 30 seconds before and 90 seconds after the cuff deflation. Then, the percentage of dilation was calculated by doing this equation:
(BA diameter after deflation – BA diameter before deflation) X 100 / BA diameter before deflation
Group B
Forty five subjects, who are age and sex matched, as a control group.
They were subjected to: Serum OPG level was measured by ELISA technique. ECG for measuring QTc interval. Imaging in the form of carotid artery duplex and brachial artery flow mediated dilation method.
Data were coded and entered using the statistical package SPSS (Statistical Package for the Social Sciences) version 25. Data was summarized using mean, standard deviation, median, minimum and maximum in quantitative data and using frequency (count) and relative frequency (percentage) for categorical data. Comparisons between groups were done using unpaired test in normally distributed quantitative variables while non-parametric Mann-Whitney test was used for non-normally distributed quantitative variables 10,11. For comparing categorical data, Chi square (c2) test was performed. Exact test was used instead when the expected frequency is less than 5 11. Correlations between quantitative variables were done using Spearman correlation coefficient 12. P-values less than 0.05 were considered as statistically significant.
Results
In our study, 90 participants were involved, 45 systemic lupus erythematosus (SLE) cases and 45 controls. Forty three SLE cases (95.6%) were females, while only two cases (4.4%) were males (table). Disease duration mean was 4.2 years with standard deviation (SD): 3.99 (table). Four cases only (8.9%) were known to have hypertension. Twenty five SLE cases (55.6%) had lupus nephritis. Twenty one SLE cases (46.7%) have hypocalcaemia, while twenty four cases (53.3%) have normal calcium levels. Twenty four cases (53.3%) are dyslipidemic (table 1).
Table 1: Percentages of some parameters in SLE cases.
|
Contant |
Cases | ||
| Count |
% |
||
| Sex | M | 2 | 4.4% |
| F | 43 | 95.6% | |
| No | 39 | 86.7% | |
| HTN | Yes | 4 | 8.9% |
| No | 41 | 91.1% | |
| LN | Yes | 25 | 55.6% |
| No | 20 | 44.4% | |
| Calcium | Hypocalcemia | 21 | 46.7% |
| Normocalcemia | 24 | 53.3% | |
| Dyslipidemia | Yes | 24 | 53.3% |
| No | 21 | 46.7% | |
Regarding SLE cases included in our study, their age mean was 28.56 years (SD: 6.91), both right and left carotid intima-media thicknesses (CIMTs) mean values were 0.8 mm (SD: 0.02). Random blood sugar mean was 129.47 mg/dl (SD: 50.24). Regarding brachial flow mediated dilation percentage (FMD %), mean was 6.66 % (SD: 1.54). Mean steoprotegerin level was 10.98 (SD: 1.96) table 2.
Table 2: Statistical analysis of different parameters in SLE cases.
| | Cases | ||||
| Mean | Standard Deviation | Median | Minimum | Maximum | |
| Ageyrs | 28.56 | 6.91 | 26.00 | 19.00 | 49.00 |
| Dis. Dur. Yrs | 4.22 | 3.99 | 3.00 | .16 | 16.00 |
| SLEDAI | 4.69 | 1.95 | 5.00 | 1.00 | 9.00 |
| Rt C IMT (mm) | .08 | .02 | .08 | .04 | .12 |
| Lt C IMT (mm) | .08 | .02 | .08 | .05 | .14 |
| % FMD | 6.66 | 1.54 | 6.70 | 2.00 | 9.50 |
| OPG (pmol/L) | 10.98 | 1.96 | 10.30 | 7.40 | 14.90 |
| Hb (g/dl) | 10.70 | 2.08 | 11.30 | 6.10 | 14.40 |
| TLC (X109/L) | 6.74 | 3.40 | 6.00 | .80 | 17.80 |
| PLT (X109/L) | 259.23 | 109.66 | 249.00 | 20.00 | 642.00 |
| Urea (mg/dl) | 43.56 | 45.50 | 30.00 | 5.00 | 234.00 |
| Creatinine (mg/dl) | 1.04 | 1.19 | .70 | .08 | 6.20 |
| A/C ratio | .882 | 1.384 | .370 | .004 | 5.900 |
| Albumin (g/dl) | 3.49 | .72 | 3.70 | 1.50 | 4.50 |
| C3 (mg/dl) | 80.11 | 45.56 | 78.00 | 10.00 | 159.00 |
| ESR (mm-first hr) | 58.00 | 35.05 | 50.00 | 7.00 | 145.00 |
| Ca (mg/dl) | 8.76 | .85 | 9.00 | 5.50 | 9.90 |
| Ph (mg/dl) | 3.86 | .73 | 3.80 | 2.30 | 6.40 |
| RBS (mg/dl) | 129.47 | 50.24 | 114.00 | 68.00 | 326.00 |
| Chol-T (mg/dl) | 187.49 | 54.87 | 186.00 | 82.00 | 341.00 |
| LDL-Chol (mg/dl) | 99.37 | 48.50 | 91.00 | 20.00 | 251.00 |
| HDL-Chol (mg/dl) | 45.82 | 14.85 | 44.00 | 19.00 | 80.00 |
| TGs (mg/dl) | 159.60 | 85.33 | 120.00 | 44.00 | 375.00 |
| QTc (second) | .41 | .05 | .41 | .28 | .57 |
There were statistically significant differences between SLE cases and controls in (table 3) right and left carotid intima-media thickness, serum osteoprotegerin levels and QTc values which were all significantly higher in SLE patients (P values 0.034, 0.036, > 0.001, and 0.011 respectively), while flow mediated dilation percentage (FMD %) was statistically significantly lower in SLE patients than in controls (P value: > 0.001) table3.
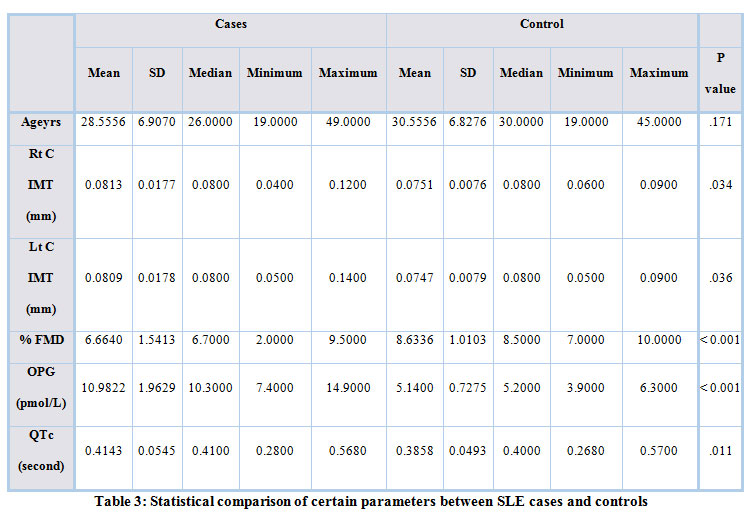 |
Table 3: Statistical comparison of certain parameters between SLE cases and controls. |
There was a statistically significant negative correlation between serum levels of osteoprotegerin and brachial flow mediated dilation percentage (FMD %) values which means a significant correlation between high serum OPG levels and subclinical atherosclerosis in SLE patients (P value: > 0.001) table 4. Also, there was a statistically significant positive correlation between serum OPG levels and QTc interval (P value: 0.006) table 4.
There was also a statistically significant positive correlation between serum OPG values and dyslipidemia (P value: 0.003 for total cholesterol, 0.002 for LDL-cholesterol), right and left carotid intima-media thicknesses were not statistically significantly affected by higher serumosteoprotegerin levels (table 4).
Table 4: Statistical correlation between OPG and other parameters in SLE cases and controls.
| OPG (pmol/L) | |||
| Correlation Coefficient | P value | N | |
| Ageyrs | -.152- | .154 | 90 |
| Dis. Dur. Yrs | .062 | .685 | 45 |
| SLEDAI | .251 | .097 | 45 |
| Rt C IMT (mm) | .115 | .282 | 90 |
| Lt C IMT (mm) | .082 | .445 | 90 |
| % FMD | -.585- | <0.001 | 90 |
| Hb (g/dl) | -.091- | .550 | 45 |
| TLC (X109/L) | .176 | .247 | 45 |
| PLT (X109/L) | .150 | .324 | 45 |
| Urea (mg/dl) | .409 | .005 | 45 |
| Creatinine (mg/dl) | .187 | .218 | 45 |
| A/C ratio | .254 | .092 | 45 |
| Albumin (g/dl) | .100 | .515 | 45 |
| C3 (mg/dl) | -.256- | .089 | 45 |
| ESR (mm-first hr) | .018 | .906 | 45 |
| Ca (mg/dl) | -.100- | .511 | 45 |
| Ph (mg/dl) | .180 | .237 | 45 |
| RBS (mg/dl) | .462 | .001 | 45 |
| Chol-T (mg/dl) | .433 | .003 | 45 |
| LDL-Chol (mg/dl) | .446 | .002 | 45 |
| HDL-Chol (mg/dl) | .303 | .043 | 45 |
| TGs (mg/dl) | .236 | .119 | 45 |
| QTc (second) | .286 | .006 | 90 |
We did a comparison between SLEDAI score of SLE patients and other parameters (table 5). It showed a significant positive correlation of SLEDAI score with ESR and a statistically significant negative correlation with C3 levels (P values: 0.002 and 0.005 respectively). There was also a statistically positive correlation between SLEDAI score and A/C ratio (P value: 0.00). There was no significant correlation between SLEDAI score and OPG, right and left CIMT, FMD % or QTc interval (P values: 0.328, 0.115, 0.722, 0.097, 0.930 respectively) table 5.
Table 5: Statistical correlation between SLEDAI score and other parameters in SLE cases.
| SLEDAI | |||
| Correlation Coefficient | P value | N | |
| Rt C IMT (mm) | 0.149 | 0.328 | 45 |
| Lt C IMT (mm) | 0.238 | 0.115 | 45 |
| Ageyrs | 0.039 | 0.799 | 45 |
| Dis. Dur. Yrs | -0.110- | 0.473 | 45 |
| % FMD | -0.055- | 0.722 | 45 |
| OPG (pmol/L) | 0.251 | 0.097 | 45 |
| Hb (g/dl) | -0.389- | 0.008 | 45 |
| TLC (X109/L) | -0.125- | 0.415 | 45 |
| PLT (X109/L) | -0.285- | 0.057 | 45 |
| Urea (mg/dl) | 0.284 | 0.059 | 45 |
| Creatinine (mg/dl) | 0.098 | 0.521 | 45 |
| A/C ratio | 0.662 | 0.000 | 45 |
| Albumin (g/dl) | -0.264- | 0.079 | 45 |
| C3 (mg/dl) | -0.411- | 0.005 | 45 |
| ESR (mm-first hr) | 0.458 | 0.002 | 45 |
| Ca (mg/dl) | -0.160- | 0.294 | 45 |
| Ph (mg/dl) | 0.231 | 0.127 | 45 |
| RBS (mg/dl) | -0.172- | 0.258 | 45 |
| Chol-T (mg/dl) | 0.060 | 0.694 | 45 |
| LDL-Chol (mg/dl) | -0.051- | 0.741 | 45 |
| HDL-Chol (mg/dl) | -0.032- | 0.835 | 45 |
| TGs (mg/dl) | 0.329 | 0.027 | 45 |
| QTc (second) | 0.013 | 0.930 | 45 |
We also compared right and left CIMT and all other parameters. It didn’t show any statistically significant correlation between CIMT and any other parameters studied including serum OPG, % FMD, SLEDAI score and QTc interval (table 6).
Table 6: Statistical comparison between different parameters in SLE cases and both right and left CIMT
| Right CIMT (mm) | Left CIMT (mm) | |||||
| Correlation Coefficient | P value | N | Correlation Coefficient | P value | N | |
| Ageyrs | 0.138 | 0.364 | 45 | 0.193 | 0.204 | 45 |
| Dis. Dur. Yrs | 0.018 | 0.907 | 45 | -0.032- | 0.833 | 45 |
| % FMD | 0.247 | 0.102 | 45 | 0.302 | 0.144 | 45 |
| OPG (pmol/L) | -0.137- | 0.371 | 45 | -0.124- | 0.417 | 45 |
| Hb (g/dl) | -0.065- | 0.669 | 45 | 0.038 | 0.804 | 45 |
| TLC (X109/L) | 0.081 | 0.595 | 45 | -0.048- | 0.756 | 45 |
| PLT (X109/L) | 0.211 | 0.165 | 45 | 0.008 | 0.958 | 45 |
| Urea (mg/dl) | -0.012- | 0.936 | 45 | -0.056- | 0.715 | 45 |
| Creatinine (mg/dl) | -0.087- | 0.569 | 45 | -0.006- | 0.971 | 45 |
| A/C ratio | 0.199 | 0.190 | 45 | 0.132 | 0.388 | 45 |
| Albumin (g/dl) | -0.148- | 0.331 | 45 | -0.100- | 0.513 | 45 |
| C3 (mg/dl) | -0.089- | 0.561 | 45 | -0.190- | 0.211 | 45 |
| ESR (mm-first hr) | 0.093 | 0.542 | 45 | 0.196 | 0.196 | 45 |
| Ca (mg/dl) | -0.138- | 0.365 | 45 | -0.138- | 0.367 | 45 |
| Ph (mg/dl) | -0.048- | 0.754 | 45 | 0.013 | 0.932 | 45 |
| RBS (mg/dl) | -0.126- | 0.408 | 45 | -0.156- | 0.306 | 45 |
| Chol-T (mg/dl) | 0.008 | 0.958 | 45 | 0.094 | 0.537 | 45 |
| LDL-Chol (mg/dl) | 0.018 | 0.909 | 45 | 0.062 | 0.688 | 45 |
| HDL-Chol (mg/dl) | 0.077 | 0.616 | 45 | 0.143 | 0.350 | 45 |
| TGs (mg/dl) | 0.226 | 0.136 | 45 | 0.290 | 0.053 | 45 |
| QTc (second) | -0.028- | 0.857 | 45 | -0.110- | 0.474 | 45 |
In our study, we made a comparison between SLE patients with and without lupus nephritis (LN). There was a statistically significant positive difference between LN and OPG levels (P value: > 0.001), while there is no statistically significant difference between the presence of LN and FMD% (P value: 0.610). Right and left CIMTs have also no significant correlation with the presence of LN. LDL-cholesterol has significant correlation with LN. QTc interval has no significant correlation with LN (table 7).
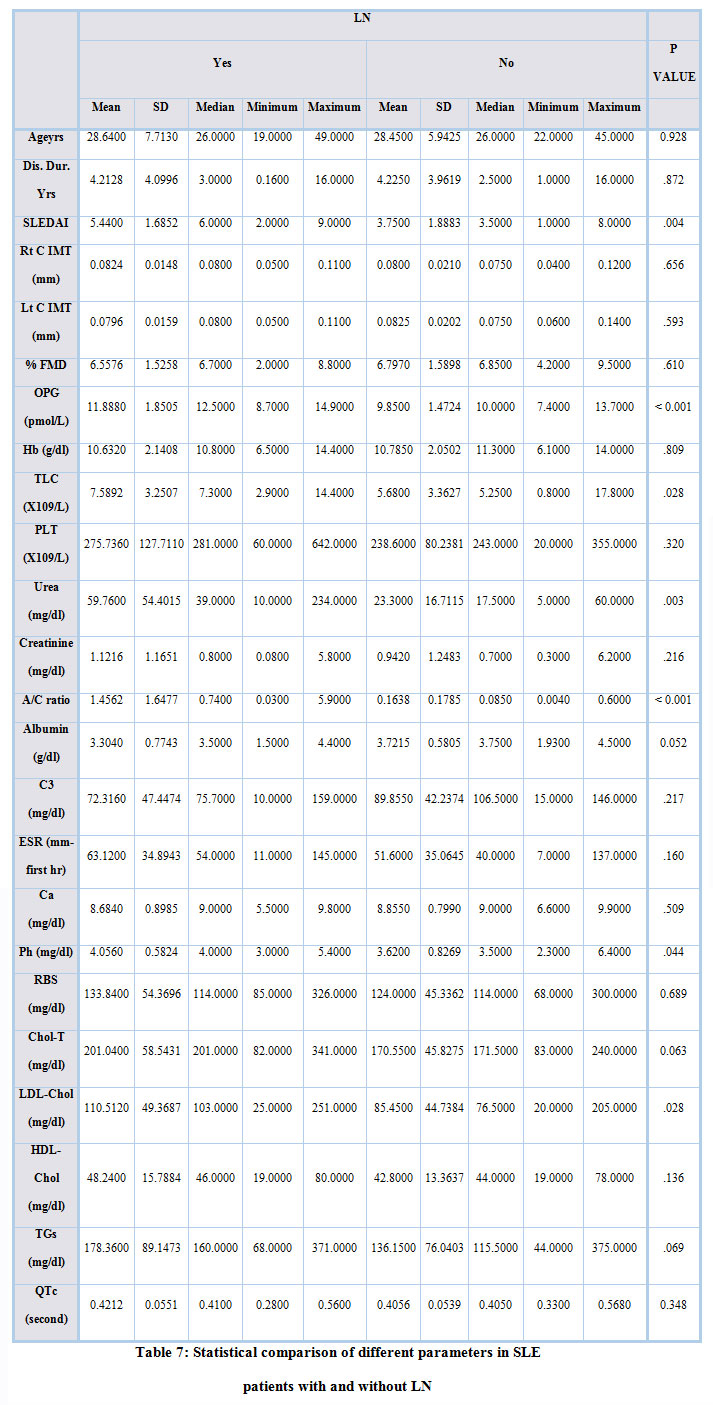 |
Table 7: Statistical comparison of different parameters in SLE patients with and without LN. |
Regarding dyslipidemia, serum OPG levels were significantly higher in dyslipidemic SLE patients. Right and left carotid IMTs are not different between both dyslipidemics and those patients with normal lipid profile values (table 8).
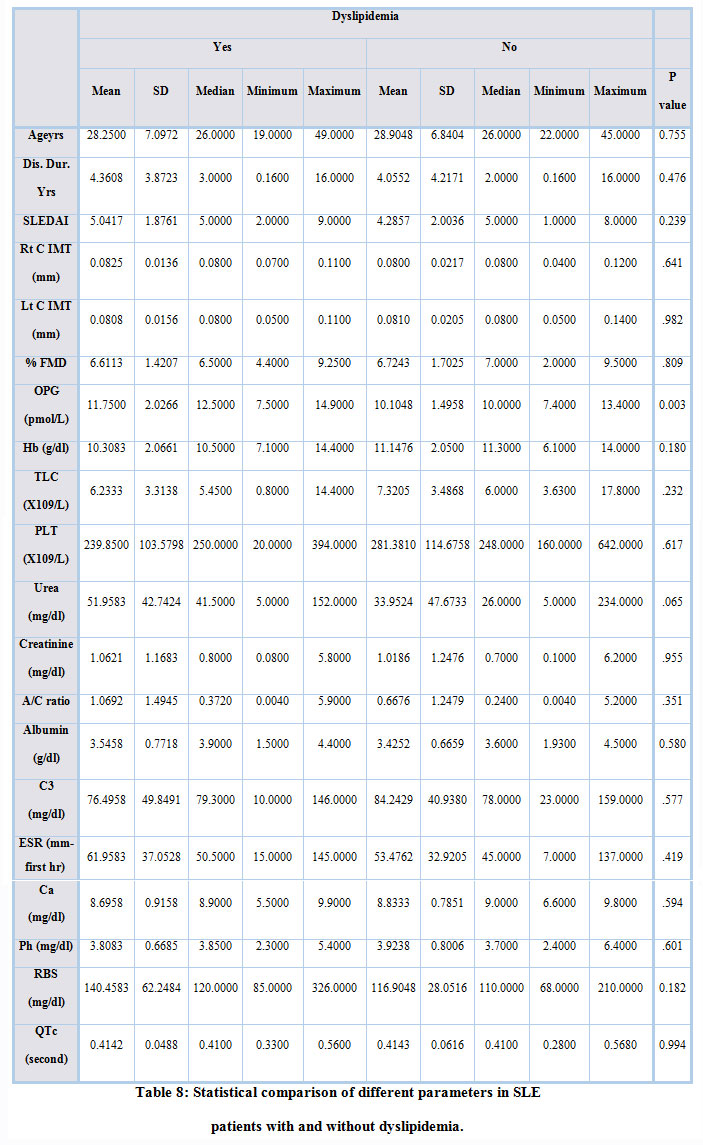 |
Table 8: Statistical comparison of different parameters in SLE patients with and without dyslipidemia. |
Discussion
Systemic lupus erythematosus (SLE) is a heterogeneous autoimmune disease that has a wide range of clinical and serological manifestations that can affect any organ in the body 13.
Osteoprotegerin (OPG) is a member of the tumor necrosis factor (TNF) receptor family 14. It has been identified as a regulator of bone resorption (14). OPG is produced by a variety of organs and tissues, including the cardiovascular system (heart, arteries, and veins), lung, kidney, immune tissues, and bone 14. The expression and production of OPG is complicated and is regulated by various hormones and cytokines 15.
Elevated serum OPG level has been associated with the progression of vascular calcification 16.High OPG levels were not only associated with overall cardiovascular mortality but were also a novel marker for stroke in women 17. In our study, we found that OPG was statistically significantly higher in SLE patients than in controls. This is in line with Park et al., 201418 who described a statistically significantly higher levels of OPG in SLE patients than controls. Also Kwork et al., 2009 19 concluded that OPG was statistically significantly higher in SLE patients than in control subjects. By contrast, Carmona-Fernandes et al., 2011 20 reported reduced serum OPG levels in SLE patients than in controls. This difference may be related to different ethnicities.
A prolonged QT interval on the electrocardiogram (ECG) is an easily measurable, reproducible parameter that has been linked with early-onset atherosclerosis in the general population and some subpopulations with high cardiovascular risk 21. SLE patients also appear to have a more prolonged QT interval, although clinical relevance of this has not been studied 22.
In our study, corrected QT interval (QTc) was statistically significantly prolonged in SLE cases than in control subjects. This was in line with Cardoso et al., 2005 22 who concluded that QTc interval is statistically significantly higher in SLE patients than in controls. Riveral-Lopez et al., 2016(7) found a statistically significant prolongation of QTc in SLE patients. This denotes that patients with SLE had higher incidence to develop early and premature atherosclerosis than age- and sex-matched control group and this highlights the importance of QT prolongation in SLE patients and that SLE patients should be cautious when they use drugs that cause QT prolongation.
The prevalence of atherosclerosis is higher in patients with SLE than in the general population, becoming a leading cause of morbidity and mortality in these patients 23. Carotid ultrasound is one of the several imaging modalities that allow non- invasive assessment of vascular anatomy and function 24. Use of this technique allows measurement of a variety of parameters including IMT and presence of plaques 24. CIMT and presence of plaques have been shown to predict cardiovascular events in multiple large studies 25.
In this study, we assessed subclinical atherosclerosis by measuring CIMT and we concluded that CIMT is statistically significantly higher in SLE patients than in controls, in spite of normal mean level of CIMT it is still higher than controls who are age- and sex-matched. This was in a line with a systematic review by Wu et al., 2016 26 who concluded that CIMT was statistically significantly higher in SLE patients than in controls. Roman et al., 2003 27, found that ultrasonographically demonstrated carotid artery plaques were present in 37 percent among 197 patients with SLE, but were present in only 15 percent of controls.
It has been noted that the carotid plaque prevalence increased from 31 percent at baseline to 40 percent at follow-up of 217 patients with SLE (disease duration mean: 10.5 years with SD 7.5 years) followed for an average of four years in a longitudinal study 28. Our finding, together with prolongation of QTc interval confirm our hypothesis of premature atherosclerosis in SLE patients.
Flow- and nitrate-mediated vasodilation (endothelial dependent dilation) was measured to describe endothelial dysfunction in SLE patients when Lima et al., 2002 29 found a statistically significant lower values of flow mediated dilation (FMD) % in SLE patients.
In our study, we found that FMD % was significantly reduced in SLE patients compared to controls.
El-Magadmi et al., 2004 30 showed similar results of FMD % being significantly lower in SLE patients than in controls. Also, this was in a line with Kiss et al., 2006 31 who concluded significantly lower values of FMD % in SLE patients than in controls. Rivera-Lopez, 20167 has found a statistically significant relation between SLE and subclinical atherosclerosis but using pulse wave velocity, another method to detect subclinical atherosclerosis.
The presence of prolonged QT interval, higher CIMT and lower brachial FMD in SLE patients compared to control subjects in this study confirm the presence of subclinical atherosclerosis in SLE patients, and endothelial dysfunction in those patients confirm the idea of considering SLE as a major risk factor for atherosclerosis and early cardiovascular morbidity.
OPG may mediate important and complex links between the bone and vascular systems 32. Thus, this molecule may play a central role in regulating the development of vascular calcification coincident with declines in bone mineralization with osteoporosis 33.
In our study, we found that there is a significant correlation between high serum OPG level and subclinical atherosclerosis in SLE patients as it is inversely correlated with brachial flow mediated dilation.
This was in consistent with De Ciriza et al., 2014 34 who found a significant association between serum OPG level and carotid intima media thickness. Also Vik et al., 2010 35 found that Serum OPG was a significant predictor for CIMT in crude analysis and after adjustment for cardiovascular risk factors. In 2011, Vik et al.36 performed a population based study with 12 years of follow up that found that serum OPG was significantly associated with incident myocardial infarction, ischemic stroke and total mortality independent of traditional cardiovascular risk factors and that serum OPG acts as a specific predictor for atherothrombotic cardiovascular diseases. All these studies were in contrast to our study as OPG didn’t statistically correlated to CIMT and this may be due to normal mean CIMT in our patients while in their study this wasn’t the case as mean values of right and left CIMT in our study were both 0.8 mm with SD: 0.2. This may be due to a relatively shorter disease duration in our study (mean 4.2 with SD: 3.99), while in a s study of Thompson et al., 2008(28) disease duration was higher (mean 10 years with SD 7.5). Also we have suggested that changes in brachial FMD may precede changes in CIMT and it may be considered as an early indicator of subclinical atherosclerosis in SLE patients before CIMT changes and that OPG may play a role in the endothelial dysfunction more than it did in arterial atherosclerosis and we hypothesize that the starting process of premature atherosclerosis in SLE is endothelial dysfunction, and this may explain why dyslipidemia didn’t correlate with FMD and CIMT, however the absence of correlation between CIMT, FMD, and SLEDAI, C3 and ESR denotes that premature atherosclerosis is not totally preventable through disease activity control and raise the possibility of different underlying mechanisms in our study from which we highlighted elevated OPG serum levels, however triglycerides only is related to disease activity. So, controlling disease may minimally contribute to ameliorating premature atherosclerosis.
Park et al., 201418 also had found a statistically significant association between OPG and carotid intima media thickness even after adjustment for age, hypertension, LDL and creatinine, OPG levels (1086 versus 517 pg/ml, p < 0.001) and CIMT (0.63 versus 0.45 mm, p < 0.001) compared with control subjects. Similarly, Kiechl et al., 2004 37 also found a statistically significant association between OPG and carotid atherosclerosis, progressive atherosclerosis and cardiovascular risk. Also, in our study, OPG correlates with QTc interval which also may be an earlier sign of atherosclerosis together with low FMD % before CIMT changes.
OPG has been implicated diabetes mellitus, myocardial ischemia and left ventricular dysfunction 38.
In our study, there was a statistically significant positive correlation between OPG and blood sugar and this may raise the possibility of secondary diabetes mellitus (DM) in SLE patients other than steroid induced DM, so we suggest follow up of blood sugar in SLE patients even if they are off steroids.
This was in a line with Jono et al., 2002 40 andSchoppet et al., 200340 who found that OPG was significantly higher in diabetics and those with poor glycemic control.
Musialik et al., 2017 41 also found a statistically significant correlation between OPG and body mass index independent on age, systolic blood pressure or glucose. This was also in line with Bernardi et al., 201442 who concluded that OPG, after adjustment of other risk factors of metabolic syndrome, is still significantly associated with metabolic syndrome.
More recent evidence has linked OPG to kidney injury 43. Circulating OPG levels increase as estimated glomerular filtration rate (eGFR) decreases in diabetic and non-diabetic CKD patients 44,45.
In our study, we found that OPG was significantly higher in SLE patients with lupus nephritis rather than in SLE patients without lupus nephritis.
Also, we found that OPG was statistically significantly higher in lupus patients with high urea than in those with normal urea. This was in a line with Mikami et al., 2008 (46) who found a significantly positive correlation between serum OPG and CKD. This also was supported with Jiang et al., 2011(47) who concluded also a significantly positive correlation between OPG and renal failure. Other studies also have similar results (48,49). So we concluded that OPG is higher in lupus nephritis together with increased LDL in LN compared to those without LN in spite of the absence of statistically significant difference in CIMT between the 2 groups raising the possibility that OPG may be one of the etiologies of dyslipidemia in SLE patients and that OPG may be used as an early marker impaired renal chemistry in SLE patients.
In our study, the presence of increased CIMT in SLE patients compared to controls and being not correlated to dyslipidemia raising the probability of underlying etiology to premature atherosclerosis in SLE patients rather than elevated lipid profile and the presence of negative correlation between OPG and brachial FMD together with the positive correlation of OPG and with cholesterol and LDL may highlight that OPG may be one of the underlying causes of secondary dyslipidemia in SLE patients and one of the main factors in premature atherosclerosis in SLE patients, also this was confirmed by its positive correlation with QTc interval. Also, in our study, the presence of prolonged QT interval in the absence of hypocalcemia highlights an underlying pathology of the conduction system in SLE patients.
The absence of correlation between of SLEDAI and OPG and also that there is no statistically significant differences in OPG in both dyslipidemic and non-dyslipidemic SLE patients may highlight that dyslipidemia in SLE isn’t related to disease activity and should be followed regularly and monitored to prevent an important contributor to premature atherosclerosis in SLE patient if the patient is in remission, but also the positive correlation SLEDAI and triglycerides raise the role of disease activity in dyslipidemia and that controlling disease activity may guard against premature atherosclerosis and secondary dyslipidem
Conclusion
Serum OPG level has a significant correlation with subclinical atherosclerosis and endothelial dysfunction, which was measured by CIMT and brachial mediated flow dilation method.
Acknowledgement
Not applicable
Conflict of interests
Not applicable
Funding source
No funding received.
References
- Simonet WS, Lacey DL, Dunstan CR. Osteoprotegerin: A novel secreted protein involved in the regulation of bone density. Cell, 89: 309–319. (1997).
CrossRef - Hofbauer LC, Khosla S, Dunstan CR. The roles of osteoprotegerin and osteoprotegerin ligand in the paracrine regulation of bone resorption. J Bone Miner Res, 15: 2–12. (2000).
CrossRef - Bernardi S., Fabris B., Thomas M., et al. Osteoprotegerin increases in metabolic syndrome and promotes adipose tissue proinflammatory changes.Molecular and Cellular Endocrinology,394(1-2):13–20. (2014).
CrossRef - Browner WS, Lui LY, Cummings SR. Associations of serum osteoprotegrin levels with diabetes, stroke, bone density, fractures and mortality in elderly women. J ClinEndocrinolMetab, 86: 631–637. (2001).
CrossRef - Thomas G, Mancini J, JourdeChiche N, Sarlon G, Amoura Z, Harlé JR, et al. Mortality associated with systemic lupus erythematosus in France assessed by multiple cause-of-death analysis. Arthritis Rheumatol,66:2503–2511.(2014).
CrossRef - Kim, G. H., &Youn, H. J. Is carotid artery ultrasound still useful method for evaluation of atherosclerosis?. Korean circulation journal, 47(1), 1-8.(2017).
CrossRef - Rivera-López R, Jiménez-Jáimez J, Sabio JM, Zamora-Pasadas M, Vargas-Hitos JA, Martínez-Bordonado J, et al. Relationship between QT Interval Length and Arterial Stiffness in Systemic Lupus Erythematosus (SLE): A Cross-Sectional Case-Control Study. PLoS One, 11(4). (2016).
CrossRef - Tan, E. M., Cohen, A. S., Fries, J. F., et al. The 1982 revised criteria for the classification of systemic lupus erythematosus. Arthritis & Rheumatism: Official Journal of the American College of Rheumatology,25(11): 1271-1277.(1982).
CrossRef - Bazett, H. C. An analysis of the time relations of electrocardiograms. Heart,7: 353-370.(1920).
- Chan YH. Biostatistics102: Quantitative Data – Parametric & Non-parametric Tests. Singapore Medical Journal. 44(8): 391-396. (2003)a.
- Chan YH. Biostatistics 103: Qualitative Data –Tests of Independence. Singapore Medical Journal,44(10): 498-503. (2003)b.
- Chan YH,. Biostatistics 104: Correlational Analysis. Singapore Medical Journal,44(12): 614-619. (2003)c.
- Mckinley, P. S., Ouellette, S. C., & Winkel, G. H. The contributions of disease activity, sleep patterns, and depression to fatigue in systemic lupus erythematosus. Arthritis & Rheumatism,38(6): 826-834.(1995).
CrossRef - Zauli, G., Corallini, F., Bossi, F., et al. Osteoprotegerin increases leukocyte adhesion to endothelial cells both in vitro and in vivo. Blood,110(2): 536-543.(2007).
CrossRef - Hofbauer, L. C., Khosla, S., Dunstan, C. R., et al. The roles of osteoprotegerin and osteoprotegerin ligand in the paracrine regulation of bone resorption. Journal of Bone and Mineral Research,15(1): 2-12. (2000).
CrossRef - Semb, A. G., Ueland, T., Aukrust, P., et al. Osteoprotegerin and soluble receptor activator of nuclear factor-κB ligand and risk for coronary events: a nested case–control approach in the Prospective EPIC-Norfolk Population Study 1993–2003. Arteriosclerosis, thrombosis, and vascular biology,29(6): 975-980.(2009).
CrossRef - Browner, W. S., Lui, L. Y., & Cummings, S. R. Associations of serum osteoprotegerin levels with diabetes, stroke, bone density, fractures, and mortality in elderly women. The Journal of Clinical Endocrinology & Metabolism,86(2): 631-637.(2001).
CrossRef - Park, Y. J., Shin, Y. J., Kim, W. U., et al. Prediction of subclinical atherosclerosis by serum osteoprotegerin in premenopausal women with systemic lupus erythematous: correlation of osteoprotegerin with monocyte chemotactic protein-1. Lupus,23(3): 236-244.(2014).
CrossRef - Kwok, S. K., Shin, Y. J., Kim, H. J., et al. Circulating osteoprotegerin levels are elevated and correlated with antiphospholipid antibodies in patients with systemic lupus erythematosus. Lupus,18(2): 133-138. (2009).
CrossRef - Carmona-Fernandes, D., Santos, M. J.,Perpétuo, I. P., et al. Soluble receptor activator of nuclear factor κB ligand/osteoprotegerin ratio is increased in systemic lupus erythematosus patients. Arthritis research & therapy, 13(5): R175. (2011 ).
CrossRef - Soliman, E. Z., Howard, G., Cushman, M., et al. Prolongation of QTc and risk of stroke: The REGARDS (REasons for Geographic and Racial Differences in Stroke) study. Journal of the American College of Cardiology,59(16): 1460-1467. (2012).
CrossRef - Cardoso, C. R., Sales, M. A., Papi, J. A., et al. QT-interval parameters are increased in systemic lupus erythematosus patients. Lupus,14(10): 846-852. (2005).
CrossRef - Thomas, G., Mancini, J., Jourde‐Chiche, N., et al. Mortality associated with systemic lupus erythematosus in France assessed by multiple‐cause‐of‐death analysis. Arthritis & rheumatology,66(9): 2503-2511. (2014).
CrossRef - Kim, G. H., &Youn, H. J. Is Carotid Artery Ultrasound Still Useful Method for Evaluation of Atherosclerosis?. Korean circulation journal,47(1): 1-8. (2017).
CrossRef - Polak, J. F., Pencina, M. J., Pencina, K. M., et al. Carotid-wall intima–media thickness and cardiovascular events. New England Journal of Medicine, 365(3): 213-221. (2011).
CrossRef - Wu, G. C., Liu, H. R., Leng, R. X., et al. Subclinical atherosclerosis in patients with systemic lupus erythematosus: a systemic review and meta-analysis. Autoimmunity reviews,15(1): 22-37. (2016 ).
CrossRef - Roman, M. J., Shanker, B.-A., Davis, A., et al. Prevalence and correlates of accelerated atherosclerosis in systemic lupus erythematosus. New England Journal of Medicine,349(25): 2399-2406. (2003).
CrossRef - Thompson, T., Sutton‐Tyrrell, K., Wildman, R. P., et al. Progression of carotid intima‐media thickness and plaque in women with systemic lupus erythematosus. Arthritis and rheumatism,58(3): 835-842. (2008).
CrossRef - Lima, D. S., Sato, E. I., Lima, V. C., et al. Brachial endothelial function is impaired in patients with systemic lupus erythematosus. The Journal of Rheumatology,29(2): 292-297.(2002).
- El-Magadmi, M., Bodill, H., Ahmad, Y., et al. Systemic lupus erythematosus: an independent risk factor for endothelial dysfunction in women. Circulation,110(4): 399-404. (2004).
CrossRef - Kiss, E., Soltesz, P., Der, H., et al. Reduced flow-mediated vasodilation as a marker for cardiovascular complications in lupus patients. Journal of autoimmunity,27(4): 211-217. (2006).
CrossRef - D’Amelio, P., Isaia, G., & Isaia, G. C. The osteoprotegerin/RANK/RANKL system: a bone key to vascular disease. Journal of endocrinological investigation,32(4): 6-9. (2009).
- Papadopouli, A. E., Klonaris, C. N., & Theocharis, S. E. Role of OPG/RANKL/RANK axis on the vasculature. Histology and histopathology,23(4): 497-506.(2008).
- De Ciriza, C. P., Moreno, M., Restituto, P., et al. Circulating osteoprotegerin is increased in the metabolic syndrome and associates with subclinical atherosclerosis and coronary arterial calcification. Clinical biochemistry, 47(18): 272-278. (2014).
CrossRef - Vik, A., Mathiesen, E. B., Brox, J., et al. Relation between serum osteoprotegerin and carotid intima media thickness in a general population–the Tromsø Study. Journal of Thrombosis and Haemostasis,8(10): 2133-2139.(2010).
CrossRef - Vik, A., Mathiesen, E. B., Brox, J., et al. Serum osteoprotegerin is a predictor for incident cardiovascular disease and mortality in a general population: the Tromsø Study. Journal of Thrombosis and Haemostasis,9(4): 638-644.(2011).
CrossRef - Kiechl, S., Schett, G., Wenning, G., et al. Osteoprotegerin is a risk factor for progressive atherosclerosis and cardiovascular disease. Circulation, 109(18): 2175-2180.(2004).
CrossRef - Venuraju, S. M., Yerramasu, A., Corder, R., et al. Osteoprotegerin as a predictor of coronary artery disease and cardiovascular mortality and morbidity. Journal of the American College of Cardiology,55(19): 2049-2061. (2010).
CrossRef - Jono, S., Ikari, Y., Shioi, A., et al. Serum osteoprotegerin levels are associated with the presence and severity of coronary artery disease. Circulation, 106(10): 1192-1194. (2002).
CrossRef - Schoppet, M., Sattler, A. M., Schaefer, J. R., et al. Increased osteoprotegerin serum levels in men with coronary artery disease. The Journal of Clinical Endocrinolog& Metabolism,88(3): 1024-1028. (2003).
CrossRef - Musialik, K., Szulińska, M., Hen, K., et al. The relation between osteoprotegerin, inflammatory processes, and atherosclerosis in patients with metabolic syndrome. European review for medical and pharmacological sciences,21(19): 4379-4385. (2017).
- Bernardi, S., Fabris, B., Thomas, M., et al. Osteoprotegerin increases in metabolic syndrome and promotes adipose tissue proinflammatory changes. Molecular and cellular endocrinology,394(1-2): 13-20. (2014).
CrossRef - Montañez-Barragán, A., Gómez-Barrera, I., Sanchez-Niño, M. D., et al. Osteoprotegerin and kidney disease. Journal of nephrology,27(6): 607-617.(2014).
CrossRef - Morena, M., Jaussent, I., Halkovich, A., et al. Bone biomarkers help grading severity of coronary calcifications in non dialysis chronic kidney disease patients. PloS One,7(5): e36175. (2012).
CrossRef - Ford, M. L., Smith, E. R., Tomlinson, L. A., et al. FGF-23 and osteoprotegerin are independently associated with myocardial damage in chronic kidney disease stages 3 and 4. Another link between chronic kidney disease–mineral bone disorder and the heart. Nephrology Dialysis Transplantation, 27(2): 727-733. (2011).
CrossRef - Mikami, S., Hamano, T., Fujii, N., et al. Serum osteoprotegerin as a screening tool for coronary artery calcification score in diabetic pre-dialysis patients. Hypertension Research,31(6): 1163. (2008).
CrossRef - JIANG, J. Q., Lin, S., XU, P. C., ZHENG, Z. F., & JIA, J. Y. Serum osteoprotegerin measurement for early diagnosis of chronic kidney disease‐mineral and bone disorder. Nephrology,16(6), 588-594. (2011).
CrossRef - Scialla, J. J., Leonard, M. B., Townsend, R. R., et al. Correlates of osteoprotegerin and association with aortic pulse wave velocity in patients with chronic kidney disease. Clinical Journal of the American Society of Nephrology,6(11): 2612-2619. (2011).
CrossRef - Sigrist, M. K., Levin, A., Er, L., & McIntyre, C. W. Elevated osteoprotegerin is associated with all-cause mortality in CKD stage 4 and 5 patients in addition to vascular calcification. Nephrology Dialysis Transplantation,24(10): 3157-3162. (2009).
CrossRef

