
Manuscript accepted on :03-08-2021
Published online on: 09-08-2021
Plagiarism Check: Yes
Reviewed by: Dr. Dini Damayanti
Second Review by: Dr. Mohamed Ali
Final Approval by: Dr Patorn Piromchai
Dhyan Chandra Yadav and Saurabh Pal
Department of MCA, VBS Purvanchal University, Jaunpur, India.
Corresponding Author E-mail: dc9532105114@gmail.com
DOI : https://dx.doi.org/10.13005/bpj/2264
Abstract
In medical data science, data classification, pattern generation, data analysis and improving classification accuracy are the important issues in the recent scenario. The main objective of this research to enhanced classification accuracyby four combinations of features technique separately with Neural Network classifier approach.The neural network is analyzed for chronic kidney disease with the help of features reduction and relevanttechniques.In experiment, we used neural network as ensemble model with different features techniques as: Pearson Correlation, Chi-Square, Extra Tree and Lasso regularization. In this research paper, we have prepared training model on 300(75%) instances of chronic kidney disease attributes and testing on 100 (25%) instances.We test the dataset on different applied epochs and calculated accuracy with error rate. The summary of this experiment, we used400 instances with 26 attributes of Chronic Kidney Disease and evaluated highest accuracy calculated (99.98%) with less error rate on passing several epochs by Neural Network ensemble with Lasso model.
Keywords
Correlation Features Selection Method: Extra Tree Chi-Square; Epoch; Error Rate Accuracy; Features Important; Neural Network; Pearson Correlation; Variable Selection and Regularization: Lasso Model
Download this article as:| Copy the following to cite this article: Yadav D. C, Pal S. Performance based Evaluation ofAlgorithmson Chronic Kidney Disease using Hybrid Ensemble Model in Machine Learning. Biomed Pharmacol J 2021;14(3). |
| Copy the following to cite this URL: Yadav D. C, Pal S. Performance based Evaluation ofAlgorithmson Chronic Kidney Disease using Hybrid Ensemble Model in Machine Learning. Biomed Pharmacol J 2021;14(3). Available from: https://bit.ly/2VuN4Jv |
Introduction
Chronic kidney failure is not known until its function deteriorates. Kidney function can only be assessed if it is too bad, then kidney transplantation will be only one way to safe human life.Transplantation will be only one way remains by which can be avoided in this fatal situation.
Some symptoms arise when the kidney is unhealthy such as
Frequent nausea
Frequent vomiting
Loss of appetite
Fatigue
Excessive weakness of sleep
Lack of sleepiness
Frequent urination changes
Mentally weak muscles
Spasms, feeling of tension
Tension, swelling of feet
Persistent itching in the body 1.
On the basis of our previous analysis 2-6, we calculated high accuracy on the basis of ensemble method and majority of voting.The machine learning algorithm provides an environment that makes the study of the data set very easy for the analyst. Machine learning has different algorithms for different property patterns. Some algorithms describe the relationship between attributes and what types of attributes are present in the data set, and some algorithms identify their distribution intensity etc.
Nithya A et al. [2020], discussed about normal and abnormal kidney disease by neural network.Authors used ultrasound image, neural network, multi-kernel k-means clustering, GLCM features, segmentation, classification and bilateral filter for better prediction. They used linear and quadratic based segmentation for find better accuracy (99.61%) compare with other machine learning algorithms7.
Verma AK et al. [2020], analyzed about skin disease by six different machine learning algorithms. Authors used bagging, AdaBoost, and gradient boosting Meta classifiers to predict class level variable prediction. They find accuracy (99.68%) after the applied features selection method, gradient boosting trained algorithms8
Harimoorthy K and Thangavelu M [2020],observed that the hidden pattern in the Chronic Kidney Disease, Diabetes and Heart Disease by different SVM method with Random forest and decision tree. They calculated accuracy (98.7%) by SVM-Radial bias kernel technique on diabetes medical dataset9.
Nazari M et al.[2020], considered tumor patients CT images by different preprocessing machine learning techniques. Authors used three different features selection methods and applied on SVM, random forest, and logistic regression machine learning algorithms. They measured receiver operating characteristic curve on bootstrapped validation cohort and find highest values (0.83) for the SVM model 10.
Yadav DC and Pal S.[2020], discussed about different medical dataset from UCI to prevent deaths from several diseases. Authors minimize error of information in diagnosis by machine learning algorithms and they used proposed new feature selection method combined with twin bounded support vector machine. Finally TBSVM calculated accuracy (86.18%) on different medical dataset 11.
Yadav DC and Pal S[2020], discussed about lack of cardiovascular centre in rural side. In this paper authors used heart data sample from UCI repository.Authors used cluster-based DT learning at various levels for class set combination. They calculated accuracy (88.90%) by cluster Based random forest machine learning algorithm12.
Chaurasia V et al., [2020], identified lower back pain in chronic as a muscled pain, nerves and bones. They used Genetic Algorithm (GA)-based feature selection to improve classification accuracy and used seven classification algorithms. Finally authors find k-Nearest Neighbors calculated better accuracy(85.2%) compare with other machine learning algorithms13.
Alloghani M et al. [2020], analyzed about high-risk of cardiovascular disease and complications in kidney problem. Authors used decision tree boosted decision tree, CN2 rule, logistic regression (Ridge and Lasso), neural network, support vector machine and find support vector machine calculated highest accuracy (91.7%) 14.
Shon HS et al. [2020], discussed about kidney cancer prognosis for (1157) patients and calculated classification accuracy by machine learning algorithms. They used Random forest with lasso method and smote sampling and find (98.08%) accuracy. Authors used different stages of prediction by various features selection methods and prediction methods for better predictions 15.
Table 1: Representation of previous studies by some machine learning algorithms.
| Authors | Methods | Classification Accuracy |
| Nithya A et al. [2020] | ANN and multi-kernel k-means clustering | (99.61%) |
| Verma AK et al. [2020], | Bagging, AdaBoost, and Gradient Boosting | (99.68%) |
| Harimoorthy K and Thangavelu M [2020], | SVM, RF and DT. | (98.7%) |
| Nazari M et al.[2020], | SVM, RF, and LR | (83%) |
| Lima MD et al.[2020], | TBSVM | (86.18%) |
| Magesh G and Swarnalatha P [2020] | Cluster-Based DT and Cluster Based RF | (88.90%) |
| Al Imran A et al. [2020], | Genetic Algorithm and K-NN | (85.2%) |
| Alloghani M et al. [2020], | DT, Ridge, Lasso, NNand SVM | (91.7%) |
| Shon HS et al. [2020], | RF with Lasso and Smote Sampling | (98.08%) |
The main goal of this research is to enhanced classification accuracy by four combinations of features technique separately with Neural Network classifier approach. The neural network is analyzed for chronic kidney disease with the help of features reduction and relevant techniques.
Material and Methods
In this section, we experimentally define Neural Networks with features important extra tree algorithms, lasso regularization and Pearson correlation extraction methods. In this study, we conducted epoch, error rate, accuracy and their improvement from medical data set. The medical data set are stored from UCI with features repository and their correlative features. In this experiment, we used Python, R languages with Weka tool.
Data Description
We have analyzed 400 instances with 26 attributes of Chronic Kidney Diseaseto find the true and false distribution of classes by 0 and 1 as
Classification
0 150
1 250
dtype: int64
The detailed of chronic kidney disease with attributes: Age: Represent by numeric values, bp : Measure the blood pressure, sg : represent gravity specific values, al : represents albumin values, su: sugar, rbc: count as red blood cells, pc: count pus cell, pcc: count pus cell clumps values, ba : detect bacteria, bgr : represents blood glucose random numeric values, bu : Analyzed blood urea, sc : represents serum creatinine numeric values, sod : measure sodium values in body, pot : represents potassium values, hemo : measure hemoglobin numeric values, and other attributes pcv, wc, rc, htn, dm, cad, appet, pe, classification with descriptions as packed cell, volume, white blood cell count, red blood cell count, hypertension, diabetes mellitus, coronary artery disease, appetite, pedal edema, anemia and class respectively.
We measured the density of each attributes on the basis of target variables classification and represent as (Fig 1.).
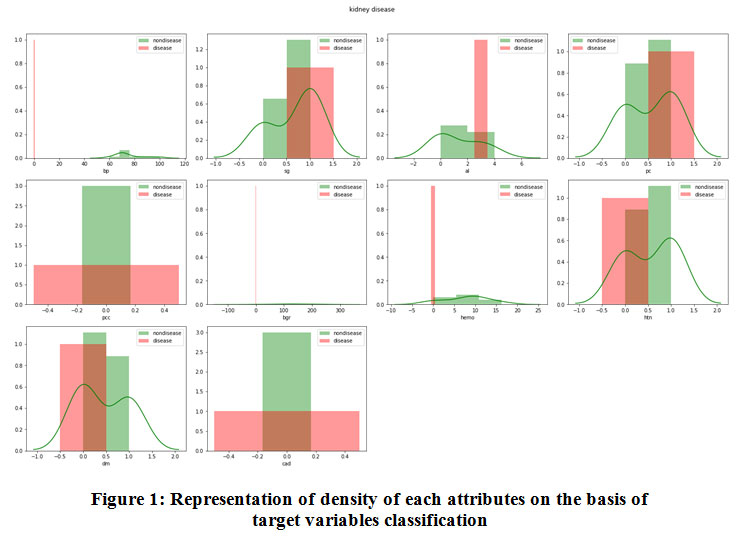 |
Figure 1: Representation of density of each attributes on the basis of target variables classification. |
Epoch
In this paper, we used epoch as a number of instances passes or complete passes through chronic kidney disease training dataset 16. In this analysis we used number of epoch from 100-600 to check the error rate and accuracy evaluated at various level.
Error Rate
In this research, we used error rate as inaccuracy of predicted output values 17. In this experiment, we find if target values categories then the error express in the form of error rate.
Accuracy
In this experiment, we observed and examined good prediction of correct class. It makes decision in diagnosis of chronic kidney disease 18. It is calculated as per the equation:
![]()
In the research, we have study [19-34] for accuracy and error rate on various disease and find how instances and features closely relate with each other.
Proposed Method
In this research paper, we used Neural Network as a classifier of input variables. We have used four features based algorithms: Extra Tree, Pearson Correlation, Lasso model and Chi-Square for better prediction. In this research paper, we have prepared training model on 300(75%) instances of chronic kidney disease attributes and testing on 100 (25%) instances.We calculatedvarious prediction model of Neural Network with higher and lower classification accuracy with different error rate.
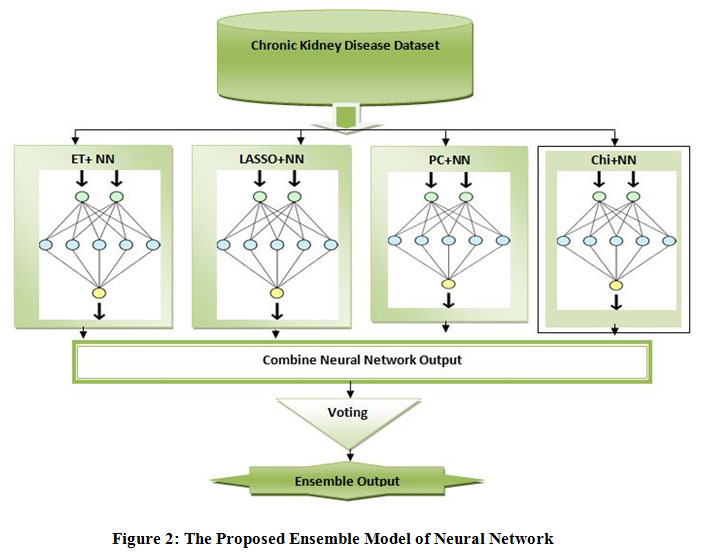 |
Figure 2: The Proposed Ensemble Model of Neural Network. |
We have ensemble neural network with extra tree, Pearson Correlation, Chi-Square and Lasso regularization separately then find their performance improved as per experimental results. We find classification accuracy continuous increase and error rate continuous decrease with the increasing of epoch values.
Results
In this section, the neural network, extra tree, lasso model, Pearson correlation and Chi-square perform the function based classification algorithms. Neural network perform as an ensemble model with lasso model. All the medical dataset are collected from UCI repository. All medical dataset are preprocessed and removed missing values from relative dataset and identify the important features by extra tree features algorithms. The medical dataset in these dataset have different ranges. We have used features selection techniques in whole dataset and select highly relevant attributes by Lasso model, Pearson correlation and chi-square. In each experiment the instances of kidney disease classify into two sections as like training and testing with 75% and 25% in whole instances. The results were done only by class level so we determined number of parts the input variable has to be divided.
Table 2: Representation of highly correlated features (cor_target>0.5) by Pearson Correlation.
| id | 0.838528 |
| al | 0.531562 |
| rbc | 0.510667 |
| hemo | 0.569312 |
| pcv | 0.599753 |
| rc | 0.643162 |
| htn | 0.590438 |
| dm | 0.559060 |
| classification | 1.000000 |
Table 2., represents the selected highly correlated features (cor_target>0.5) because Pearson Correlation decides variables relationship between -1 to +1. The positive correlations assign both variables increase and decrease in same direction. Conversely, negative correlations assign both variables move inversely. A zero assigns no correlation between variables.
Table 3: Representation of correlated features in matrix format by Pearson Correlation.
| id | 1.000000 | -0.468924 | 0.432045 | 0.450748 |
| al | -0.468924 | 1.000000 | 0.128814 | -0.243399 |
| rbc | 0.432045 | 0.128814 | 1.000000 | 0.274146 |
| hemo | 0.450748 – | 0.243399 | 0.274146 | 1.000000 |
| pcv | 0.704580 | 1.000000 | -0.217147 | -0.235200 |
| rc | 0.704580 | 1.000000 | -0.217147 | -0.235200 |
| htn | -0.309572 | -0.217147 | 1.000000 | 0.608118 |
| dm | -0.287206 | -0.235200 | 0.608118 | 1.000000 |
Table 3., represents the correlation matrix as square with same variables in the rows and columns. The lines 1.00 going from top left to the right bottom in diagonal form symmetrically, with the same correlation is shown in figure 3.
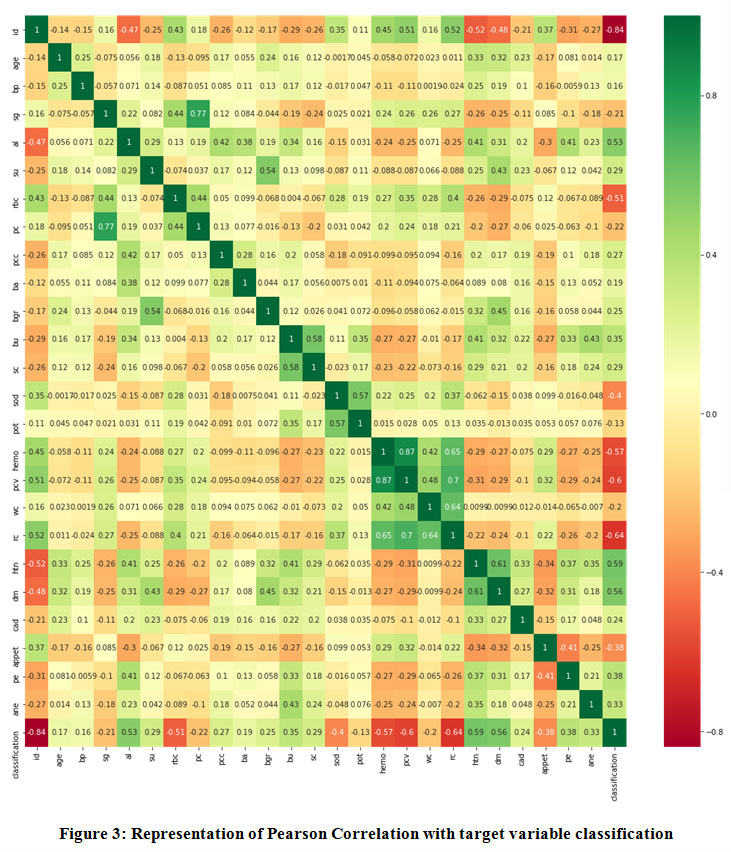 |
Figure 3: Representation of Pearson Correlation with target variable classification. |
Figure 3., represents selected features correlation as dark green values represents high correlation and dark red represents weak correlations. In the first row attribute ID highly correlated itself and weakly correlated with attribute Classification. In the last row Classification attribute highly correlate with itself and weakly with attributes ID.
Table 4: Representation of ImportanceFeatures values by Extra tree of Chronic Kidney Disease.
| 0.0334831 0.00088889 0. 00158434 0.00577434 0.02531112 0.03668745 0.0020202 0.000458180. 0.00368648 0.01682511 0.0009837 0.03013153 0.01168918 .03236054 0.02420388 0.00411614 0.05588843 0.12033901 0.15148568 0. 0.00600248 0.01873192 0.01109339 0.40625492 |
Table 4., represents calculated important features in dataset. These calculated values plot same as in figure 4., the value (0.40625492) of attribute Classification and various attributes assigned by very less values. Figure 4., represent all attributes not assigned their less values but table 4., provide attributes decimal very less values .
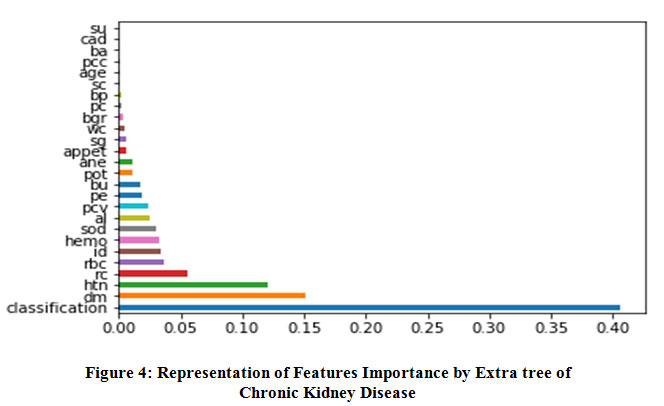 |
Figure 4: Representation of Features Importance by Extra tree of Chronic Kidney Disease. |
Extra Tree features selection method used on whole original sample instead to reduce bias and randomly select the split point of each node to reduce variance. This features selection technique provides the results forkidney disease and calculated highest values of selected attributes:
Classification, dm, htn, rcrbc, id, hemo, sod, al, pcv, pe, bu, pot and ane.
 |
Figure 5: Represents the result of Lasso selected attributes in CKD. |
The LASSO features selection method used to shrinking and removing the coefficients can reduce variance without a substantial increase of the bias. The variables that have a non-zero coefficient after the shrinking process because shrinking process penalizes the coefficients of the regression variables and regulates some of them to zero. Lasso Method represents non_ penalized variables with values range and picked 6 variables and eliminated the other 19 variables as:
Best alpha using built-in LassoCV: 0.437812
Best score using built-in LassoCV: 0.776112
Chi-Square calculated with k-fold cross validation, k=10 and explains attributes scoresas:
Table 5: Represents the result of Chi-Square technique on CKDattributes.
| Specs | Score | |
| 17 | wc | 52947.074533 |
| 0 | id | 18796.992481 |
| 11 | bu | 2363.959173 |
| 13 | sod | 1926.392920 |
| 10 | bgr | 1462.940044 |
| 16 | pcv | 1291.222184 |
| 12 | sc | 360.413289 |
| 15 | hemo | 298.668389 |
| 18 | rc | 291.906188 |
| 4 | al | 216.000000 |
| 25 | classification | 150.000000 |
| 5 | su | 94.800000 |
| 19 | htn | 88.200000 |
| 20 | dm | 82.200000 |
| 1 | age | 80.885458 |
| 2 | bp | 46.109201 |
| 23 | pe | 45.600000 |
| 6 | rbc | 39.638710 |
| 24 | ane | 36.000000 |
| 8 | pcc | 25.200000 |
| 14 | pot | 22.685267 |
| 21 | cad | 20.400000 |
| 9 | ba | 13.200000 |
| 22 | appet | 12.214721 |
| 7 | pc | 3.010746 |
Chi-Square used to test and compare observed with expected frequencies highly sensitive to sample size. The main objective of this features selection method to find goodness of fit variables and measures how well the observed distribution of data fits with independent variables. With the results, we find improvement in classification accuracy and reduce the error rate values by selected features mentioned in discussion section.
Discussion
This section discussed all experimental setup and analyzed Chronic Kidney Disease the performance of neural network was compared with & without features selection methods: neural network with extra tree, lasso method,Pearson correlation and chi-square and predict the complex medical disease.
Table 6: Representation of trainingmodel of 300 instances of CKD attributes.
| Serial | NN | ET+NN | LASSO+NN | PC+NN | Chi+NN |
| Epoch | Accuracy | Accuracy | Accuracy | Accuracy | Accuracy |
| 100 | 75.60 | 85.27 | 98.95 | 72.38 | 93.35 |
| 200 | 79.90 | 92.36 | 99.51 | 78.97 | 93.95 |
| 300 | 82.67 | 95.48 | 98.93 | 97.36 | 96.81 |
| 400 | 87.31 | 95.73 | 99.73 | 95.47 | 95.87 |
| 500 | 87.29 | 95.97 | 98.87 | 98.43 | 96.97 |
| 600 | 87.10 | 95.89 | 98.99 | 98.70 | 96.91 |
The table. 5 represents training model on 300 instances of CKD attributes and we find the increment in accuracy for each algorithm with the passing on different epochs. The algorithm neural network have less accuracy compare to other ensemble model but we find at a level (epoch 500 & 600) all the algorithms have minor changes. The lasso method with neural network always (epoch 100 -600) calculated high accuracy compare with other ensemble model.
Table 7: Representation of testing model 100 instances of CKD attributes.
| Serial | NN | ET+NN | LASSO+NN | PC+NN | Chi+NN |
| Epoch | Accuracy | Accuracy | Accuracy | Accuracy | Accuracy |
| 100 | 74.10 | 87.31 | 99.17 | 73.17 | 94.15 |
| 200 | 78.37 | 91.12 | 99.21 | 79.38 | 94.96 |
| 300 | 81.13 | 96.18 | 99.69 | 96.10 | 95.87 |
| 400 | 87.27 | 96.61 | 99.98 | 96.18 | 95.99 |
| 500 | 87.31 | 96.57 | 99.96 | 97.97 | 97.35 |
| 600 | 87.32 | 96.56 | 99.97 | 97.93 | 97.81 |
The table 7, representation thetesting model on 100 instances of CKD attributes and we find the increment in accuracy for each algorithm with the passing on different epochs. The algorithm neural network have less accuracy compare to other ensemble model but we find at a level (epoch 500 & 600) all the algorithms have minor changes. The lasso method with neural network always (epoch 100 -600) calculated high accuracy compare with other ensemble model.
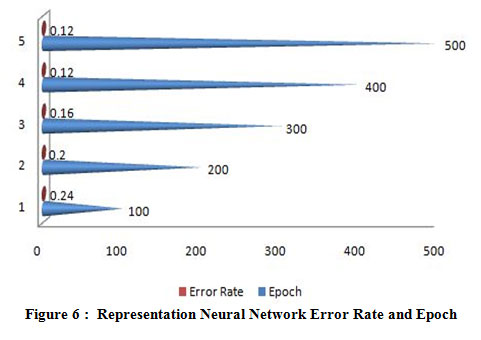 |
Figure 6 : Representation Neural Network Error Rate and Epoch. |
 |
Figure 7: Representation( ET+NN) Error Rate and Epoch. |
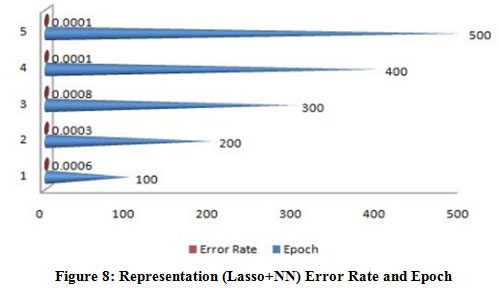 |
Figure 8: Representation (Lasso+NN) Error Rate and Epoch. |
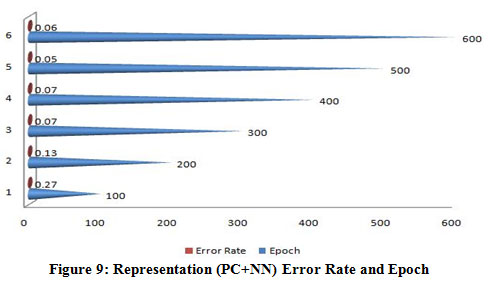 |
Figure 9: Representation (PC+NN) Error Rate and Epoch. |
 |
Figure 10: Representation (Chi+NN) Error Rate and Epoch. |
A figure (6-10) represent the testing model on 100 instances of CKD attributes of workflow error rate and passes epoch by neural network with features methods and generates different data prediction models.The neural network determines the nature of data and generates a train to medical data set.The experimental setup identified last score values for error rate and passes epoch. The error rate of all algorithms have major differences with the passing epoch (100-400) but after that we find minor changing (near nothing) in error rate with passing epoch (500-600). The neural network find (0.12), extra tree (0.36) and ensemble model of neural network with: extra tree (0.16), Lasso model (0.0001), Pearson correlation (0.6) and Chi-square (0.07). After the passing epochs from (100-600), we observed again from (700-1000) epochs but did not find major differences between error rate and calculated accuracy.
Conclusion
In this research paper, we stored data from UCI Repository, 400 instances with 26 attributes of Chronic Kidney Disease. With the results, it is clear that the highest accuracy calculated (99.98%) by Neural Network ensemble with Lasso model. The NeuralNetwork with Lasso model always calculated highest accuracy for each epoch. This ensemble model prepared minimum error rate but calculated error rate is not less compare with other algorithms. The Neural network without ensemble calculated very less error rate compare with other algorithms but calculated less accuracy compare with other algorithms. Finally we find Neural Network with Lasso Model calculated high accuracy and less error rate. The error rate of Neural Network ensemble valuable on two decimal points so we measure error rate difference were minor compare with Neural Network. So Neural Network ensemble with Lasso model performed better compare with other algorithms. For future, we will use feature extraction with feature selected as hybrid modified various applications.
Acknowledgement
The author is grateful to Veer Bahadur Singh Purvanchal University Jaunpur, Uttar Pradesh, for providing financial support to work as Post Doctoral Research Fellowship.
Conflict of Interest
Authors have no conflict of Interest.
Funding Source
This study was not funded.
References
- Saritas T, Floege J. Cardiovascular disease in patients with chronic kidney disease. Herz. 14:1-7; 2020.
- Yadav DC, Pal S. Prediction of thyroid disease using decision tree ensemble method. Human-Intelligent Systems Integration. 6:1-7; 2020.
CrossRef - Yadav DC, Pal S. Discovery of Hidden Pattern in Thyroid Disease by Machine Learning Algorithms. Indian Journal of Public Health Research & Development. 1;11(1); 2020.
CrossRef - Yadav DC, Pal S. To generate an ensemble model for women thyroid prediction using data mining techniques. Asian Pacific Journal of Cancer Prevention. 1;20(4):1275-81; 2019.
CrossRef - Yadav DC, PAL S. Prediction of Heart Disease Using Feature Selection and Random Forest Ensemble Method. International Journal of Pharmaceutical Research.;12(4); 2020.
CrossRef - Yadav DC, Pal S. Thyroid prediction using ensemble data mining techniques. International Journal of Information Technology. 1-1; 2019.
CrossRef - Nithya A, Appathurai A, Venkatadri N, Ramji DR, Palagan CA. Kidney disease detection and segmentation using artificial neural network and multi-kernel k-means clustering for ultrasound images. Measurement. 1;149:106952; 2020.
CrossRef - Verma AK, Pal S, Kumar S. Prediction of skin disease using ensemble data mining techniques and feature selection method—a comparative study. Applied biochemistry and biotechnology. 1;190(2):341-59; 2020.
CrossRef - Harimoorthy K, Thangavelu M. Multi-disease prediction model using improved SVM-radial bias technique in healthcare monitoring system. Journal of Ambient Intelligence and Humanized Computing. 2:1-9; 2020.
CrossRef - Nazari M, Shiri I, Hajianfar G, Oveisi N, Abdollahi H, Deevband MR, Oveisi M, Zaidi H. Noninvasive Fuhrman grading of clear cell renal cell carcinoma using computed tomography radiomic features and machine learning. La radiologiamedica. 19:1-9; 2020.
CrossRef - Yadav DC, Pal S. Analysis of Heart Disease Using Parallel and Sequential ensemble Methods with Feature Selection Techniques: Heart Disease Prediction. International Journal of Big Data and Analytics in Healthcare (IJBDAH). 2021 Jan 1;6(1):40-56.
CrossRef - Yadav DC, Pal S. An Experimental Study of Diversity of Diabetes Disease Features by Bagging and Boosting Ensemble Method with Rule Based Machine Learning Classifier Algorithms. SN Computer Science. 2021 Feb;2(1):1-0.
CrossRef - Chaurasia V, Pal S. Stacking-Based Ensemble Framework and Feature Selection Technique for the Detection of Breast Cancer. SN Computer Science. 2021 Apr;2(2):1-3.
CrossRef - Alloghani M, Al-Jumeily D, Hussain A, Liatsis P, Aljaaf AJ. Performance-Based Prediction of Chronic Kidney Disease Using Machine Learning for High-Risk Cardiovascular Disease Patients. InNature-Inspired Computation in Data Mining and Machine Learning (pp. 187-206). Springer, Cham; 2020.
CrossRef - Shon HS, Batbaatar E, Kim KO, Cha EJ, Kim KA. Classification of Kidney Cancer Data Using Cost-Sensitive Hybrid Deep Learning Approach. Symmetry.;12(1):154; 2020.
CrossRef - Saini G, Khamparia A, Luhach AK. Classification of Plants Using Convolutional Neural Network. InFirst International Conference on Sustainable Technologies for Computational Intelligence (pp. 551-561). Springer, Singapore; 2020.
CrossRef - Chaurasia V, Pal S. Machine learning algorithms using binary classification and multi model ensemble techniques for skin diseases prediction. International Journal of Biomedical Engineering and Technology. 2020;34(1):57-74.
CrossRef - Hahn S, Perry M, Morris CS, Wshah S, Bertges DJ. Machine Deep Learning Accurately Detects Endoleak after Endovascular Abdominal Aortic Aneurysm Repair. JVS: Vascular Science. 2020.
CrossRef - Aggrawal R, Pal S. Sequential Feature Selection and Machine Learning Algorithm-Based Patient’s Death Events Prediction and Diagnosis in Heart Disease. SN Computer Science. 2020 Nov;1(6):1-6.
CrossRef - Yadav DC and Pal ., Discovery of Thyroid Disease Using Different Ensemble Methods with Reduced Error Pruning Technique, Computer-Aided Design for Biomedical Applications,CRC book publishing, pp-294-315; 2021.
CrossRef - Yadav DC and Pal S. Analysis of heart patients using a tree based ensemble model, Modelling and Analysis of Active Biopotential Signals in Healthcare, IOP book publishing, Volume 2, pp-10-23;2021.
CrossRef - Kaur G, Sharma A. Predict chronic kidney disease using data mining algorithms in hadoop. In2017 International Conference on Inventive Computing and Informatics (ICICI) (pp. 973-979). IEEE; 2017.
CrossRef - Kunwar V, Chandel K, Sabitha AS, Bansal A. Chronic Kidney Disease analysis using data mining classification techniques. In2016 6th International Conference-Cloud System and Big Data Engineering (Confluence) (pp. 300-305). IEEE; 2016.
CrossRef - Almansour NA, Syed HF, Khayat NR, Altheeb RK, Juri RE, Alhiyafi J, Alrashed S, Olatunji SO. Neural network and support vector machine for the prediction of chronic kidney disease: A comparative study. Computers in biology and medicine.;109:101-11; 2019.
CrossRef - Rady EH, Anwar AS. Prediction of kidney disease stages using data mining algorithms. Informatics in Medicine Unlocked.;15:100178; 2019.
CrossRef - Arasu D, Thirumalaiselvi R. Review of chronic kidney disease based on data mining techniques. International Journal of Applied Engineering Research.;12(23):13498-505; 2017.
- Chen CC, Hsieh JC, Chao CH, Yang WS, Cheng HT, Chan CK, Lu CJ, Meng HF, Zan HW. Correlation between breath ammonia and blood urea nitrogen levels in chronic kidney disease and dialysis patients. Journal of breath research.;14(3):036002; 2020.
CrossRef - Murshid G, Parvez T, Fezal N, Azaz L, Asif M. Data mining techniques to predict chronic kidney disease. Int. J. Scientific Res. Comput. Sci., Eng. Inf. Technol..;5(2):1220-6; 2019.
CrossRef - Sarkar A, Kumar A, Sarkar S, Pradhan C. Detection and Evaluation of Chronic Kidney Disease Using Different Regression and Classification Algorithms in Machine Learning. InAdvances in Electronics, Communication and Computing (pp. 97-106). Springer, Singapore; 2021.
CrossRef - Liu J, Wu J, Liu S, Li M, Hu K, Li K. Predicting mortality of patients with acute kidney injury in the ICU using XGBoost model. Plos one.;16(2):e0246306; 2021.
CrossRef - Acebo JG, Feliscuzo LS, Romana CL. Model Development in Predicting Seaweed Production Using Data Mining Techniques. InAdvances in Computer, Communication and Computational Sciences (pp. 843-850). Springer, Singapore; 2021.
CrossRef - Wang W, Chakraborty G, Chakraborty B. Predicting the Risk of Chronic Kidney Disease (CKD) Using Machine Learning Algorithm. Applied Sciences.;11(1):202; 2021.
CrossRef - Jiang D, Tu G, Jin D, Wu K, Liu C, Zheng L, Zhou T. A hybrid intelligent model for acute hypotensive episode prediction with large-scale data. Information Sciences.;546:787-802; 2021.
CrossRef - Sahu IK, Panda GK, Das SK. Rough Set Classifications and Performance Analysis in Medical Health Care. InProgress in Advanced Computing and Intelligent Engineering (pp. 411-422). Springer, Singapore; 2021.
CrossRef

