
Manuscript accepted on :09-08-2021
Published online on: 19-08-2021
Plagiarism Check: Yes
Reviewed by: Dr. Ankur Singh Bist

Second Review by: Dr. Sanyam Gandhi
,
Dr. Flavio PalmieriFinal Approval by: Dr. Ian James Martin
Christina Nilofer and Arumugam Mohanapriya*
School of Biosciences and Technology, VIT University, Vellore, Tamil Nadu, India
Corresponding Author E mail: mohanapriyaa@vit.ac.in
DOI : https://dx.doi.org/10.13005/bpj/2263
Abstract
The outbreak of COVID-19 and its mutant variants has become a life-threatening and fatal viral disease to mankind. Several studies have been carried out to identify an effective receptor against coronavirus using clinically driven samples distinguished as hematological, immunological and biochemical biomarkers. Simultaneously, protein interfaces are being researched to understand the structural and functional mechanism of action. Therefore, we characterized and examined the interfaces of corona viral proteins using a dataset consisting of 366 homomeric and 199 heteromeric protein interfaces. The interfaces were analyzed using six parameters including interface area, interface size, van der Waal, hydrogen bond, electrostatic and total stabilizing energies. We observed the interfaces of corona viral proteins (homomer and heteromer) to be alike. Therefore, we clustered the interfaces based on the percent contribution of vdW towards total stabilizing energy as vdW energy dominant (≥60%) and vdW energy subdominant (<60%). We found 91% of interfaces to have vdW energy in dominance with large interface size [146±29 (homomer) and 122±29 (heteromer)] and interface area [1690±683 (homomer) and 1306±355 (heteromer)]. However, we also observed 9% of interfaces to have vdW energy in sub-dominance with small interface size [60±12 (homomer) and 41±20 (heteromer)] and interface area [472±174 (homomer) and 310±199 (heteromer)]. We noticed the interface area of large interfaces to be four-fold more when compared to small interfaces in homomer and heteromer. It was interesting to observe that the small interfaces of homomers to be rich in electrostatics (r2=0.50) destitute of hydrogen bond energy (r2=0.04). However, the heteromeric interfaces were equally pronounced with hydrogen bond (r2=0.70) and electrostatic (r2=0.61) energies. Hence, our earlier findings stating that the small protein interfaces are rich in electrostatic energy remaintrue with the homomeric interfaces of corona viral proteins whereas not in heteromeric interfaces.
Keywords
Corona viral proteins; Hydrogen Bond Energy; Electrostatic Energy; Interface Area; Interface Size; Protein-Protein Interaction; Protein Interface; Total Stabilizing Energy; Van Der Waals Energy
Download this article as:| Copy the following to cite this article: Nilofer C, Mohanapriya A, Insights from the Interfaces of Corona Viral Proteins: Homomers Versus Heteromers. Biomed Pharmacol J 2021;14(3). |
| Copy the following to cite this URL: Nilofer C, Mohanapriya A, Insights from the Interfaces of Corona Viral Proteins: Homomers Versus Heteromers. Biomed Pharmacol J 2021;14(3). Available from: https://bit.ly/3gryCcf |
Introduction
Coronavirus in recent times has become an extensively used term all over the world and rightfully so, owing to COVID-19, the disease caused by one of its kind that has been running rampant since late 2019. However, contrary to most people’s assumption that ‘coronavirus’ refers to a single species; it is a hyponym encompassing several viruses possessing shared characteristics. The family Coronaviridae comprises single-stranded RNA-viruses encapsulated with spike proteins that, under a microscope, are reminiscent of the sun’s corona — hence, according to them, their well-known name. Till date, over 100 million people have been infected with COVID-19 and over 30 million have succumbed to this disease (WHO COVID-19 Weekly Epidemiological Update, 2021), not to mention the immense economic devastation that this pandemic has put the world through. With the world fallen into the clutches of the COVID-19-pandemic, it becomes imperative to characterize not just SARS-CoV-2, the etiological agent of COVID-19, but other coronaviruses as well to be equipped in case of a future viral onslaught. Many initiatives have already been put into motion to explore the SARS-CoV-2’s constitution to obtain cognizance of the virus modus operandi and leveraging that knowledge to innovate effective counters against the disease. Considerable advances have been made in these pursuits following the advent of the COVID-19 pandemic (Ye et al., 2020).
A crucial aspect of contriving a therapeutic remedy is assessing the interface interactions of the proteins, which play vital role in the pathogenicity of the organism in question. Proteins are indispensable to almost all biological processes and irregularities in their interface interactions manifested as aberrations in their form and function, thus either reducing their efficacy or rendering them completely defunct. Proteins evidently play a key role in any virus virulence. Therefore, it is of great interest to acquire sound insights into the interactions stabilizing the key protein-protein interfaces of coronaviruses, as it will unquestionably endow us with necessary intellectual wherewithal to devise the means to curb not just SARS-CoV-2 but any pathogen in consideration. To be able to tamper with and mimic the interface interactions allows us to impede the viral life cycle, consequently halting and dispatching the viral load on its path to debilitating its host. Chuck et al. (2013) reported four different nitrile-based peptidomimetic inhibitors with different N-terminal protective groups and different peptide lengths of the 3C-like protease (3CLpro), an integral protein involved in the replication process of coronaviruses. One of these peptide inhibitors, Cbz-AVLQ-CN, showed a broad-spectrum inhibition against several of the coronavirus strains known to infect humans. Several potential peptidomimetic inhibitors of 3CLpro of a mutated feline coronavirus (FCoV) strain were thoroughly investigated by St John et al. (2015) in their endeavor to discover an effective drug to treat domestic cats suffering from feline infectious peritonitis, a lethal disease caused by this pathogen. Similarities were observed between the substrate-binding sites of the main proteases (Mpro) of transmissible gastroenteritis virus (TGEV), human coronavirus (strain 229E), and the SARS-CoV. Anand et al. (2003) venture on the enticing promise of subtle modifications in the drugs available against the former two, for use in the latter. This study proves to be particularly fascinating as it unveils the tantalizing prospect that the conserved homology in the key protein interface interactions of several coronaviruses can be exploited to design broad-spectrum drugs suitable for the treatment of several coronavirus-related diseases. In line with characterizing the coronavirus proteins with the well-intended goal of reaping the bountiful benefits stemming from it, we through this study seek to understand the homo and heteromeric interface interactions of the said proteins and decipher meaningful inferences from them. It’s rarely the case for any protein to function in solitude. More often than not, proteins operate in complex coordination with other proteins and this brings into the picture a huge number of interactions all of which must work in a stable and sustained manner for the organism to survive. An important requisite of these vital interactions is the formation of protein-protein interfaces. Protein-protein interfaces are defined as the set of residues spanning a region over which two protein subunits, domains, or motifs bind to each other via non-covalent interactions. Covalent interactions, like disulfide bridges, also contribute to interface formation.
Wide arrays of biological and chemical factors guide the formation of a stable protein interface. Chothia and Janin (1975) from their studies remark that the interfaces of proteins are generally closely packed with hydrophobic residues. These hydrophobic residues are more at the interface in comparison to the surface but fewer compared to protein core (Jones & Thornton, 1995; Korn & Burnett, 1991). Mobility, or the lack of it, could be an important feature of protein complexes (Janin & Chothia, 1990). The conformational mobility of the side chains and the main chains of the proteins add another dimension to how protein-protein interfaces can be analyzed and distinguished. The occurrence of hydrophobic residues at the interface and core of the protein than the surface validates the role of hydrophobic interactions in the protein folding process Also, interfaces usually tend to be planar with a surface area that is often proportional to the size of the total protein (Jones and Thornton, 1996). From the assessment of the H-bonds and salt bridges in 319 non-redundant protein-protein interfaces Xu, Tsai, and Nussinov (1997) delineate the occurrence of side-chain side-chain H-bonds to be more common among the interfaces of the associated proteins. Caffery et al. (2004) meticulously scrutinized a set of 64 protein interfaces based on conservation scores they obtained from two different multiple sequence alignments, they observed that protein interfaces are usually more conserved than the surface. However, they noticed that the protein surfaces to be more conserved than the protein interface while using surface-patch analysis. Bahadur et al. (2004) compared the interfaces of protein complexes and homodimers and interpreted the close packing contacts in monomers using parameters like the interface area, polar and non-polar composition and interactions, residue propensity, atomic packing density, buried interface atoms and core residues, and hydrophobic interactions. Their analyses revealed that in contrast to the crystallographic interfaces, biological ones tend to be large and more hydrophobic, having a higher amount of core residues, possessing more fully buried atoms, and exhibiting better shape complementarity. Elez et al. (2018) showed from their survey of biological and crystallographic interfaces that the parameters like intermolecular residue-residue contacts and interaction energies (van der Waals, electrostatic, and desolvation) can effectively discriminate between these interfaces. Additionally, Guharoy and Chakrabarti (2005) demonstrated that the residues that form the core of a biologically relevant interface are more conserved than the ones in its rim regions. The same isn’t observed for crystalline artifacts. Thus, residue conservation expressed in terms of sequence entropy can be used to ascertain whether an interface is truly biologically pertinent or not. Homomeric interfaces appear to be highly populated in hydrogen bonds with non-polar residues while heteromeric interfaces were observed to have polar charged residues with high hydrogen bond density (Zhanhua et al., 2005). Protein heterodimer subunit interaction is important in regulation and catalysis in living cells (Vaishnavi et al., 2010). Guharoy and Chakrabarti (2010) surveyed the interfaces of 121 homodimers and 392 heterocomplexes and concluded that the distribution of conserved residues at the interfaces is not random but rather distinctly clustered. Hydrogen bonds and salt bridges are the key driving force for molecular recognition and specificity among associated proteins (Kuroda & Gray, 2016). The proportion of the different types of covalent and non-covalent interactions differs amongst various proteins based on their origin, composition, and functionality. Nilofer et al. (2019) noted that proteins with small interfaces (area < 1000 Ų) possess considerable levels of electrostatic interactions in proportion to other non-covalent interactions were observed to perform regulatory roles. Interactions aside, other critical interface attributes like solvation potential, interface amino-acid residue propensity, hydrophobicity, planarity, protrusion, and the accessible surface area further distinguish one set of proteins from the others and come in handy in protein-protein interface analysis. Hence, deciphering the arcane aspects of the coronavirus protein-protein interfaces shall shed light on a new path to combating the advance of coronaviruses. Therefore, we analyzed 366 homomeric and 199 heteromeric protein interfaces using six parameters including interface size, interface area, van der Waals, hydrogen bond, electrostatic and total stabilizing energies. To verify the authenticity of our previous finding stating that protein interfaces are predominantly populated with vdW energy (Nilofer et al., 2017) and that the small interfaces are rich in electrostatic energy (Nilofer et al., 2019).
Materials and Methods
Dataset
An updated non-redundant structural dataset of 61 homomeric and 129 heteromeric protein complexes (Table 1) ranging from dimers to heptamers pertaining to SARS-CoV-2 were acquired from the Protein Data Bank (PDB) (Figure 2). The entries conform to the following refinements: (1) Experimental Method – X-Ray Diffraction; (2) Polymer Entity Type – Protein; (3) Refinement Resolution (<3.0 Å); and (4) Polymer Entity Sequence Length (> 50 aminoacids). These 61 homomeric and 129 heteromeric protein complexes gave rise to 366 homomeric and 199 heteromeric interfaces that were examined in this study.
Table 1: List of Coronaviral (homomeric and heteromeric) protein complexes.
| Homo-meric Protein Complexes | ||||||||
| 1WNC | 2FAV | 2IEQ | 3ZBD | 5EPW | 5YM6 | 6IVD | 6VYO | 7CDZ |
| 1WYY | 2G9T | 2Q6D | 4F49 | 5HIZ | 5YM8 | 6KL2 | 6W01 | 7CJD |
| 2AMP | 2GA6 | 2RHB | 4KQZ | 5JIF | 5YVD | 6LPA | 6WXD | 7CMD |
| 2BTL | 2GE7 | 3EAJ | 4L3N | 5LG6 | 5ZHY | 6LXT | 6WZQ | 7E35 |
| 2BXX | 2GE8 | 3EBN | 4MOD | 5N4K | 5ZUV | 6M3M | 6XMK | 7NIO |
| 2CJR | 2GEC | 3ETI | 4S1T | 5RS7 | 6FV2 | 6MEA | 6Z4U | |
| 2D2D | 2GIB | 3EWO | 4UD1 | 5XGR | 6IVC | 6QFY | 7C02 | |
| Hetero-meric Protein Complexes | ||||||||
| 1P9U | 3C9N | 5DO2 | 6LU7 | 6XE1 | 7BEP | 7D2Z | 7KFY | 7LBN |
| 1UK4 | 3I6K | 5E6J | 6M5I | 6XFN | 7BWJ | 7D30 | 7KGJ | 7LFZ |
| 1X7Q | 3R24 | 5F22 | 6PXH | 6XKP | 7BZ5 | 7DEO | 7KGK | 7LG0 |
| 2AHM | 3SNC | 5GMQ | 6U7F | 6XKQ | 7C01 | 7DET | 7KGQ | 7LG2 |
| 2AMQ | 3SNE | 5GSB | 6U7G | 6YLA | 7C8B | 7DEU | 7KGT | 7LM8 |
| 2BEZ | 3VB4 | 5GSV | 6W4H | 6YZ5 | 7C8V | 7EAN | 7KLW | 7LM9 |
| 2DD8 | 3VB6 | 5V6A | 6WAQ | 6Z2M | 7C8W | 7JJC | 7KMG | 7LOP |
| 2GHW | 4KR0 | 5W8U | 6WUU | 6ZCZ | 7CAN | 7JMO | 7KMH | 7NEG |
| 2Q6G | 4M0W | 5WFI | 6WX4 | 7B3O | 7CDI | 7JMP | 7KMI | 7NEV |
| 2XYQ | 4PV8 | 5YL9 | 6XA9 | 7BEH | 7CHB | 7JMW | 7KN5 | |
| 2Z3C | 4QZV | 5YN5 | 6XAA | 7BEI | 7CHC | 7JN5 | 7KN6 | |
| 2Z3D | 4RF1 | 5YY5 | 6XBG | 7BEJ | 7CHF | 7JX3 | 7KN7 | |
| 3ATW | 4RSP | 6BI8 | 6XBI | 7BEL | 7CJF | 7K9Z | 7KVG | |
| 3AVZ | 4ZPT | 6C6Z | 6XC3 | 7BEM | 7CM4 | 7KFW | 7KZB | |
| 3AW0 | 4ZRO | 6IEX | 6XC7 | 7BEN | 7CR5 | 7KFX | 7L0N | |
Interface size
The number of amino-acid residues that make up the interface is referred to as the interface size.
Accessible Surface Area (ASA)
The Accessible Surface Area was estimated for each of 366 homomeric and 199 heteromeric interfaces using the NACCESS, a stand-alone program that is capable of calculating the ASA of a molecule obtaining the atomic coordinate information from a PDB file (Hubbard & Thornton, 1993). It operates on the premise of the Lee and Richards Method (Lee & Richards, 1971) wherein a probe with 1.4Å (radius of water molecule is nearly the same) radius (Jones & Thornton, 1995, 1996) is made to roll over the protein complex in monomer and dimer state to find the ASA.
Interface Area
The interface area for the 366 homomeric and 199 heteromeric protein interfaces was calculated from the findings of NACCESS using the formula: {[ASA of Subunit 1 (monomer state) + ASA of Subunit 2 (monomer state)) – (ASA of the dimer (1 and 2)]} / 2.
Interface Energies
Interface energies (vdW, hydrogen bonds, electrostatic, and total stabilizing energy) were computed for 366 homomeric and 199 heteromeric protein interfaces. The analysis was done using PPCheck, a public webserver useful for quantifying the non-covalent interactions between any two given proteins/chains using distance criteria (Sukhwal&Sowdhamini, 2013, 2015). (Note: the role of water at the protein interface was excluded in the calculations).
Large interfaces and small interfaces
Interfaces were categorized as small and large interface based on interface size and interface area. Interfaces with large interface area [1690±683 (homomeric) 1306±355 (heteromeric)] and interface size [146±29 (homomeric) 122±29 (heteromeric)] were defined as large interface and interfaces with small interface area [472±174 (homomeric) 310±199 (heteromeric)] and interface size [60±12 (homomeric) 41±20 (heteromeric)] were defined as small interface.
Interfaces with dominant and sub-dominant van der Waals energy (vdW)
The small and large interfaces were further categorized as dominant vdW energy and subdominant vdW energy based on the percentage contribution of vdW energy towards total stabilizing energy. Interfaces with the van der Waals energy measuring less than 60% of the total stabilizing energy (sum of van der Waals, hydrogen bonds, and electrostatic energies) are defined as sub-dominant interfaces, while those interfaces whose van der Waals energy’s contribution to the total stabilizing energy greater than 60% are defined as the dominant interfaces.
Statistical analysis
Statistical parameters like Mean, Standard Deviation, the cumulative frequency at a defined bin, range, mode, and distribution for the datasets and sub-datasets were assessed using the statistical functions in Microsoft Office Excel (version 2007). Additionally, multiple linear regression analyses of interface size against interface area, interface energies were carried out using the statistical analysis tool of Microsoft Office Excel (version 2007). The coefficient of determination (r2) was determined alongside the statistical assessment of significance (p-value) through statistical ANOVA test at a 95% confidence limit, the assessment showed significance when p < 0.01.
Results
We downloaded SARS-CoV-2 viral protein complexes [61 homomers and 129 heteromers with 366 and 199 interfaces respectively (Table 1 and Figure 1)] from PDB using the criteria mentioned in Figure 2. We then characterized the interfaces in terms of six parameters consisting of interface area, interface size and interface energies including van der Waals, hydrogen bond, electrostatic and total stabilizing energy. Interface area was calculated using NACCESS program (Lee and Richard method with 1.4Å as probe radius) and the interface size and interface energies were calculated using PPCheck. PPCheck is a computer program; it computes interface energy using distance criteria. We methodically analyzed and compared the interfaces of 366 homomers and 199 heteromers (Figure 1) using six parameters to verify the accuracy of our previous study stating the abundance of vdW energy at the protein interface and that the small protein-protein interfaces are rich in electrostatic energy. The relationship between the interface size (number of residues at the interface) and interface area signifies the strength of protein interface. Likewise, Figure 3 shows that the interface area increases with interface size in all interfaces of homomer and heteromer with a coefficient of determination of r2 ≥ 0.84. It is observed from Figure 4 that the interface size (92±49) and interface area (920±743 Å2) of homomers are greater than the interface size [63±29 (hetero)] and interface area [575±337 Å2 (hetero)] of heteromers. Moreover, Figure 5 shows majority of interfaces to have interface area <1000 Å2 in homomers (52%) and heteromers (92%). Furthermore, we calculated the varying percentage contribution of interface energy including vdW, hydrogen bonds, electrostatic energy towards total stabilizing energy at the interfaces of homomer and heteromer. We found the interfaces of homomers and heteromers to have a high percentage contribution of vdW (above 76%) and a low percentage contribution of hydrogen bonds (above 16%) and electrostatic (above 8%) energies on average (Figure 6). Figure 7 shows that the interfaces of homomer and heteromer are normally distributed and are similar with respect to percent vdW, hydrogen bond and electrostatic energy contribution except the distribution of hydrogen bond energy (Figure 7c) in homomers. However, it is intriguing to observe that on average the interfaces of homomer and heteromer are similar in terms of interface size interface area, vdW, hydrogen bond, electrostatic and total stabilizing energy.
 |
Figure 1: Examples depicting the small and large interfaces of homomeric and heteromeric proteins of SARS-CoV-2. The percentage contributions of interface energies (vdW, hydrogen bond, electrostatic energies) at the interface are also displayed. |
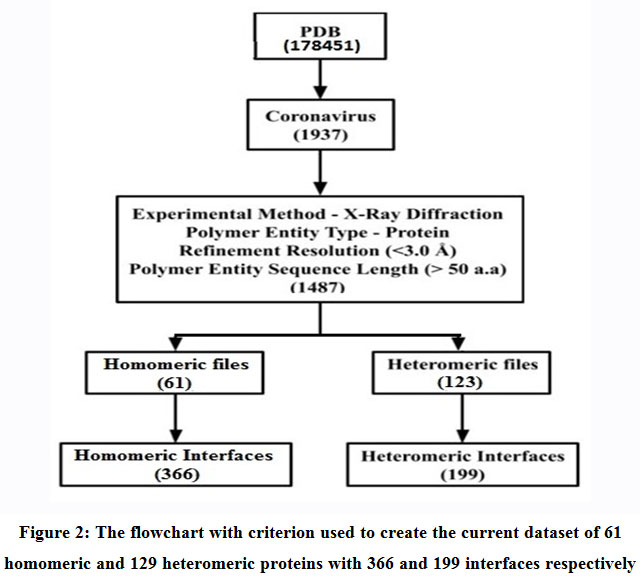 |
Figure 2: The flowchart with criterion used to create the current data set of 61 homomeric and 129 heteromeric proteins with 366 and 199 interfaces respectively. |
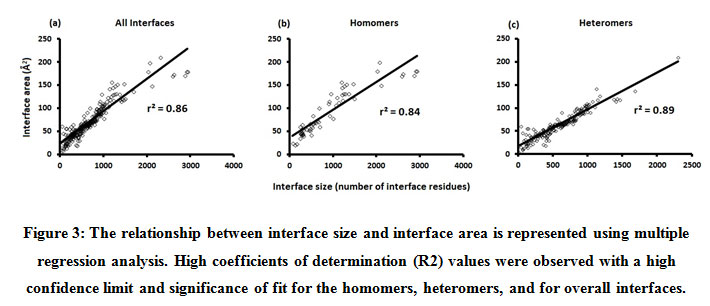 |
Figure 3: The relationship between interface size and interface area is represented using multiple regression analysis. High coefficients of determination (R2) values were observed with a high confidence limit and significance of fit for the homomers, heteromers, and for overall interfaces. |
 |
Figure 4: The Mean and the Standard Deviation of interface size and interface area of homomeric and heteromeric interfaces of SARS-CoV-2 are depicted. |
 |
Figure 5: The distribution of interface area among homomeric and heteromeric interfaces are illustrated using polynomial distribution. Majority of the homomeric and heteromeric interfaces are found to have 500 Å2 and 1000 Å2 on average. |
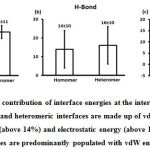 |
Figure 6: Mean percentage contribution of interface energies at the interface is represented. On an average, the homomeric and heteromeric interfaces are made up of vdW energy (above 76%), hydrogen bond energy (above 14%) and electrostatic energy (above 10%). This implies that the protein interfaces are predominantly populated with vdW energy in abundance. |
 |
Figure 7: Distribution of interfaces (in percentage) according to the increasing contributions of vdW, hydrogen bond, and electrostatic energies. The interfaces are distributed normally with vdW and hydrogen bond energy but in the case of electrostatic energy, the interface distribution is reminiscent of a power-law graph. |
Subsequently, we categorized our interfaces into vdW energy dominant (≥60%) and vdW energy subdominant (<60%) interfaces based on the contribution of vdW at the interfaces of homomer and heteromer. The majority (91%) of interfaces of homomer and heteromer are vdW energy dominant having less than 20% of hydrogen bonds and electrostatic energy contribution towards total energy. On the other hand, the 8% of vdW subdominant interfaces of homomer and heteromer are observed to have more than 20% of hydrogen bonds and electrostatic energy. We further found that the interfaces of homomer and heteromer to have three-fold and five-fold more electrostatic energy contribution at the interfaces of homomer and heteromer with small interface area (vdW subdominant) compared to large interface area (vdW dominant) (Figures 8 and 9). While, the hydrogen bonds energy contribution are similar at the large and small interfaces of homomer and heteromer. The vdW energy subdominant interfaces of homomer and heteromer are highly pronounced with electrostatic energy contribution unlike the vdW dominant interfaces (Figure 10). It is evident from Figure 11 that the interface area and interface size of the large interfaces of homomer and heteromer is four-fold more when compared to the small interfaces. The distribution of interface area among the large and small interfaces of homomer and heteromer shows that majority of the interfaces with subdominant vdW energy are observed to have an interface area <1000 Å2 while interface area of dominant vdW interfaces are >1000 Å2 (Figure 12). The relationship between the interface size and interface energy is shown using Figure 13. We found the correlation of total stabilizing energy and vdW to increase with interface size with r2=0.84. Whereas, hydrogen bonds [r2=0.44 (homomeric) r2=0.37 (heteromeric)] and electrostatic energy [r2=0.24 (homomeric) r2=0.15(heteromeric)] have moderate and less correlation with respect to interface size. Hence, to gain in-depth understanding about the interface, we calculated the correlation between interface energy and interface size in large and small interfaces of homomer and heteromer. We found the trend to persist in large and small interface with respect to total and vdW energy to have high coefficient of determination at the interfaces of homomer and heteromer. Interestingly, we found the large interfaces of homomer and heteromer with zero electrostatic energy contribution [Figure 14 (g,h)], while hydrogen bonds being second highly pronounced energy [Figure 14 (e,f)]. Conversely, we found electrostatic energy to be the second highly pronounced energy with respect to the small interfaces of homomer [Figure 14(o)] where the hydrogen bonds energy contribution is zero [Figure 14(m)]. However, the contribution of hydrogen bonds and electrostatic energy is equal in the small interfaces of heteromer [Figure 14 (n,p)]. This shows that the small interfaces having restricted interface area and interface size with vdW subdominant are abundant with electrostatic energy. This conclusion holds true in case of homomers (small interface, vdW subdominant), but not with heteromers (small interface, vdW subdominant).
 |
Figure 8: Graph showing interface distribution (in percentage) with high percentage contributions of vdW, hydrogen bond and electrostatic energies. Most of the interfaces are vdW dominant. |
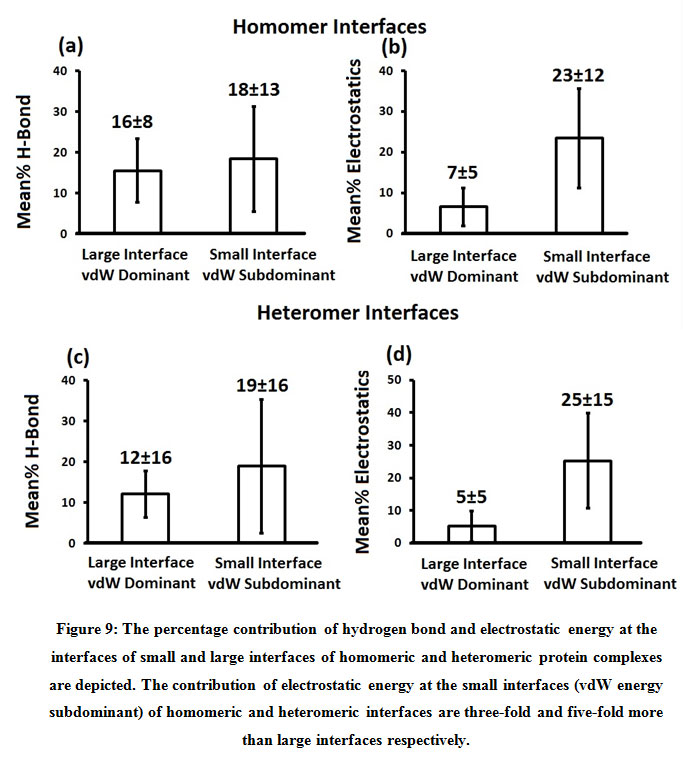 |
Figure 9: The percentage contribution of hydrogen bond and electrostatic energy at the interfaces of small and large interfaces of homomeric and heteromeric protein complexes are depicted. The contribution of electrostatic energy at the small interfaces (vdW energy subdominant) of homomeric and heteromeric interfaces are three-fold and five-fold more than large interfaces respectively. |
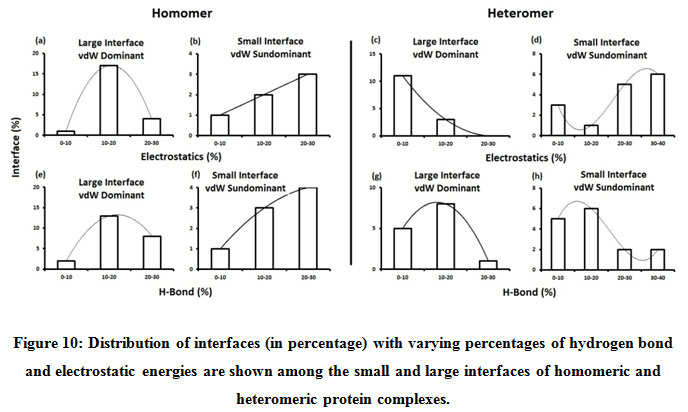 |
Figure 10: Distribution of interfaces (in percentage) with varying percentages of hydrogen bond and electrostatic energies are shown among the small and large interfaces of homomeric and heteromeric protein complexes. |
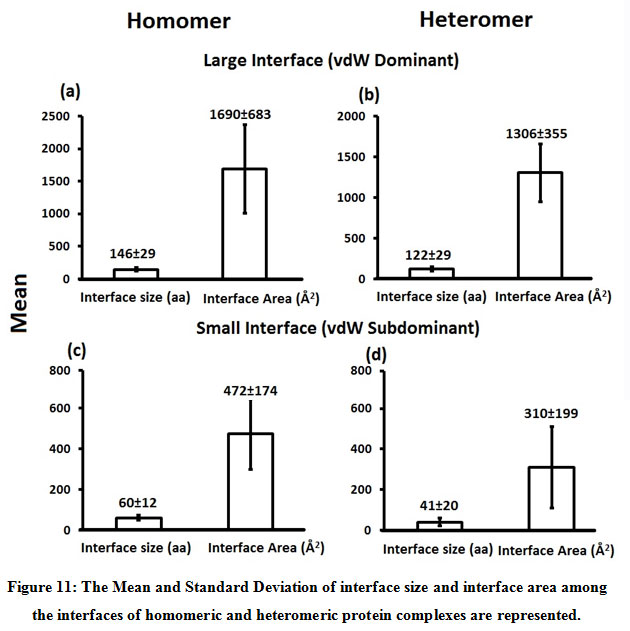 |
Figure 11: The Mean and Standard Deviation of interface size and interface area among the interfaces of homomeric and heteromeric protein complexes are represented. |
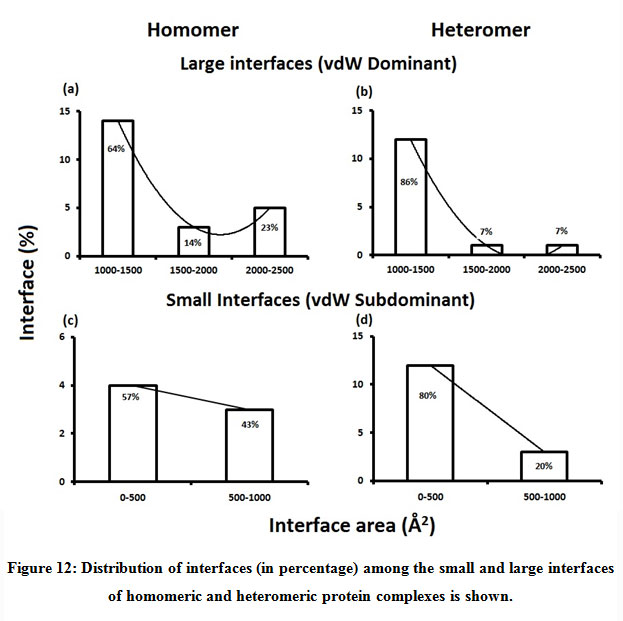 |
Figure 12: Distribution of interfaces (in percentage) among the small and large interfaces of homomeric and heteromeric protein complexes is shown. |
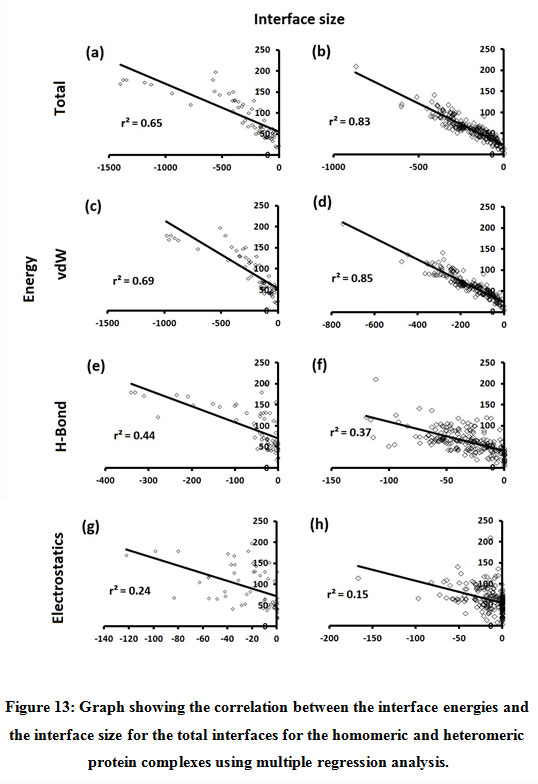 |
Figure 13: Graph showing the correlation between the interface energies and the interface size for the total interfaces for the homomeric and heteromeric protein complexes using multiple regression analysis. |
 |
Figure 14: Graph showing the correlation between the interface energies and the interface size among the small and large interfaces of homomeric and heteromeric protein complexes. The electrostatic energy contribution is more pronounced at the small interfaces of homomer with zero hydrogen bond energy. While the hydrogen bond and electrostatic energy contribution is equal at the small interfaces of heteromeric proteins. |
Discussion
Coronavirus has debilitated the health of the human populace and thrown the world’s economy into disarray. We can’t afford to let it or any of its kin hurl in another maelstrom of chaos again. Hence, there is an immediate need to concentrate on finding and delivering new promising solutions to deal with coronaviruses. A diverse array of remedies has sprung up from the staunch efforts of many researchers (Ahsan et al., 2020; Auwaerter&Casadevall, 2020; Yang, 2021; Odolczyk et al., 2021). Research into the functioning of SARS-CoV-2 has unearthed tantalizing new details about the linchpins in its viral architecture, which serve as potential drug targets (Gordon et al., 2020; Xie et al., 2020; Sakkiah et al., 2021). Galvanized by the spirited works happening all over the world, this study endeavors to delineate the homomeric and heteromeric interface interactions of coronavirus proteins, which would prove to be fruitful in the development of new and efficacious therapeutic remedies. Understanding the vital interface interactions of coronavirus proteins is a pivotal step in the development of an effective and efficient therapeutic remedy. Hence, it is of interest to explore the protein interfaces of SARS-CoV-2 and to verify our former findings stating that protein interfaces are predominantly dominated with vdW energy while hydrogen bond and electrostatic energy to play a selective role (Nilofer et al., 2017) and also that the small protein interfaces are rich in electrostatic energy (Nilofer et al. 2019) using X-ray structures from PDB.
Thus far, protein interfaces are defined using several physical and chemical features including hydration, hydrophobicity, hydrophilicity, van der Waals interaction, aromatic residues, hydrogen bonds, electrostatic effects, conserved residues, conformational changes, size, gap index, volume, shape complementarity, residue preference, the presence of water molecules and binding energy (Caffrey et al., 2004; Bahadur et al., 2004; Chothia & Janin, 1975; Chakrabarti & Janin, 2002; Guharoy & Chakrabarti, 2010; Chothia et al., 1976; Gromiha et al., 2009; Guharoy & Sowmya et al., 2011; Jones, 2012; Janin & Chothia, 1990; Korn & Burnett, 1991; Jones & Thornton, 1995, 1996, 1997a, 1997b; Li et al., 2006; Lo Conte et al., 1999; Miller et al., 1987; Marchetti et al., 2019; Nilofer et al., 2017; Murakami & Jones, 2006; Pal et al., 2007; Robert & Janin, 1998; Sowmya et al., 2015; Sowmya & Ranganathan, 2015; Tsai et al., 2008; Taechalertpaisarn et al., 2019; Yang & Gong, 2018; Xu et al., 1997; Zhanhua et al., 2005). The extensive research on interface analysis (Li et al., 2019), protein docking methods (Porter et al., 2019; Dauzhenka et al., 2018;) and interface feature predictors (Correa Marrero et al., 2019; Bendell et al., 2014; Dai et al., 2016; Daberdaku& Ferrari, 2018; Guo et al., 2016; Garcia-Garcia et al., 2017; Hwang et al., 2016; Humphris&Kortemme, 2008; Li &Kihara, 2012; Jordan et al., 2012; Qiao et al., 2018; Moreira et al., 2017; Xue et al., 2011Wang et al., 2017;) has deepened our understanding on protein-protein interaction. Hence, the identification of novel structural features of known interfaces using statistical analysis is pertinent to the current scenario dealt with the spread of SARS-CoV-2 to understand its protein-protein interaction. Protein binding and folding is more fascinating compared to protein-protein interaction (Li et al., 2005; Lulu et al., 2009). It is of significance to relate molecular function with the structural features of homomeric and heteromeric interfaces. Therefore, we performed statistical analysis on 366 homomeric and 199 heteromeric interfaces of SARS-CoV-2 using six parameters including interface area, interface size and interface energies (van der Waals, hydrogen bonds, electrostatic and total energy) and identified new structural features in relation to molecular function.
Protein size play a significant role in protein-protein interaction and protein docking (Martin, 2014). Similarly, proteins with different size and shape come together with the help of stable interface (Vaishnavi et al., 2010). Miller et al., 1987 defined interface area as the change in accessible surface area during interface formation and described protein interfaces using interface size. The potency of protein binding is determined by its interface size. We show the interface area to increase with interface size with r2>0.86 (high co-efficient of determination). Majority of the interfaces are found to have interface area less than 1000 Å2 in homomeric and heteromeric protein interfaces. This finding is in contrast to our former results stating most of interfaces to have interface area more than 1000 Å2. Each protein interface is unique and has varying contribution of interface attributes including interface area, interface size, vdW, hydrogen bonds, electrostatic energy and total stabilizing energy. The quantification of the interface attributes help in identifying the major stabilizing factors at the protein interface which in-turn is significant to enhance our understanding of protein-protein interaction. We know that the protein interfaces contain hydrophobic residues (Chothia et al., 1976; Chothia & Janin, 1975; Jones & Thornton, 1995; Korn & Burnett, 1991; Tsai et al., 2008), hydrogen bonds (Xu et al., 1997; Zhanhua et al., 2005), charge complementarity (Lo Conte, Chothia, & Janin, 1999; Xu et al., 1997), charged, aliphatic and aromatic residues (Gromiha et al., 2009), polar (Petras& Emil, 2006) and non-polar residues (Sowmya & Ranganathan, 2015; Sowmya et al., 2011). The presence of hydrogen bonds and electrostatic energy has been documented in literature. However, the contribution of these interface energies towards total stabilizing energy is not accurately reported. Nilofer et al., 2017 described that the interfaces are van der Waals energy dominant on average with limited hydrogen bond and electrostatic energy. Subsequently, it was reported that the electrostatic energies are abundant in small protein interfaces (Nilofer et al., 2019). In addition we confirm these findings to hold true with the SARS-CoV-2 dataset showing the interfaces of homomeric and heteromeric proteins to be vdW dominant (above 76%) with selective hydrogen bonds (above 16%) and electrostatic energy (above 8%) and also we found small interfaces of homomers to be rich in electrostatic energy with zero hydrogen bond energy contribution.We observed majority of interfaces to have dominant vdW energy [90% (homomeric) 92% (heteromeric)] compared to subdominant vdW energy [10% (homomeric) 8% (heteromeric)]. Large interfaces were found to have four times of interface size and interface area than small interfaces. It is known that vdW and hydrogen bond energies to increase with interface size in homomeric and heteromeric protein interfaces unlike electrostatic energy (Nilofer et al., 2019). However, electrostatic energy and salt bridges were reported to increase with interface size in regulatory-inhibitory interfaces (Sowmya et al., 2015). We observed large interfaces of homomeric and heteromeric proteins with zero electrostatic energy [r2=0 (homomeric) r2=0(heteromeric)] contribution. Conversely, we observed small interfaces to be rich in electrostatic energy [r2=0.50 (homomeric) r2=0.61 (heteromeric)] where the vdW energy is subdominant and hydrogen bond energy is at its minimum. Therefore, we find these findings to be in agreement with our former conclusions stating that protein interfaces to be vdW dominant with limited hydrogen bond and electrostatic energies (Nilofer et al., 2017) and also that small protein interfaces with small interface area and interface size are rich in electrostatics (Nilofer et al., 2019).
Conclusion
Statistical analyses of the homomeric and heteromeric protein-protein interfaces of coronavirus using interface size, area, and energies reveal that these interfaces are largely held together by vdW energy. Of the 366 homomeric and 199 heteromeric protein-protein interfaces surveyed, 91% of interface possesses a large interface size and area, where vdW energy reigns as the dominant contributing energy. However, 9% of the dataset were observed to have small interface size and small interface area with sub-dominant vdW energy. The contributions of hydrogen bond and electrostatic energies are remarkable at small interfaces with sub-dominant vdW energy. We found the electrostatic contribution at the small interfaces having small interface area and interface size to be three-fold and five-fold more in homomeric and heteromeric protein interfaces respectively. Also, we observed the small interfaces of homomeric interfaces to be highly pronounced with electrostatic energy in the absence of hydrogen bond energy. While the contribution of hydrogen bond and electrostatic energies are same in the small interfaces of heteromeric proteins. Hence, our previous finding stating that the protein interfaces are predominantly populated with vdW energy and that the small interfaces are rich in electrostatics holds true in case of homomers but not in the case of heteromers. In future, we plan to extend this work by finding the amino acid propensities using in-house python program and predict hotspot residues at the interfaces of coronavirus spike glycoprotein and its interacting partner. This prediction will give us more deep insights about the inter-residue interaction which will help us in drug discovery and development process. These insights into the homomeric and heteromeric interfaces of coronavirus proteins gained from the statistical analyses of their structural features will undeniably further our understanding of their molecular functioning.
Acknowledgement
Christina Nilofer thanks VIT University for the support towards the completion of this work and publication. Christina Nilofer extends her gratitude towards Thuraimurugan Hemanand, Chakravarthy Muralidharan Bhargavan and Navaneethan Nandha for their immense contribution and support towards this paper.
Conflict of Interest
The authors declare that there is no financial conflict of interest.
Funding Source
The authors declare that there is no funding support for this publication.
References
- Ahsan, W., Alhazmi, H. A., Patel, K. S., Mangla, B., Al Bratty, M., Javed, S., Najmi, A., Sultan, M. H., Makeen, H. A., Khalid, A., Mohan, S., Taha, M., & Sultana, S. (2020). Recent Advancements in the Diagnosis, Prevention, and Prospective Drug Therapy of COVID-19. Frontiers in public health, 8, 384. org/10.3389/fpubh.2020.00384
CrossRef - Anand, K., Ziebuhr, J., Wadhwani, P., Mesters, J. R., &Hilgenfeld, R. (2003). Coronavirus main proteinase (3CLpro) structure: basis for design of anti-SARS drugs. Science (New York, N.Y.), 300(5626), 1763–1767. doi.org/10.1126/science.1085658
CrossRef - Auwaerter, P. G., Casadevall, A. (2020). Is the Coronavirus Treatable? Johns Hopkins Medicine. https://www.hopkinsmedicine.org/health/conditions-and-diseases/coronavirus/coronavirus-treatment-whats-in-development
- Bahadur, R. P., Chakrabarti, P., Rodier, F., & Janin, J. (2004). A dissection of specific and non-specific protein–protein interfaces. Journal of Molecular Biology, 336(4), 943–955. doi:10.1016/j.jmb.2003.12.073
CrossRef - Bendell, C. J., Liu, S., Aumentado-Armstrong, T., Istrate, B., Cernek, P. T., Khan, S., … Murgita, R. A. (2014). Transient protein–protein interface prediction: Datasets, features, algorithms, and the RAD-T predictor. BMC Bioinformatics, 15(1), 82. doi:10.1186/1471-2105-15-82
CrossRef - Caffrey, D. R., Somaroo, S., Hughes, J. D., Mintseris, J., & Huang, E. S. (2004). Are protein–protein interfaces more conserved in sequence than the rest of the protein surface? Protein Science, 13(1), 190–202. doi:10.1110/ps.03323604
CrossRef - Chakrabarti, P., & Janin, J. (2002). Dissecting protein–protein recognition sites. Proteins: Structure, Function, and Genetics, 47(3), 334–343. doi:10. 1002/prot.10085
CrossRef - Chothia, C., & Janin, J. (1975). Principles of protein–protein recognition. Nature, 256(5520), 705–708. doi:10.1038/256705a0
CrossRef - Chothia, C., Wodak, S., & Janin, J. (1976). Role of subunit interfaces in the allosteric mechanism of hemoglobin. Proceedings of the National Academy of Sciences of the United States of America, 73(11), 3793–3797. doi:10.1073/pnas.73.11.3793
CrossRef - Chuck, C. P., Chen, C., Ke, Z., Wan, D. C., Chow, H. F., & Wong, K. B. (2013). Design, synthesis and crystallographic analysis of nitrile-based broad-spectrum peptidomimetic inhibitors for coronavirus 3C-like proteases.European journal of medicinal chemistry, 59, 1–6. doi.org/10.1016/j.ejmech.2012.10.053
CrossRef - Correa Marrero, M., Immink, R. G. H., de Ridder, D., & van Dijk, A. D. J. (2019). Improved inference of intermolecular contacts through protein–protein interaction prediction using co-evolutionary analysis. Bioinformatics, 35, 2036–2042. doi:10.1093/bioinformatics/bty924
CrossRef - Dai, W., Wu, A., Ma, L., Li, Y. X., Jiang, T., & Li, Y. Y. (2016). A novel index of protein–protein interface propensity improves interface residue recognition. BMC Systems Biology, 10(S4), 112. doi:10.1186/s12918- 016-0351-7
CrossRef - Daberdaku, S., & Ferrari, C. (2018). Exploring the potential of 3D Zernike descriptors and SVM for protein-protein interface prediction. BMC Bioinformatics, 19(1), 35. doi:10.1186/s12859-018-2043-3
CrossRef - Dauzhenka, T., Kundrotas, P. J., &Vakser, I. A. (2018). Computational feasibility of an exhaustive search of side-chain conformations in protein–protein docking. Journal of Computational Chemistry, 39(24), 2012–2021. doi:10.1002/jcc.25381
CrossRef - Elez, K., Bonvin, A., &Vangone, A. (2018). Distinguishing crystallographic from biological interfaces in protein complexes: role of intermolecular contacts and energetics for classification. BMC bioinformatics, 19(Suppl 15), 438.
CrossRef - Garcia-Garcia, J., Valls-Comamala, V., Guney, E., Andreu, D., Munoz, F. J., ~ Fernandez-Fuentes, N., … Oliva, B. (2017). iFrag: A protein–protein interface prediction server based on sequence fragments. Journal of Molecular Biology, 429(3), 382–389. doi:10.1016/j.jmb.2016.11.034
CrossRef - Gordon, D. E., Hiatt, J., Bouhaddou, M., Rezelj, V. V., Ulferts, S., Braberg, H., Jureka, A. S., Obernier, K., Guo, J. Z., Batra, J., Kaake, R. M., Weckstein, A. R., Owens, T. W., Gupta, M., Pourmal, S., Titus, E. W., Cakir, M., Soucheray, M., McGregor, M., Cakir, Z., … Krogan, N. J. (2020). Comparative host-coronavirus protein interaction networks reveal pan-viral disease mechanisms. Science (New York, N.Y.), 370(6521), eabe9403. org/10.1126/science.abe9403
CrossRef - Gromiha, M. M., Yokota, K., & Fukui, K. (2009). Energy based approach for understanding the recognition mechanism in protein–protein complexes. Molecular Biosystems, 5, 1779–1786. doi:10.1039/b904161n
CrossRef - Guharoy, M., & Chakrabarti, P. (2005). Conservation and relative importance of residues across protein-protein interfaces. Proceedings of the National Academy of Sciences of the United States of America, 102(43), 15447–15452. doi:10.1073/pnas.0505425102
CrossRef - Guharoy, M., & Chakrabarti, P. (2010). Conserved residue clusters at protein–protein interfaces and their use in binding site identification. BMC Bioinformatics, 11(1), 286. doi:10.1186/1471-2105-11-286
CrossRef - Guo, F., Ding, Y., Li, S. C., Shen, C., & Wang, L. (2016). Protein–protein interface prediction based on hexagon structure similarity. Computational Biology and Chemistry, 63, 83–88. doi:10.1016/j.compbiolchem.2016.02.008
CrossRef - Hubbard, S., & Thornton, J. (1993). NACCESS, computer program. London: Department of Biochemistry Molecular Biology, University College.
- Humphris, E. L., &Kortemme, T. (2008). Prediction of protein–protein interface sequence diversity using flexible backbone computational protein design. Structure, 16(12), 1777–1788. doi:10.1016/j.str.2008.09.012
CrossRef - Hwang, H., Petrey, D., & Honig, B. (2016). A hybrid method for protein–protein interface prediction. Protein Science, 25(1), 159–165. doi: 10.1002/pro.2744
CrossRef - Janin, J., & Chothia, C. (1990). The structure of protein–protein recognition sites. The Journal of Biological Chemistry, 265(27), 16027–16030. Jones, S. (2012). Computational and structural characterisation of protein associations. Advances in Experimental Medicine and Biology, 747, 42–54. doi:10.1007/978-1-4614-3229-6_3
CrossRef - Jones, S., & Thornton, J. M. (1995). Protein–protein interactions: A review of protein dimer structures. Progress in Biophysics and Molecular Biology, 63(1), 31–65. doi:10.1016/0079-6107(94)00008-W
CrossRef - Jones, S., & Thornton, J. M. (1996). Principles of protein–protein interactions. Proceedings of the National Academy of Sciences of the United States of America, 93(1), 13–20. doi:10.1073/pnas.93.1.13
CrossRef - Jones, S., & Thornton, J. M. (1997a). Analysis of protein–protein interaction sites using surface patches. Journal of Molecular Biology, 272(1), 121–132. doi:10.1006/jmbi.1997.1234
CrossRef - Jones, S., & Thornton, J. M. (1997b). Prediction of protein–protein interaction sites using patch analysis. Journal of Molecular Biology, 272(1), 133–143. doi:10.1006/jmbi.1997.1233
CrossRef - Jordan, R. A., El-Manzalawy, Y., Dobbs, D., &Honavar, V. (2012). Predicting protein–protein interface residues using local surface structural similarity. BMC Bioinformatics, 13(1), 41. doi:10.1186/1471-2105- 13-41
CrossRef - Korn, A. P., & Burnett, R. M. (1991). Distribution and complementarity of hydropathy in multisubunit proteins. Proteins, 9(1), 37–55. doi:10. 1002/prot.340090106
CrossRef - Kuroda, D., & Gray, J. J. (2016). Shape complementarity and hydrogen bond preferences in protein-protein interfaces: implications for antibody modeling and protein-protein docking. Bioinformatics (Oxford, England), 32(16), 2451–2456. https://doi.org/10.1093/bioinformatics/btw197
CrossRef - Lee, B., & Richards, F. M. (1971). The interpretation of protein structures: Estimation of static accessibility. Journal of Molecular Biology, 55(3), 379–400. doi:10.1016/0022-2836(71)90324-x
CrossRef - Li, B., &Kihara, D. (2012). Protein docking prediction using predicted protein–protein interface. BMC Bioinformatics, 13(1), 7.doi:10.1186/1471- 2105-13-7
CrossRef - Li, L., Gunasekaran, K., Gan, J. G.-K., Zhanhua, C., Shapshak, P., Sakharkar, M. K., … Kangueane, P. (2005). Structural features differentiate the mechanisms between 2S (2 state) and 3S (3 state) folding homodimers. Bioinformation, 1(2), 42–49. doi:10.6026/97320630001042
CrossRef - Li, L., Zhao, B., Cui, Z., Gan, J., Sakharkar, M. K., & Kangueane, P. (2006). Identification of hot spot residues at protein–protein interface. Bioinformation, 1(4), 121–126. doi:10.6026/97320630001121
CrossRef - Li, M., He, Q., Ma, J., He, F., Zhu, Y., Chang, C., … Chen, T. (2019). PPICurator: A tool for extracting comprehensive protein–protein interaction information. Proteomics, 19(4), 1800291.
CrossRef - Lo Conte, L., Chothia, C., & Janin, J. (1999). The atomic structure of protein–protein recognition sites. Journal of Molecular Biology, 285(5), 2177–2198. doi:10.1006/jmbi.1998.2439
CrossRef - Lulu, S., Suresh, A., Karthikraja, V., Arumugam, M., Kayathri, R., & Kangueane, P. (2009). Structural features for homodimer folding mechanism. Journal of Molecular Graphics and Modelling, 28(2), 88–94. doi:10.1016/j.jmgm.2009.04.002
CrossRef - Marchetti, F., Capelli, R., Rizzato, F., Laio, A., & Colombo, G. (2019). The subtle trade-off between evolutionary and energetic constraints in protein–protein interactions. The Journal of Physical Chemistry Letters, 10(7), 1489–1497. doi:10.1021/acs.jpclett.9b00191
CrossRef - Martin, J. (2014). Benchmarking protein–protein interface predictions: Why you should care about protein size. Proteins: Structure, Function, and Bioinformatics, 82(7), 1444–1452. doi:10.1002/prot.24512
CrossRef - Miller, S., Lesk, A. M., Janin, J., & Chothia, C. (1987). The accessible surface area and stability of oligomeric proteins. Nature, 328(6133), 834–836. doi:10.1038/328834a0
CrossRef - Moreira, I. S., Koukos, P. I., Melo, R., Almeida, J. G., Preto, A. J., Schaarschmidt, J., … Bonvin, A. M. J. J. (2017). SpotOn: High accuracy identification of protein–protein interface hot-spots. Scientific Reports, 7(1), 8007. doi:10.1038/s41598-017-08321-2
CrossRef - Murakami, Y., & Jones, S. (2006). SHARP2: Protein–protein interaction predictions using patch analysis. Bioinformatics, 22(14), 1794–1795. doi: 10.1093/bioinformatics/btl171
CrossRef - Nilofer, C., Sukhwal, A., Mohanapriya, A., & Kangueane, P. (2017). Protein–protein interfaces are vdW dominant with selective H-bonds and (or) electrostatic towards broad functional specificity. Bioinformation, 13(6), 164–173. doi:10.6026/97320630013164
CrossRef - Odolczyk, N., Marzec, E., Winiewska-Szajewska, M., Poznański, J., &Zielenkiewicz, P. (2021). Native Structure-Based Peptides as Potential Protein-Protein Interaction Inhibitors of SARS-CoV-2 Spike Protein and Human ACE2 Receptor. Molecules (Basel, Switzerland), 26(8), 2157. https://doi.org/10.3390/molecules26082157
CrossRef - Organization WHO (2021, May 18). COVID-19 Weekly Epidemiological Update.
- Pal, A., Chakrabarti, P., Bahadur, R., Rodier, F., & Janin, J. (2007). Peptide segments in protein–protein interfaces. Journal of Biosciences, 32(1), 101–111.
CrossRef - Petras, J. K., & Emil, A. (2006). Electrostatic properties of protein–protein complexes. Biophysical Journal, 91, 1724–1736. doi:10.1529/biophysj. 106.086025
CrossRef - Porter, K. A., Desta, I., Kozakov, D., & Vajda, S. (2019). What method to use for protein-protein docking? Current Opinion in Structural Biology, 55, 1–7. doi:10.1016/j.sbi.2018.12.010
CrossRef - Qiao, Y., Xiong, Y., Gao, H., Zhu, X., & Chen, P. (2018). Protein–protein interface hot spots prediction based on a hybrid feature selection strategy. BMC Bioinformatics, 19(1), 14. doi:10.1186/s12859-018-2009-5
CrossRef - Robert, C. H., & Janin, J. (1998). A soft, mean-field potential derived from crystal contacts for predicting protein-protein interactions. Journal of Molecular Biology, 283(5), 1037–1047. doi:10.1006/jmbi.1998.2152
CrossRef - Sakkiah, S., Guo, W., Pan, B., Ji, Z., Yavas, G., Azevedo, M., Hawes, J., Patterson, T. A., & Hong, H. (2021). Elucidating Interactions Between SARS-CoV-2 Trimeric Spike Protein and ACE2 Using Homology Modeling and Molecular Dynamics Simulations. Frontiers in chemistry, 8, 622632.
CrossRef - Sowmya, G., Anita, S., & Kangueane, P. (2011). Insights from the structural analysis of protein heterodimer interfaces. Bioinformation, 6(4), 137–143. doi:10.6026/97320630006137
CrossRef - Sowmya, G., Breen, E. J., & Ranganathan, S. (2015). Linking structural features of protein complexes and biological function. Protein Science, 24(9), 1486–1494. doi:10.1002/pro.2736
CrossRef - Sowmya, G., & Ranganathan, S. (2015). Discrete structural features among interface residue-level classes. BMC Bioinformatics, 16(S18), S8. doi:10.1186/1471-2105-16-S18-S8
CrossRef - St John, S. E., Therkelsen, M. D., Nyalapatla, P. R., Osswald, H. L., Ghosh, A. K., &Mesecar, A. D. (2015). X-ray structure and inhibition of the feline infectious peritonitis virus 3C-like protease: Structural implications for drug design. Bioorganic & medicinal chemistry letters, 25(22), 5072–5077. doi.org/10.1016/j.bmcl.2015.10.023
CrossRef - Sukhwal, A., & Sowdhamini, R. (2013). Oligomerisation status and evolutionary conservation of interfaces of protein structural domain superfamilies. Molecular Biosystems, 9(7), 1652–1661. doi:10.1039/c3mb25484d
CrossRef - Sukhwal, A., & Sowdhamini, R. (2015). PPCheck: A webserver for the quantitative analysis of protein–protein interfaces and prediction of residue hotspot. Bioinformatics and Biology Insights, 9, 141–151. doi: 10.4137/BBI.S25928
CrossRef - Taechalertpaisarn, J., Lyu, R.-L., Arancillo, M., Lin, C.-M., Perez, L. M., Ioerger, T. R., & Burgess, K. (2019). Correlations between secondary structure- and protein–protein interface-mimicry: The interface mimicry hypothesis. Organic & Biomolecular Chemistry, 17(12), 3267–3274. doi:10.1039/C9OB00204A
CrossRef - Tsai, C. J., Lin, S. L., Wolfson, H. J., &Nussinov, R. (2008). Studies of protein–protein interfaces: A statistical analysis of the hydrophobic effect. Protein Science, 6(1), 53–64. doi:10.1002/pro.5560060106
CrossRef - Vaishnavi, A., Sowmya, G., Kalaivanii, J., Ilakya, S., Kangueane, U., & Kangueane, P. (2010). Interaction modes at protein hetero-dimer interfaces. Bioinformation, 4(7), 310–319. doi:10.6026/ 97320630004310
CrossRef - Wang, W., Yang, Y., Yin, J., & Gong, X. (2017). Different protein–protein interface patterns predicted by different machine learning methods. Scientific Reports, 7(1), 16023. doi:10.1038/s41598-017-16397-z
CrossRef - Xie, Y., Karki, C. B., Du, D., Li, H., Wang, J., Sobitan, A., Teng, S., Tang, Q., & Li, L. (2020). Spike Proteins of SARS-CoV and SARS-CoV-2 Utilize Different Mechanisms to Bind With Human ACE2. Frontiers in molecular biosciences, 7, 591873.
CrossRef - Xu, D., Tsai, C. J., &Nussinov, R. (1997). Hydrogen bonds and salt bridges across protein-protein interfaces. Protein Engineering Design and Selection, 10(9), 999–1012. doi:10.1093/protein/10.9.999
CrossRef - Xue, L. C., Dobbs, D., &Honavar, V. (2011). HomPPI: A class of sequence homology based protein-protein interface prediction methods. BMC Bioinformatics, 12(1), 244. doi:10.1186/1471-2105-12-244
CrossRef - Ye, T., Zhong, Z., García-Sastre, A., Schotsaert, M., & De Geest, B. G. (2020). Current Status of COVID-19 (Pre)Clinical Vaccine Development.AngewandteChemie (International ed. in English), 59(43), 18885–18897. org/10.1002/anie.202008319
CrossRef - Yang D. (2021). Application of Nanotechnology in the COVID-19 Pandemic. International journal of nanomedicine, 16, 623–649. org/10.2147/IJN.S296383
CrossRef - Yang, Y., & Gong, X. (2018). A new probability method to understand protein–protein interface formation mechanism at amino acid level. Journal of Theoretical Biology, 436, 18–25. doi:10.1016/j.jtbi.2017. 09.026
CrossRef - Zhanhua, C., Gan, J. G., Lei, L., Mathura, V. S., Sakharkar, M. K., & Kangueane, P. (2005). Protein subunit interfaces: Heterodimers versus homodimers. Bioinformation, 1(2), 28–39. doi:10.6026/97320630001028
CrossRef

