
Manuscript accepted on :08-08-2021
Published online on: 28-09-2021
Plagiarism Check: Yes
Reviewed by: Dr. Yasodha Thirumal

Second Review by: Dr. Kalil Alhadidy
Final Approval by: Dr. Ayush Dogra
Gilberto Flores-Vargas1, Nicolás Padilla-Raygoza1*, Efraín Navarro-Olivos1, María de Jesús Gallardo-Luna1, Elia Lara-Lona2 Francisco J. Magos-Vázquez3 Daniel Alberto Díaz-Martínez3
1Department of Research and Technological Development, Teaching and Research Directorate, Institute of Public Health from Guanajuato State.Victor Cervera Pacheco 14 Primer Piso Plaza Santa Fé Guanajuato, Gto. Mexico CP36250
2Department of Medicine and Nutrition, Division of Health Sciences, Campus Leon, University of Guanajuato, León, Guanajuato, México CP37670
3Directorate of Health Services, Institute of Public Health from Guanajuato State, Guanajuato, Guanajuato, Mexico CP36000
Corresponding Author E-mail: npadillar@guanajuato.gob.mx
DOI : https://dx.doi.org/10.13005/bpj/2238
Abstract
Background. Due to the Coronavirus Disease 2019 (COVID-19), some social sectors were affected;one of them is girls and women, and it is feared some inequalities may worse. Objective. To analyze pneumonia, hospitalizations, and fatality among confirmed cases of COVID-19, by the state of residence, in Mexican women under 19 years. Methods. A quantitative, ecological, comparative, and retrolective study was designed. The study population was female patients under 19 years whose data was available from the Mexican open National Epidemiological Surveillance System database up to March 31, 2021. For each Mexican state and at the national level, the proportion of pneumonia, hospitalized, and Case Fatality Ratio (CFR) among confirmed cases were calculated, besides descriptive statistics. The state with the lowest proportion of pneumonia, hospitalizations, and CFR was used as the baseline group to calculate Odds Ratio (ORs) and Attributable Fraction both in exposed and the population. The linear relationship between pneumonia cases proportion and hospitalizations with CFR was tested. Test results with p-values under .05 were considered statistically significant. Data analysis was performed in STATA 13.0 ® (Stata Corp., College Station, TX, USA). Results. The number of registries analyzed was 48,091. Attributable Fractions were above 0.7 for most states. Most ORs were high and statistically significant. The correlation between hospitalization proportion, pneumonia proportion, and CFR was high. High values for the Attributable Fractions and ORs were observed among states from the Mexican coastlines. Conclusion. Level and quality of attention vary across states, which was observed through the values of Attributable Fractions and ORs. Although women under 19 years seem to be mildly affected by COVID-19 in clinical regard, the socioeconomic effects of the pandemic in this sector must be studied and addressed. The sharing of strategies among states may benefit the attention of the COVID-19 emergency is a primary goal.
Keywords
COVID-19; Pneumonia; Lethality; SARS-CoV-2; Women
Download this article as:| Copy the following to cite this article: Vargas G. F, Raygoza N. P, Olivos E. N, Luna M. D. J. G, Lona E. L, Vázquez F. J. M, Martínez D. A. D. Analysis of Pneumonia, Hospitalization, and Fatality Among COVID-19 Cases by Mexican States in Women Under 19 Years: An Ecological Study. Biomed Pharmacol J 2021;14(3) |
| Copy the following to cite this URL: Vargas G. F, Raygoza N. P, Olivos E. N, Luna M. D. J. G, Lona E. L, Vázquez F. J. M, Martínez D. A. D. Analysis of Pneumonia, Hospitalization, and Fatality Among COVID-19 Cases by Mexican States in Women Under 19 Years: An Ecological Study. Biomed Pharmacol J 2021;14(3). Available from: https://bit.ly/3m4QdJ2 |
Introduction
Since the first report of pneumonia cases in Wuhan, China, in December 2019 1, and until February 6, 2020, only nine corresponded to children under one year 2. In contrast to Mexican population up to 50 years old,children have a lower frequency and less severe COVID- 19 3. According to the Centers for Disease Control and Prevention (CDC) in the United States, children under one year of age are more prone to severe COVID-19 4.
The severity of COVID-19 may be due to the following reasons: endothelium damage by increasing age, changes in coagulation function and the distribution of angiotensin-converting enzyme 2 (ACE-2) receptors, antibodies pre-existing anti-SARS-CoV-2, effects of chronic cytomegalovirus infection, presence of co-morbidities considered high risk for severe and death by COVID-19, and low levels of vitamin D. Most of these factors occur with higher frequency in adulthood that in childhood 3.
In Mexico, from 45,032 confirmed cases of COVID-19 up to May 15, 2020, 4,612 corresponded to children under 12 years of age [5]. By July 31, 2020, 14,369 (3.39 %) confirmed COVID-19 cases were children [6].
The access level to health services in Mexico varies across states due to its high social, cultural, and geographic diversity, being the industrialization difference between the north and south of the country one of the main reasons 7, 8. Hence, the interest arises in analyze women under 19 years, affected by COVID-19 in each Mexican state, from an ecological design.Another reason is the fear declaration that women have less access to health services, and a gloomy outlook is present for girls and women in the world 9.
In the national context, the General Directorate of Epidemiology from the Mexican National Health Office publishes an anonymized version of the surveillance system database at a personal level 10, which, on the gender lens view, is a great advantage to understand the COVID-19 impact on focused groups 11.
With the above mentioned, this study aims to analyze pneumonia, hospitalizations, and fatality of confirmed cases of COVID-19 in women under 19 years of age in Mexico. For this purpose, we used the National Epidemiological Surveillance System database up to March 31, 2021 10.
Material and methods
The study design is quantitative, ecological, comparative, and retrolective.
The universe was the registries of suspected and confirmed cases of COVID-19 in the National Epidemiological Surveillance System from the General Directorate of Epidemiology (NESS/GDE) up to March 31, 2021 10.
The study population was female patients under 19 years whose data was available from the open NESS database.
The sampling scheme was by availability. All the records included up to the end of March 2021 were considered.
The registries for the analysis were the ones from female patients under 19 years of age with clinical data suggesting COVID-19, according to the operational definition of a viral respiratory disease suspected case: fever, cough, headache, or dyspnea (seriousness), accompanied by at least one of the following: myalgias, arthralgias, odynophagia, chills, chest pain, rhinorrhea, anosmia, dysgeusia, or conjunctivitis 12, and who underwent the test in Real-time Polymerase Chain Reaction (rRT-PCR) or SARS-CoV-2 antigen determination. The excluded cases were the ones that remained as suspected (registries without rRT-PCR results or SARS-CoV-2 antigen). The deleted entries were those with missing data.
The variables considered for the analysis were: age, state that registered the case, type of patient (who was classified as an outpatient or hospitalized), date of onset of symptoms, date of registration, date of death, if occurred, and diagnosis of pneumonia. After the approval by the Ethics Committee from the Salamanca General Hospital on April 28, 2021, the database was accessed 10.
Statistical analysis was descriptive for all variables. For inferential analysis, for each state and at the national level, the proportion of pneumonia cases, hospitalized cases, and Case Fatality Ratio (RFC) were calculated among confirmed cases. The state with the lowest proportion of pneumonia (Durango), hospitalizations (Mexico City), and fatality of cases (Mexico City) was used as baseline group to calculate Odds Ratio and Attributable Fraction in exposed and in the population.
Pearson’s r calculation, linear regression, t-test, the respective p values computation, and 95% CI were performed between cases of pneumonia and hospitalizations with CFR. In all cases, to assess the result’s statistical significance, the alpha level was set to .05. Data analysis was performed in STATA 13.0 ® (Stata Corp., College Station, TX, USA).
Results and Discussion
In the open database of the NESS/GDE, 48,091 records corresponded to women under 19 years of age throughout Mexico with positive rRT-PCR 10.
Figure 1 shows the Mexican states by Attributable Fraction in those exposed. The comparison was made against Durango state, which showed the lowest prevalence of pneumonia (0.71%) (Table 1).
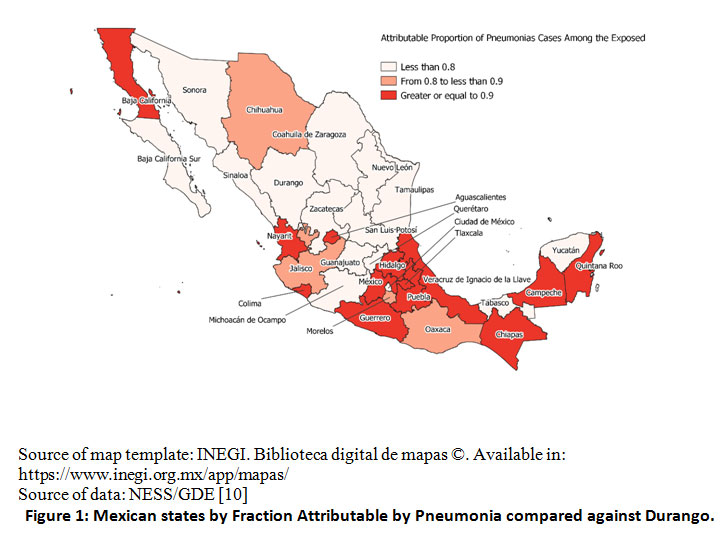 |
Figure 1: Mexican states by Fraction Attributable by Pneumonia compared against Durango. |
Table 1 shows the results of confirmed COVID-19 cases in women under 19 years who developed pneumonia. The national prevalence of pneumonia was 2.81%; the highest prevalence was observed in Veracruz with 13.77%, followed by Nayarit with 12.66% and Quintana Roo with 12.08%, and the lowest in Durango with 0.71%. The OR and attributable fractions were calculated using the Durango state as the baseline group. The ORs are statistically significant for most states, and the attributable fractions in the exposed are above 75%. For the Attributable Fractions in the population, the majority were higher in most of the states, around 60%.
Table 1: Distribution of COVID-19 confirmed cases with and without pneumoniae, Odds Ratio and attributable fractions
| COVID-19 cases confirmed | Pneumoniae in cases | Non-neumonía in cases | PPC | OR (IC95%) | AFe | AFp | |
| Aguascalientes | 301 | 21 | 280 | 7.00 | 10.45 (3.07 – 55.07) | 0.90 | 0.79 |
| Baja California | 497 | 40 | 457 | 8.05 | 12.20 (3.83 – 61.96) | 0.92 | 0.85 |
| Baja California Sur | 521 | 7 | 514 | 1.34 | 1.90 (0.43 – 11.43) | 0.47 | 0.33 |
| Campeche | 124 | 8 | 116 | 6.45 | 9.61 (2.25 – 56.81) | 0.90 | 0.65 |
| Coahuila | 1,159 | 23 | 1136 | 1.98 | 2.82 (0.85 – 14.74) | 0.65 | 0.57 |
| Colima | 103 | 8 | 95 | 7.77 | 1.73 (2.73 – 69.45) | 0.91 | 0.67 |
| Chiapas | 101 | 9 | 92 | 8.91 | 13.63 (3.30 – 79.19) | 0.93 | 0.69 |
| Chihuahua | 548 | 29 | 519 | 5.29 | 7.79 (2.39 – 40.15) | 0.87 | 0.79 |
| CdMx | 21,487 | 236 | 21,251 | 1.10 | 1.55 (0.52 – 7.59) | 0.35 | 0.35 |
| Durango* | 421 | 3 | 418 | 0.71 | — | — | — |
| Guanajuato | 3,163 | 72 | 3091 | 2.28 | 3.25 (1.06 – 16.17) | 0.69 | 0.66 |
| Guerrero | 605 | 51 | 554 | 8.43 | 12.83 (4.10 – 64.59) | 0.92 | 0.87 |
| Hidalgo | 443 | 29 | 414 | 6.55 | 9.76 (2.99 – 50.35) | 0.90 | 0.81 |
| Jalisco | 782 | 31 | 751 | 3.96 | 5.75 (1.78 -29.54) | 0.83 | 0.75 |
| Edo de México | 4,085 | 291 | 3794 | 7.12 | 10.69 (3.59 – 52.33) | 0.91 | 0.90 |
| Michoacán | 717 | 16 | 701 | 2.23 | 3.18 (0.90 – 17.12) | 0.69 | 0.58 |
| Morelos | 285 | 15 | 270 | 5.26 | 7.74 (2.16 -41.99) | 0.87 | 0.73 |
| Nayarit | 79 | 10 | 69 | 12.66 | 20.19 (4.98 – 115.82) | 0.95 | 0.73 |
| Nuevo León | 1,862 | 42 | 1,820 | 2.26 | 3.21 (1.02 – 16.29) | 0.69 | 0.64 |
| Oaxaca | 793 | 43 | 750 | 5.42 | 7.99 (2.53 – 40.45) | 0.87 | 0.82 |
| Puebla | 1,106 | 78 | 1,106 | 7.05 | 9.83 (3.21 – 48.90) | 0.90 | 0.86 |
| Querétaro | 1,121 | 20 | 1,121 | 1.78 | 2.49 (0.73 – 13.12) | 0.60 | 0.52 |
| Quintana Roo | 240 | 29 | 211 | 12.08 | 19.15 (5.81 – 98.95) | 0.95 | 0.86 |
| San Luis Potosí | 1,071 | 21 | 1,050 | 1.96 | 2.79 (0.83 – 14.66) | 0.64 | 0.56 |
| Sinaloa | 461 | 34 | 427 | 7.38 | 1.31 (0.22 – 8.96) | 0.23 | 0.13 |
| Sonora | 1,428 | 20 | 1,408 | 1.40 | 1.98 (0.58 – 10.44) | 0.49 | 0.43 |
| Tabasco | 2,014 | 41 | 1,973 | 2.04 | 2.90 (0.92 – 14.68) | 0.65 | 0.61 |
| Tamaulipas | 679 | 14 | 665 | 2.06 | 2.93 (0.81 – 16.00) | 0.66 | 0.54 |
| Tlaxcala | 228 | 15 | 213 | 6.58 | 9.81 (2.72 – 53.26) | 0.90 | 0.75 |
| Veracruz | 443 | 61 | 382 | 13.77 | 22.25 (7.15 – 111.51) | 0.96 | 0.91 |
| Yucatán | 764 | 20 | 744 | 2.62 | 3.75 (1.10 – 19.78) | 0.73 | 0.64 |
| Zacatecas | 460 | 12 | 448 | 2.61 | 3.73 (1.00 -20.72) | 0.73 | 0.59 |
| Nacional | 48,091 | 1,349 | 46,742 | 2.81 | |||
* Basal; PPC Prevalence of Pneumoniae in Cases;AFe Attributable Fraction in exposed;
AFp Attributable Fraction in population; OR Odds Ratio
Source: NESS/GDE (10)
Figure 2 shows the correlation and linear relationship between cases of pneumonia and CFR in women under 19 years of age; there is a good correlation and a significant linear relationship, confirming a direct linear relationship between pneumonia and dying from COVID-19.
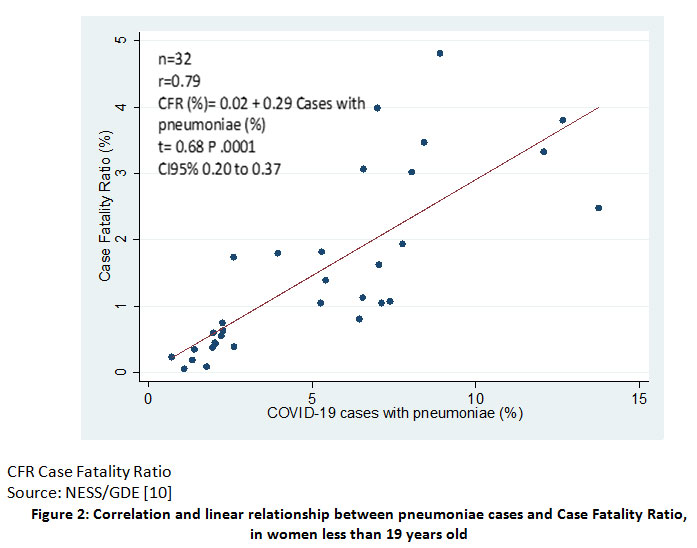 |
Figure 2: Correlation and linear relationship between pneumoniae cases and Case Fatality Ratio, in women less than 19 years old |
Figure 3 shows the AFe at the national level and in each Mexican state. The highest AFes are present in states from the North of Mexico (Chihuahua, Nuevo León) and the coastlines from the Pacific Ocean and the Gulf of Mexico.
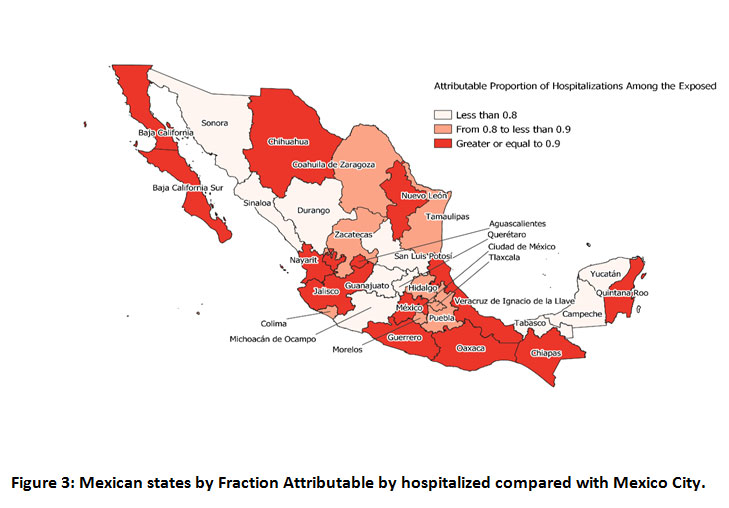 |
Figure 3: Mexican states by Fraction Attributable by hospitalized compared with Mexico City. |
Table 2 shows the confirmed cases of COVID-19 from the registries that required hospitalization. Chiapas had a hospitalization rate of 34.65%, which was the highest reported on March 31, 2021, while Mexico City was 1.43%, being the lowest. Mexico City was used as the baseline group for comparisons. The highest prevalence of hospitalizations was for Chiapas (South) with 34.65%, Nayarit with 30.38% (Pacific Ocean coastline), and Veracruz with 24.83% (Gulf of Mexico coastline), and the ORs of 36.47, 30.01, and 22.71, respectively. The AFes were similar for the three states: Chiapas with 97%,Nayarit with 97%, and Veracruz with 96%. The AFps were similar: 10% for Chiapas, 7% for Nayarit, and 8% for Veracruz.
Table 2: Distribution by Mexican State of COVID-19 confirmed cases with and without hospitalization, OR and Attributable Fractions
| COVID-19 confirmed cases | Hospitalized cases | Cases without hospitalization | PH | OR (IC 95%) | AFe | AFp | |
| Aguascalientes | 301 | 66 | 235 | 21.93 | 19.31 (14.14 – 26.11) | 0.95 | 0.17 |
| Baja California | 497 | 77 | 420 | 15.49 | 12.61 (9.51 – 16.55) | 0.95 | 16.55 |
| Baja California Sur | 521 | 10 | 511 | 1.92 | 1.35 (0.64 – 2.53) | 0.92 | 0.18 |
| Campeche | 124 | 6 | 118 | 4.84 | 3.50 (1.25 – 7.92) | 0.71 | 0.01 |
| Coahuila | 1.159 | 77 | 1,082 | 6.64 | 4.89 (3.73 – 6.35) | 0.80 | 0.16 |
| Colima | 103 | 9 | 94 | 8.74 | 6.58 (2.89 – 13.19) | 0.85 | 0.02 |
| Chiapas | 101 | 35 | 66 | 34.65 | 36.47 (23.09 – 56.67) | 0.97 | 0.10 |
| Chihuahua | 548 | 71 | 477 | 12.96 | 10.24 (7.67 -13.52) | 0.90 | 0.17 |
| CdMx* | 21,487 | 308 | 21,179 | 1.43 | — | — | — |
| Durango | 421 | 18 | 403 | 4.28 | 3.07 (1.78 – 5.00) | 0.67 | 0.04 |
| Guanajuato | 3,163 | 111 | 3,052 | 3.51 | 2.50 (1.99 -3.13) | 0.60 | 0.16 |
| Guerrero | 605 | 74 | 531 | 12.23 | 9.58 (7.23 – 12.58) | 0.90 | 0.17 |
| Hidalgo | 443 | 35 | 408 | 7.90 | 5.90 (3.98 – 8.51) | 0.83 | 0.08 |
| Jalisco | 782 | 103 | 679 | 13.17 | 10.43 (8.16 -13.26) | 0.90 | 0.23 |
| Edo de México | 4,085 | 508 | 3,577 | 12.44 | 9.77 (8.42 – 11.33) | 0.90 | 0.56 |
| Michoacán | 717 | 28 | 689 | 3.91 | 2.79 (1.81 – 4.16) | 0.64 | 0.05 |
| Morelos | 285 | 25 | 260 | 8.77 | 6.61 (4.14 – 10.16) | 0.85 | 0.06 |
| Nayarit | 79 | 24 | 55 | 30.38 | 30.01 (17.51 – 49.99) | 0.97 | 0.07 |
| Nuevo León | 1,862 | 306 | 1,556 | 16.43 | 13.52 (11.41 – 16.03) | 0.93 | 0.46 |
| Oaxaca | 793 | 161 | 632 | 20.30 | 17.52 (14.15 – 21.62) | 0.94 | 0.32 |
| Puebla | 1,106 | 103 | 1,003 | 9.31 | 7.06 (5.54 – 8.94) | 0.86 | 0.22 |
| Querétaro | 1,121 | 26 | 1,095 | 2.32 | 1.63 (1.05 – 2.45) | 0.39 | 0.03 |
| Quintana Roo | 240 | 39 | 201 | 16.25 | 13.34 (9.04 – 19.26) | 0.93 | 0.10 |
| San Luis Potosí | 1,071 | 60 | 1,011 | 5.60 | 4.08 (3.02 – 5.44) | 0.75 | 0.12 |
| Sinaloa | 461 | 65 | 396 | 14.10 | 2.26 (1.70 – 2.98) | 0.56 | 0.10 |
| Sonora | 1,428 | 34 | 1,394 | 2.38 | 1.68 (1.14 – 2.41) | 0.40 | 0.04 |
| Tabasco | 2,014 | 38 | 1,976 | 1.89 | 1.32 (0.92 – 1.86) | 0.24 | 0.03 |
| Tamaulipas | 679 | 64 | 615 | 9.43 | 7.16 (5.31 – 9.52) | 0.86 | 0.15 |
| Tlaxcala | 228 | 23 | 205 | 10.09 | 7.71 (4.71 – 12.10) | 0.87 | 0.06 |
| Veracruz | 443 | 110 | 333 | 24.83 | 22.71 (17.63 – 29.11) | 0.96 | 0.25 |
| Yucatán | 764 | 39 | 725 | 5.10 | 3.70 (2.56 – 5.22) | 0.73 | 0.08 |
| Zacatecas | 460 | 36 | 424 | 7.83 | 5.84 (3.96 – 8.39) | 0.83 | 0.09 |
| Nacional | 48,091 | 2,689 | 45,402 | 5.59 |
* Basal;PH Prevalence of hospitalization; AFe Attributable Fraction in exposed;AFp Attributable Fraction in population; OR Odds Ratio
Source: NESS/GDE [10]
Figure 4 shows a good correlation (r=0.82) between the proportion of hospitalized cases and CFR. Also, there is a linear relationship (P<.05) between the variables.
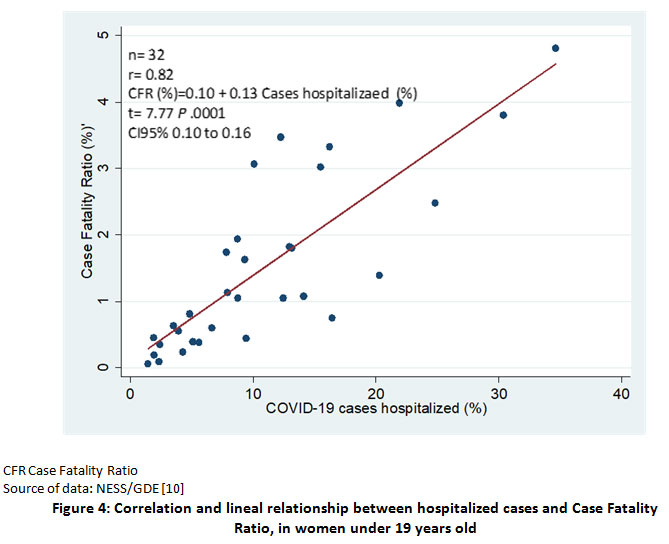 |
Figure 4: Correlation and lineal relationship between hospitalized cases and Case Fatality Ratio, in women under 19 years old |
The fatality of cases was 0.60% nationwide. The states with the highest CFRs were Chiapas (4.81%), Aguascalientes (3.99%), and Nayarit (3.80%). For the same states, the ORs were 86.03, 68.59, 65.20; the AFes 99%, 99%, and 98%; and the AFps 5%, 4%, and 4% (Table 3).
Table 3 shows the CFRs. The national one was 0.60%, the highest was in Chiapas with 4.81%, and the lowest was in Mexico City with 0.06%. The ORs are high, showing the effect of each state on the CFR, which corroborates the high AFe. On the other hand, the AFps are low in most states.
In most Mexican states, the peaks of pneumonia and those hospitalized by COVID-19 coincide with the highest peaks of CFR. The most notable are the states of Chiapas, Morelos, Nuevo León, Quintana Roo, Sinaloa, and Tlaxcala. Only Nuevo León and Sinaloa are in the North of Mexico, Morelos in the Center, and Quintana Roo, Chiapas, and Tlaxcala in the South.
Table 3: Distribution of cases confirmed by COVID-19, deaths, Ratio of Fatality of Cases, Odds Ratio and Attributable Fractions by Mexican State
| COVID-19 confirmed cases | Deaths of cases | Non deaths of cases | RFC | OR (CI95%) | AFe | AFp | |
| Aguascalientes | 301 | 12 | 289 | 3.99 | 68.59 (28.30 – 164.31) | 0.99 | 0.039 |
| Baja California | 497 | 15 | 482 | 3.02 | 51.41 (22.66 – 117.97) | 0.98 | 0.03 |
| Baja California Sur | 521 | 1 | 520 | 0.19 | 3.18 (0.07 – 21.22) | 0.69 | 0.0001 |
| Campeche | 124 | 1 | 123 | 0.81 | 13.43 (0.31 – 90.69) | 0.93 | 0.0007 |
| Coahuila | 1,159 | 7 | 1,152 | 0.60 | 10.04 (3.38 – 27.08) | 0.90 | 0.005 |
| Colima | 103 | 2 | 101 | 1.94 | 32.71 (3.54 – 147.17) | 0.97 | 0.02 |
| Chiapas | 104 | 5 | 96 | 4.81 | 86.03 (23.49 – 262.77) | 0.99 | 0.05 |
| Chihuahua | 548 | 10 | 538 | 1.82 | 30.70 (11.99 – 76.11) | 0.97 | 0.02 |
| CdMx* | 21,487 | 13 | 21,474 | 0.06 | — | — | — |
| Durango | 421 | 1 | 420 | 0.24 | 3.93 (0.09 – 26.30) | 0.75 | 0.002 |
| Guanajuato | 3,163 | 20 | 3,143 | 0.63 | 10.51 (4.97 – 23.01) | 0.90 | 0.006 |
| Guerrero | 605 | 21 | 584 | 3.47 | 59.40 (28.21 – 129.65) | 0.98 | 0.03 |
| Hidalgo | 443 | 5 | 438 | 1.13 | 18.86 (5.24 -56.71) | 0.95 | 0.01 |
| Jalisco | 782 | 14 | 768 | 1.80 | 30.11 (13.07 – 69.79) | 0.97 | 0.02 |
| Edo de México | 4,085 | 43 | 4,042 | 1.05 | 17.57 (9.26 – 35.65) | 0.94 | 0.01 |
| Michoacán | 717 | 4 | 713 | 0.56 | 9.27 (2.20 – 30.08) | 0.89 | 0.005 |
| Morelos | 285 | 3 | 282 | 1.05 | 17.57 (3.19 – 64.40) | 0.94 | 0.01 |
| Nayarit | 79 | 3 | 76 | 3.80 | 65.20 (11.66 – 243.46) | 0.98 | 0.04 |
| Nuevo León | 1,862 | 14 | 1,848 | 0.75 | 12.51 (5.45 – 28.95) | 0.92 | 0.006 |
| Oaxaca | 793 | 11 | 782 | 1.39 | 23.24 (9.39 – 56.36) | 0.96 | 0.01 |
| Puebla | 1,106 | 18 | 1,088 | 1.63 | 27.33 (12.62 – 60.80) | 0.96 | 0.02 |
| Querétaro | 1,121 | 1 | 1,120 | 0.09 | 1.47 (0.03 – 9.84) | 0.32 | 0.0003 |
| Quintana Roo | 240 | 8 | 232 | 3.33 | 56.96 (20.23 – 149.67) | 0.98 | 0.03 |
| San Luis Potosí | 1,071 | 4 | 1,067 | 0.38 | 6.19 (1.47 – 20.08) | 0.84 | 0.003 |
| Sinaloa | 461 | 5 | 456 | 1.08 | 18.11 (5.03 – 54.46) | 0.94 | 0.01 |
| Sonora | 1,428 | 5 | 1,423 | 0.35 | 5.80 (1.62 – 17.40) | 0.83 | 0.003 |
| Tabasco | 2,014 | 9 | 2,005 | 0.45 | 7.41 (2.76 – 18.77) | 0.87 | 0.004 |
| Tamaulipas | 679 | 3 | 676 | 0.44 | 7.33 (1.34 – 26.76) | 0.86 | 0.004 |
| Tlaxcala | 228 | 7 | 221 | 3.07 | 52.32 (17.47 -142.36) | 0.98 | 0.02 |
| Veracruz | 443 | 11 | 432 | 2.48 | 42.06 (16.94 -102.27) | 0.98 | 0.02 |
| Yucatán | 764 | 3 | 761 | 0.39 | 6.51 (1.19 – 23.76) | 0.85 | 0.003 |
| Zacatecas | 460 | 8 | 452 | 1.74 | 29.24 (10.44 -76.47) | 0.96 | 0.02 |
| Nacional | 48,091 | 287 | 47,804 | 0.60 | |||
Source: NESS/GDE [8]
In practically all the states of Mexico, the peaks of pneumonia and those hospitalized by COVID-19 coincide with the highest peaks of CFR. The most notable are the states of Chiapas, Morelos, Nuevo León, Quintana Roo, Sinaloa and Tlaxcala. Of these, only Nuevo León and Sinaloa are located in the North of Mexico, Morelos in the Center and Quintana Roo, Chiapas and Tlaxcala in the South.
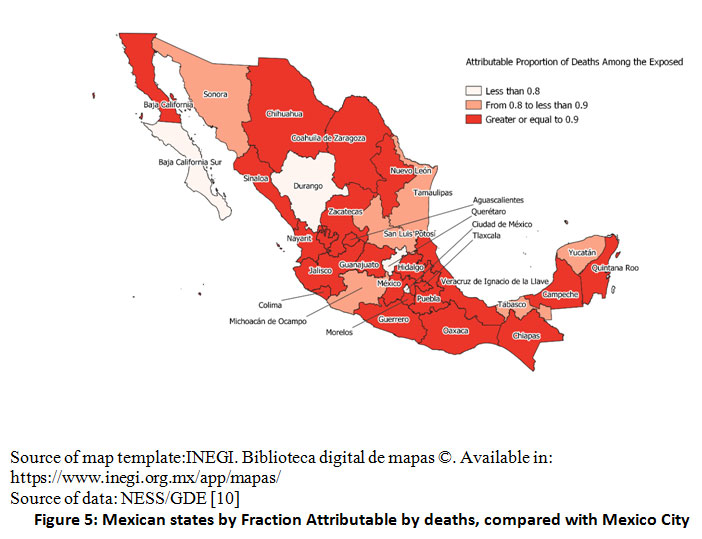 |
Figure 5 Mexican states by Fraction Attributable by deaths, compared with Mexico City |
In general, the prevalence curves for pneumonia, hospitalizations, and CFR coincide in the states with the highest prevalence of pneumonia and hospitalizations (Figure 6).
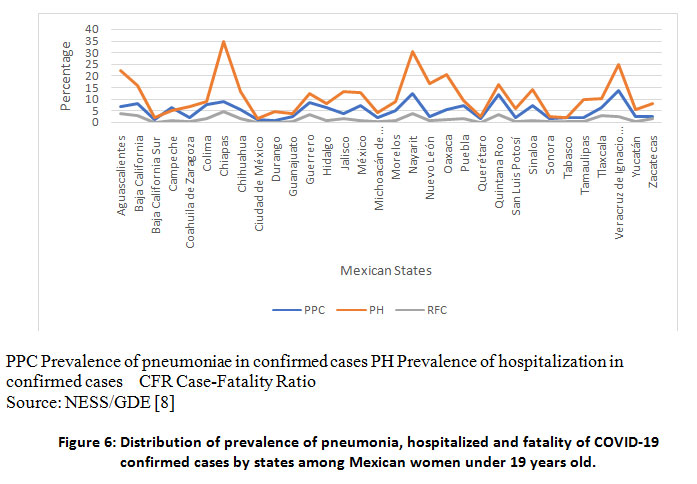 |
Figure 6 Distribution of prevalence of pneumonia, hospitalized and fatality of COVID-19 confirmed cases by states among Mexican women under 19 years old. |
The girls under 19 years of age positive for SARS-CoV-2, registered in the NESS/GDE up to March 31, 2021, were 48,091. For pneumonia, the states of central and southern Mexico had the highest AFe (> 0.9) (Fig 1), and the lowest prevalence (0.71%) was detected in Durango state, with only 3 cases, while the highest was in the state of Veracruz with 13.77% (Table 2). Also, it is detected that the higher the prevalence of pneumonia, the higher the CFR (r = 0.79, t = 0.68, P 0.0001) (Fig 2).
For the prevalence of hospitalizations due to COVID-19, it was higher in the southern states of Mexico and some northern states such as Baja California, Baja California Sur, Chihuahua, and Nuevo León (Fig 3); the lowest prevalence was in Mexico City with 1.43% and the highest in Nayarit with 30.38% (Table 2). A likely reason for these differences is the socioeconomic inequality across the Mexican states [7,8]. A good correlation and linear relationship were detected between number of hospitalizations and CFR (r = 0.82; t = 7.77, P = .0001) (Fig 4).
Regarding the CFR, the highest was in Aguascalientes state with 3.99%, and the lowest in Mexico City with 0.06%. (Table 3). Meanwhile, the AFes were higher than 0.9 for all states but Durango.
Oualha et al. (13) reported that among 27 children hospitalized for COVID-19, pneumonia was present in 17 (62.96%). Women predominated with 63%, and from five deaths, three fatalities from pneumonia were in women.
In Mexico, Rivas-Ruiz et al. (14) reported that from 1,443 confirmed cases of COVID-19, 141 (9.8%) developed pneumonia. In this analysis, pneumonia presented a RR of 53.1 (18.62 to 151.3) for predicting the risk of dying.
Camara et al. (15) studied 7,308 patients hospitalized for COVID-19, of which 189 were between 0 and 16 years old, women predominated (60.32%), and did not report severe cases.
The ORs comparing the figures for pneumonia cases in the Mexican states with the ones for Durango state, which reported the lowest prevalence (0.71%), show a high effect on having pneumonia living in those states, such as Quintana Roo (OR 12.08) and Nayarit (OR 12.66), and the AFe corroborates it. The impact of living in the other Mexican states is evidenced by the AFp, being the highest in Veracruz (0.91) and Mexico state (0.90), representing that 91% and 90% of pneumonia cases, respectively, could have been avoided if they had lived in Durango state (Table 1).
In Mexico, according to the suspected case of respiratory disease operational definition (9), only the symptomatic patients were tested for the presence of SARS-CoV-2 infection. It partially explains that the mortality in hospitalized girls in Mexico was 5.59%, while the fatality of COVID-19, at the national level, was 0.60%. Also, we see a big difference between the percentages of hospitalized in the states, from 1.46% in Mexico City to 21.93% in Aguascalientes (Table 2).
The differences between CFRs, AFes, and AFps, may be explained by the fact that each state has a health agency which, although linked to the Federal Health Secretariat, develops independent plans to improve health care for its inhabitants [16]. For example, Guanajuato state was the first entity to have a hospital exclusively for COVID-19 cases in March 2020. Also, socioeconomic conditions and educational level vary from state to state.
It is also shown in Figure 4 that there is a correlation (r = 0.82) and a linear relationship (P <.05) between the proportion of hospitalized girls with the CFR. A likely reason is that the ones considered for hospitalization were those with dyspnea or chest pain, altered blood pressure, high heart or respiratory rate, high body temperature, or O2 saturation, which were referred urgently to hospitals COVID 17. It follows that many of the fatal cases would return home for outpatient treatment and days later would become complicated and hospitalized in worse conditions.
The national CFR among COVID-19 cases corresponding to women under 19 years was 0.60%, and it varied among Mexican states. The lowest CFR being in Mexico City with 0.06%, meanwhile Chiapas showed the highest with 4.81% (Table 3). The overall CFR worldwide was 2.2%, and for Mexico, it was 9.07% 18.
The high ORs evidences the effect of dying by COVID-19 for living in each state. Nevertheless, the corresponding 95% confidence intervals are wide, which tells us the low precision of the data. The AFes show this effect, which all are above 90% but few (Table 3). On the other hand, the AFps show the impact of living in each state in death, compared with Mexico City. They were small, noting the effect of the state of residence on mortality (Table 3).
In general, the prevalence curves for pneumonia, hospitalizations, and CFR coincide in the states with the highest prevalence of pneumonia and hospitalizations.
Strengths
The sample size is large. Therefore, the results are reliable.
Limitations
As it is a database analysis, the results and data quality depend on the correct collection. At the state level, each team collects information and works together with the National Epidemiological Surveillance System.
The AFp could be subject to bias due to variations in the frequency of exposure in the population.
Conclusion
Level and quality of attention vary across states, which was observed through the values of Attributable Fractions and ORs. Although women under 19 years seem to be mildly affected by COVID-19 in clinical regard, the socioeconomic effects of the pandemic in this sector must be studied and addressed. The future in COVID-19 research could be in social aspects by the Mexican state.The sharing of strategies among states may benefit the attention of the COVID-19 emergency.
Conflict of Interest
The authors declare that the research was conducted in the absence of any commercial or financial relationships that could be construed as a potential conflict of interest.
Funding Sources
No funding source for this research.
References
- World Health Organization. Pneumonia of unknown cause – China (2020). Cited: May 17, 2021. Available in: https://www.who.int/csr/don/05-january-2020-pneumonia-of-unkown-cause-china/en/ [Accessed May 17, 2021]
- Hong H, Wang Y, Chung HT, Chen CJ. Clinical characteristics of novel coronavirus disease 2019 (COVID-19) in newborns, infants and children. Pediatrics and Neonatology (2020) 61(2): 131-132. Doi: https://doi.org/10.1016/j.pedneo.2020.03.001
CrossRef - Zimmermann P, Curtis N. Why is COVID-19 less severe in children? A review of the proposed mechanisms underlying the age-related difference in severity of SARS-CoV-2 infections. Arch Dis Child (2020) 106 (5): first published as https://doi.org/10.1136/archdischild-2020-320338
CrossRef - Centers Disease Control and Prevention. COVID-19 in Children and Teens (2021). https://www.cdc.gov/coronavirus/2019-ncov/daily-life-coping/children/symptoms.html [Accessed May 5, 2021]
- Padilla-Raygoza N, Sandoval-Salazar C, Diaz-Becerril LA, Beltran-Campos V, Diaz-Martinez DA, Navarro-Olivos, et al. Update of the evolution of SARS-CoV-2 infection, COVID_19, and mortality in Mexico until May 15, 2020: An ecological study. International Journal of TROPICAL DISEASE & Health (2020) 41(5): 36-45. Doi: https://doi.org/10.9734/IJTDH/2020/v41i/530277
CrossRef - Padilla-Raygoza N, Sandoval-Salazar C, Ramírez Gómez XS, Díaz-Becerril LA, Navarro-Olivos E, Gallardo-Luna MJ, et al. Status of disease by novel coronavirus and analysis of mortality in Mexico, until July 31, 2020. Journal of Medicine and Health Research (2020) 5(1):26-35. https://www.ikprress.org/index.php/JOMAHR/article/view/5483
- Colegio de México. Inequalities (2018). https://desigualdades.colmex.mx/inequalities2018 [Accessed June 22, 2021]
- Organization for Economic Co-operation Development. Measuring Well-Being in Mexican States (2021) https://www.oecd.org/regional/measuring-well-being-in-mexican-states-9789264246072-en.htm [Accessed June 22, 2021]
- Cousins S. COVID-19 has “devastating” effect on women and girls. The Lancet (2020) 396(10247):301-302. Doi: https://doi.org/10.1016/S0140-6736(20)31679-2
CrossRef - Dirección General de Epidemiología. Secretaría de Salud. Bases De Datos Abiertos Históricos 2021. 31 de marzo 2021 (2021) https://www.gob.mx/cms/uploads/attachment/file/634704/Datos_abiertos_historicos_2021.pdf [Accessed May 6, 2021]
- Gausman, J, Langer A. Sex and gender disparities in the COVID-19 pandemic. Journal of Women’s Health (2020) 29(4):465-466. Doi: https://doi.org/10.1089/jwh.2020.8472
CrossRef - Dirección General de Epidemiología. Secretaría de Salud. Comunicado Oficial. Actualización de la definición operacional de caso sospechoso de enfermedad respiratoria viral. 25 Agosto 2020 (2020) www.gob.mx/cms/uploads/attachment/file /573732/Comunicado_Oficial_DOC-sospechoso_ERV-240820.pdf [Accessed May 6, 2021]
- Oualha M, Bendavid M, Berteloot L, Corsia A, Lesage F, Vedrenne M, et al. Severe and fatal forms of COVID-19 in children. Archives de Pédiatrie (2020) 27: 235-238. Doi: https://10.1016/j.arcped.2020.05.010
CrossRef - Rivas-Ruiz R, Roy-García IA, Ureña-Wong KR, Aguilar-Ituarte F, Vázquez-de Anda GF, Gutiérrez-Castrellón P, et al. Factors associated with death in children with COVID-19 in Mexico, Gaceta Medica de Mexico (2020)156: 516-522. Doi: https://doi.org/10.24875/GMM.M21000478
CrossRef - Camara E, Barry IK, Diallo FB, Diallo ML, Diop MM, Cherif MS, et al. Profil épidémiologique et clinique des enfants atteins de la maladie á coronavirus (COVID-19) au Centre de Traitement des Epidémies et Prévention des infections (CTEPI) du CHU de Donka á Conakry. Pan Africam Medical Journal (2020) 37(363). Doi: https://dx.doi.org/10.11604%2Fpamj.2020.37.363.26211
CrossRef - World Health Organization. Regional Office for Europe, European Observatory on Health Systems and Policies, Miguel Á González Block, Hortensia Reyes Morales, Lucero Cahuana Hurtado. et al. (2020). Mexico: health system review. World Health Organization. Regional Office for Europe. https://apps.who.int/iris/handle/10665/334334 [Accessed July 21,2021]
- Organización Mundial de la Salud, Organización PanAmericana de la Salud, Secretaría de Salud. Flujograma de atención médica para COVID-19 en el primer nivel de atención (2020). https://coronavirus.gob.mx/wp-content/uploads/2020/04/ Flujograma_Atencion_Primer_Nivel_13042020.pdf [Cited June 21, 2021].
- Subsecretaria de Prevención y Promoción de la Salud. Informe técnico diario COVID-19 México 31 marzo 2021 (2021). https://www.gob.mx/cms/uploads/attachment/file/626491/Comunicado_Tecnico_Diario_COVID-19_2021.03.31.pdf [Accessed June 21, 2021]

