
Manuscript accepted on :05-07-2021
Published online on: 07-07-2021
Plagiarism Check: Yes
Reviewed by: Dr. Praveen Kumar D
Second Review by: Dr. Daniel Dias
Final Approval by: Dr. Alessandro Leite Cavalcanti
Karthik Raj. V1* , Tushar Sankaran J2, Soumya Samantaray2, Sayan Chakraborty2, Srishti Saxena2
1Department of Biomedical Engineering, Vel Tech Rangarajan Dr. Sagunthala R and D Institute of Science and Technology, Chennai, India, 600062.
2Department of Biomedical Engineering, SRM Institute of Science and Technology, Kattankulathur, India, 603203.
Corresponding Author E-mail: karthikhrajv@gmail.com
DOI : https://dx.doi.org/10.13005/bpj/2213
Abstract
Electrocardiograms (ECGs) are a method of assessment of cardiac electrical activity. It is the heart’s electrophysiological activity which occurs by the conduction of electrical impulses from the Sinoatrial (SA) node and the Atrioventricular (AV) node across the cardiac muscles and is displayed as a voltage-time graph. Conventionally, they have been acquired using a system of ten surface electrodes placed in different locations throughout the body in a 12-lead system. Single Arm ECG systems, where the ECG rhythm is obtained from only a single part of the body, replace the need for ten different electrodes to detect the heart's activity. Three pre-gelled electrodes are applied in different locations of the left arm to derive the sinus rhythm signal of a subject. An op-amp based hardware instrument has been developed for this purpose with active filters and amplifiers to perform signal conditioning. This paper demonstrates the implementation of a single arm hardware system of small size to improve portability, used as an ECG detection method and the results from various subjects taken at different gain values to improve the view of the signal, while also presenting a method to transmit the data of the signals wirelessly through an Internet-of-things (IoT) platform.
Keywords
Electrocardiograms; Internet-of-things; Lead system; Pregelled electrodes; Portability; Single-arm
Download this article as:| Copy the following to cite this article: Raj V. K, Sankaran J. T, Samantaray S, Chakraborty S, Saxena S. Design of a Wireless Single Arm Electrocardiograph System. Biomed Pharmacol J 2021;14(2). |
| Copy the following to cite this URL: Raj V. K, Sankaran J. T, Samantaray S, Chakraborty S, Saxena S. Design of a Wireless Single Arm Electrocardiograph System. Biomed Pharmacol J 2021;14(2). Available from: https://bit.ly/3wjQ9IF |
Introduction
Electrocardiogram (ECG) is a vital sign that gives an idea about the heart’s electrical activity. The electrical stimulus’s cardiac conduction path starts from the Sinoatrial (SA) node, the heart’s natural pacemaker, then goes to the Atrioventricular (AV) node, followed by the bundle of His and Purkinje fibers. A medical device that performs the operation of detecting and reproducing this activity is known as an electrocardiograph. It is a vital tool in medical diagnosis and is used to detect irregular heartbeats and more severe heart conditions such as ischemia. A regular ECG represents three occurrences: atrial depolarization, ventricular depolarization and ventricular repolarization. Each of these events corresponds to the P wave, QRS Complex and T wave respectively (shown in figure 1) in the ECG signal tracing.1 In some ECGs, there will be a U wave after the T wave, which represents repolarization of the Purkinje fibers.
Current electrocardiograph devices, having originated from the initial 3 Einthoven leads approach, now comprise of a 12-lead system that achieves its purpose through a total of ten electrodes divided into two sets of electrodes – limb and precordial. The conventional 12-lead ECG comprises of the Einthoven leads – I, II and III along with the augmented limb leads, aVR, aVL and aVF and precordial leads V1 through V6.1 Each of the electrodes is attached to the surface of the subject’s body and the devices are designed to show all 12 leads concurrently.
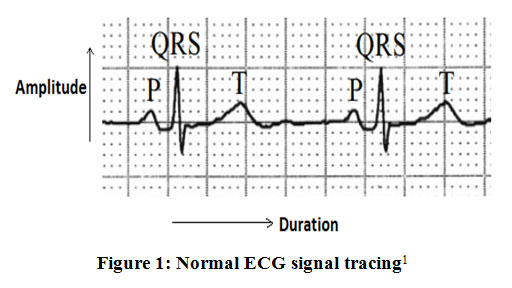 |
Figure 1: Normal ECG signal tracing1. |
Historically, the concept of ECG was introduced as far back as 1887 by Augustus D. Waller through a capillary electrometer designed by Thomas Goswell and was succeeded by Willem Einthoven.He coined the term ‘electrocardiogram’ in 1893 and further furnished the concept in 1902 with a measuring system utilizing a string galvanometer.2,3 Fast-forwarding to present-day research, the areas of focus are electrodes with new materials. ECG recording through dry electrodes is an actively pursued field of study. Soft materials, fabric and ceramic electrodes were found to increase electrode-to-skin interface contact, whereas copper and brass electrodes of suitable dimensions can transmit high-quality signals to the systems.4,5 Recently, a method of non-contact sensing was achieved using capacitive type electrodes and the effectiveness of fabric-based electrodes has been looked upon.6-8 Clinical signals in monitoring applications are of the frequency range of 0.5 Hz to 50 Hz.9 Another point of focus is the lead system. Three-electrode bipolar monitoring systems, where two electrodes form a lead while grounding the other, as well as other 5-lead, 10-lead and 12-lead systems such as Mason-Likar and EASI lead system, have been experimented.10,11The reduction of complexity is a crucial objective for future studies. Single-arm ECGs are instruments that localize the electrodes to an arm to take signal input. This is performed by placing a 3-electrode system, often one of the Einthoven leads, on specific arm locations such as proximal regions and far-field regions.5,12-18 As a result, potential sites on the arm are agreed upon to give an ECG output.
This paper focuses on single-arm ECG systems and presents signal acquisition hardware as a portable instrument. The instrument relies on a three pre-gelled electrode configuration that runs through a signal conditioning circuit with active filtering and amplification to produce a suitable output. When the data collected by an ECG is attempted to be transferred to a destination wirelessly, the concept is termed “Wireless single-arm ECG”. There can be many methods to do this. Certain researchers have employed the principles of radio frequency (RF) based communication.19 The concept was to use a RF transmitter on the system to send the signal and a RF receiver on a viewer such as an oscilloscope. This enabled the sending of data within a small range, wirelessly.
The future, however, points to the usage of the Internet and the world-wide-web (www). Thus, researchers are looking to use this convenient feature. One such possibility is using the concept of Internet-of-Things (IoT).20-24 Sending of ECG has been attempted using various IoT platforms. Recently a research paper discussed the assessment of a wearable arm-ECG sensor system for heart rhythm monitoring non-invasively.25In this paper, they used dry electrode such as Ag–AgCl electrode for picking the ECG from the arm region by designing the circuit in the bandwidth of 0.5 to 40 hertz to reduce motion artifact and ECG baseline instability problems.25 Here we discuss a method to wirelessly send ECG data that is acquired through a system designed for single-arm ECG procurement.
Materials and Methods
The ECG acquisition hardware was developed with active filtering and amplification, enabling signal conditioning of the input from the electrodes. Each sub-circuit part of the instrument will discuss in this section, along with their respective gain values. The output of the instrument may be visualized through an oscilloscope or computer interfaced software such as the National Instruments – Education Laboratory Virtual Instrumentation Suite (NI-ELVIS).
Block Diagram
Figure 2 shows a detailed block diagram of the implemented system, which has been designed using op-amps. The electrodes deliver the signal to their respective voltage follower circuits with unity gain. This part is vital as it avoids impedance mismatching. Each input electrode from the arm regionis assigned its own follower circuit, the outputs of which serve as differential inputs to the instrumentation amplifier. Here, the inputs are assigned as positive (+) input, negative (-) input and reference electrode with ground potential. The electrode’s location is positioned in the upper arm region and refers to the lead-2 configuration. The instrumentation amplifier is the circuit’s pre-amplifier stage, implemented to disregard the common noise signals from the differential inputs. It also increases signal strength by amplification. Here, a 100 Ω resistor placed as Rgof an AD620 IC chip achieves a gain of 495, which is shown in figure 3 in the instrumentation amplifier part. The AD620 is selected as the instrumentation amplifier’s chip as it has a favourably high Common Mode Rejection Ratio (CMRR).
A high pass filter succeeds the instrumentation amplifier and blocks signals below a set cut-off frequency. Here, a second-order Butter worth RC high pass filter has been implemented. This is necessary as noises due to movement often cause baseline wandering.25,26A high pass filter is solely responsible for eliminating such noise signals and is applied with a cut-off frequency of 2 Hz and gain value of 1.586. Therefore, the RC network at the op-amp’s positive input consists of two 8 kΩ resistors and two 10 µF capacitors, which are shown infigure 3 in the 2nd order high pass filter part. Specifically, a Butter worth filter is chosen due to its wide usage in biomedical applications and its feasibility of the design.
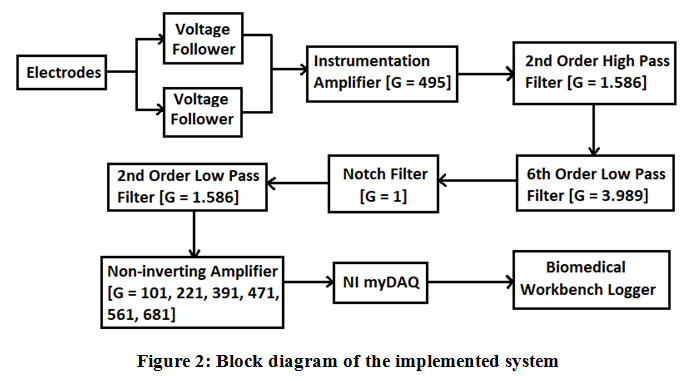 |
Figure 2: Block diagram of the implemented system. |
The next stage is the low pass filter, which allows a band of signals with frequencies below a set cut-off value. Three second-order RC Butterworth low pass filters effected in a cascaded form gives rise to a single sixth order low pass filter. Each second-order filter is designed to have a cut-off frequency of 40 Hz and a gain of 1.586. This is performed by applying two 39 kΩ resistors and two 0.1 µF capacitors in the op-amp’s positive input, which is shown in figure 3 in the low pass filter part. Therefore, a gain of 3.989 is obtained in the 6th order low pass filter.
A notch filter is a variation of a band-reject filter that blocks a select band of frequencies. Specifically, notch filters have a very narrow width stopband, which eliminates while allowing the remainder to pass in its passband. In electronic applications, a power line interference signal ranging from 50 to 60 Hz is often shown when using an AC supply voltage. This noise often distorts the signal and is deemed unnecessary. In the instrument designed here, a Twin-T unity gain notch filter with a centre of frequency of 50 Hz performs this necessary removal of the signal. It takes its input from the 6th order low pass filter and drives it through the Twin-T circuit.
Fifty-hertz centre frequency is applied by fixing the two upper T network capacitors at 0.047 µF and the two lower T network resistors at 68 kΩ, which is shown in figure 3 in the notch filter part. This allows the centre resistor, which is half of 68 kΩ resistors, to take the value of 34 kΩ and centre capacitor to take the approximated value of 0.1 µF, that is, double the value of upper T network capacitors. The notch filter delivers its output to another 2nd order low pass filter of cut-off frequency 40 Hz and a gain of 1.586, the same as that of the previous stage 2nd order low pass filters.
This allows a total gain of 4965.34 until the final stage. The final stage is a variable gain Non-inverting amplifier with an input resistance of 1 kΩ and a variable feedback resistor. It delivers gain values of 101, 221, 391, 471, 561 and 681 of its own using feedback resistors of 100 kΩ, 220 kΩ, 390 kΩ, 470 kΩ, 560 kΩ and 680 kΩ. Thus, when combined with the previous stages, they offer a high amplification factor. The consolidated circuit diagram is shown in figure 3.
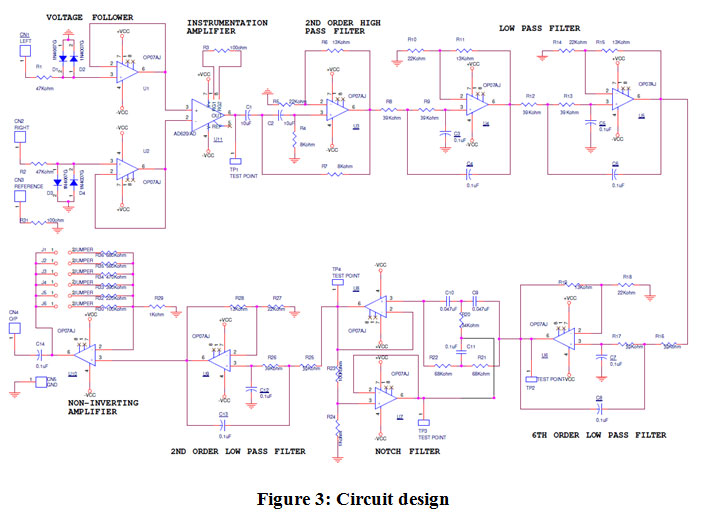 |
Figure 3: Circuit design. |
NI-ELVIS and Biomedical Workbench
The output is fed to a NI-Educational Laboratory Virtual Instrumentation Suite (ELVIS) system. This academic engineering platform combines various virtual instruments and directly interfaces them with hardware-oriented circuits. It is controlled by a computer and uses a digital signal logger to view and record the signals using special software called Biomedical Workbench used with Laboratory Virtual Instrumentation Engineering Workbench (LabVIEW) software. The ELVIS kit is used to activate the instrument by its variable power supply feature. Here a dual supply of ±9V is used to drive each section of the circuit. In the Biomedical Workbench, the Biosignal Logger and Player (shown in figure 4 as red circled) is used to visualize the output signals and also to store a set of real-time signals for a set duration.
 |
Figure 4: Biomedical Workbench home console. |
Electrode Placement and Subject Positioning
Three pre-gelled disposable electrodes are used to acquire the ECG. The electrodes are positioned such that the negative electrode is placed 2 cm below the armpit on the right side of the left arm, the positive electrode is placed diametrically opposite on the left side of the left arm such that the two electrodes form a straight line.5 In perpendicular direction to the mid-point of the line, the reference electrode is placed 7.5 cm to 9 cm below. This distance perspective is also attested in researches.5 Figure 5 shows the positioning of electrodes as detailed.
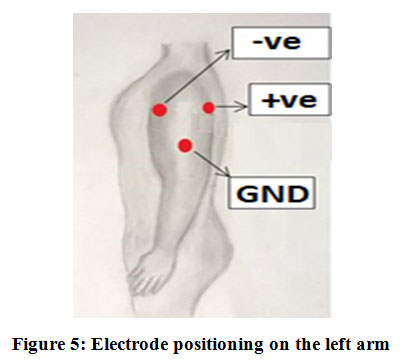 |
Figure 5: Electrode positioning on the left arm. |
The electrodes are attached to the subject by seating him/her in a relaxed position. The back is allowed to relax and lean on the backrest and the shoulders and arms are kept relaxed to avoid any tension or stretching of the arm muscles. To facilitate this, the hands are allowed to rest on the armrest or the lap. This is done to minimize the amount of electromyogram (EMG) signal that mixes with the ECG as the electrodes are attached to an active muscle and any movement would trigger an EMG input.Figure 6 shows an example of the electrode placement on a live subject.
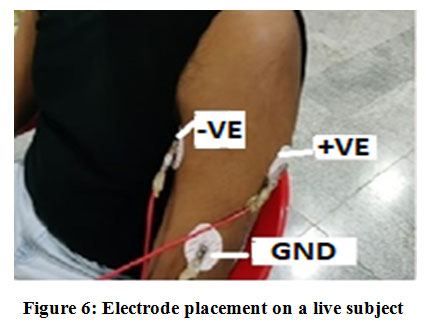 |
Figure 6: Electrode placement on a live subject. |
ESP8266
The ESP8266 Wi-Fi Module is a self-contained system on a chip (SOC). It has an integrated TCP/IP protocol stack and is extremely cost-effective board that can give a microcontroller of any kindaccess to Wi-Fi networks. The ESP8266 is capable of both hosting any application or offloading Wi-Fi networking functions from a different application processor. It comes with an AT command set firmware pre-programmed into it, which can be easily hooked to the Arduino device, adding Wi-Fi capability to the Arduino.
It uses 802.11 b or g or n protocol with Wi-Fi 2.4 GHz, supporting WPA or WPA2 security protocols and integrated low power 32-bit MCU, packed into a diminished footprint (11.5 x 11.5 mm). This module has an on-board processing and storage capability powerful enough tobe integrated with the sensors and other application-specific devices through its General-Purpose Input Outputs (GPIOs) with minimal development up-front and minimal loading during runtime. The module top view is displayed in figure 7.
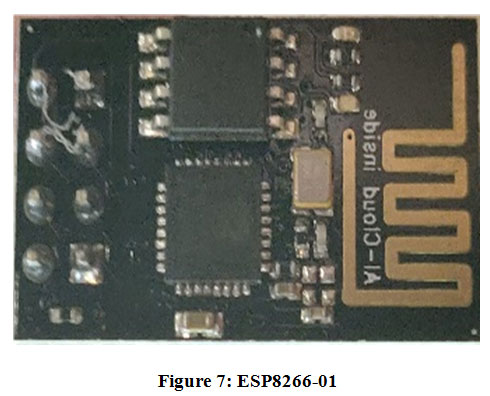 |
Figure 7: ESP8266-01. |
Thing Speak IoT
Thing Speak is a popular IoT analytics platform service that permits us to aggregate, visualize, and analyse live data streams in the cloud. We can send data to Thing Speak from our devices, thus creating instant visualizations of live data or historical sensor data, configuring devices to send data using a REST API or MQTT, aggregating data on-demand from devices, pre-processing and analysing collected data using integrated MATLAB, and send alerts using web services. Thing Speak supports researchers to prototype and build IoT systems without having to set up servers or developing web-based software and is hence considered to be the most advantageous open-source IoT-based analytical platform. A channel with no data stored in it resembles the one shown in figure 8.
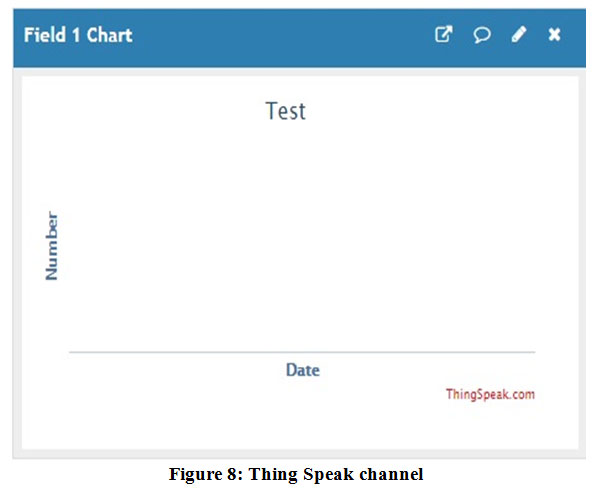 |
Figure 8: Thing Speak channel. |
Experimental Procedure
The first part of the project comes in the form of using the implemented system to detect the actual real-time ECG rhythm of a subject. For this purpose, the electrodes were placed on the subject as per figure 5 and the subject was allowed to rest at seat position. The setup was initialized and the output of the final stage amplifier is visualized in one of the physical channels offered by the NI-ELVIS device (maximum sample rate for a single channel in NI-ELVIS is 1.25 MS/s). Using the Biosignal Logger and Player function, the ECG rhythm was showcased in real-time and was stored in the form of .tdms files, a data file saved in the NI Technical Data Management Streaming (TDMS) format.
The MCU receives the signals offered by the designed ECG sensor and shapes it properly for transmission. The Wireless module performs the concrete heavy lifting as it transmits the data to the IoT platform via the cloud. The data can then be visualized using a web browser on a computer or a smartphone. The operating algorithm of the IoT transmission is depicted in figure 9.
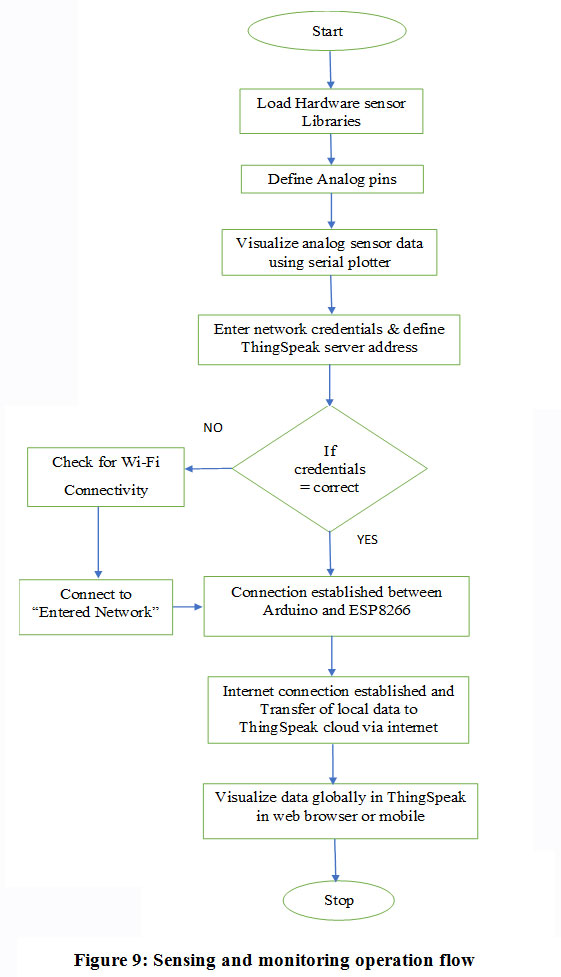 |
Figure 9: Sensing and monitoring operation flow. |
Results and Discussion
Results
Since the design was found to achieve a clear ECG signal with well-shaped wave forms, the circuit was miniaturized to a two-layer printed circuit board (PCB) of size 87 x 69 mm (l x b) using the same type of components used to design the initial circuit. Figure 10 shows a top view of the final printed circuit board for the single-arm ECG system.
 |
Figure 10: PCB of the single arm ECG sensor. |
The ECG signals were obtained from healthy subjects with a total of six different gain values in the final amplifier stage. Depending upon the strength of the signal that was given out by a subject, a diagnostician may decide on any gain value necessary. Figure 11 represents the signal outputs at gain values of 101, 221, 391, 471, 561 and 681. Each of these signals was visualized using the Biosignal Logger and Player function of the Biomedical Workbench software.
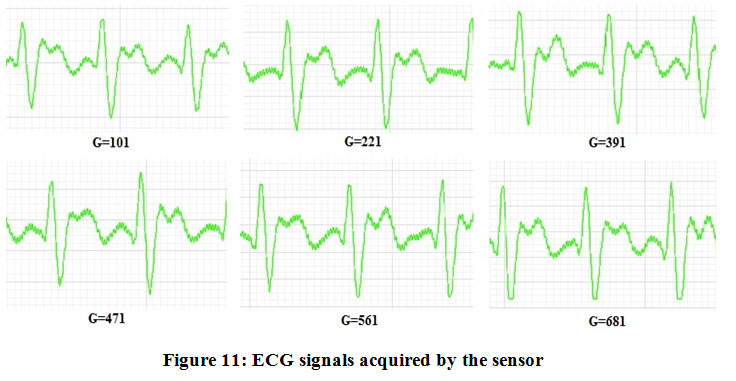 |
Figure 11: ECG signals acquired by the sensor. |
All the signals were obtained by keeping the subject into a seated and relaxed position. Any subject movement caused an introduction of unwanted transients that disturbed the flow of the acquisition. It can be observed from figure 11 that the waveforms obtained by the system are shown to have a well-defined QRS complex as well as an undisturbed view of the T wave. The gain values from which the signal takes proper form and shape may vary from subject to subject. Each of these signals was achieved from a total of 20 subjects under normal laboratory conditions as per the above positioning requirements. The heart rate values of each subject were calculated using the formula 60/(RR interval). For the RR interval, the time gap in seconds between two consecutive QRS complexes was taken. The resultant value is the heart rate in beats per minute (bpm). The values of the heart rate that were drawn out of these results lie between the normal ranges of 65-90 and are displayed in figure 12.
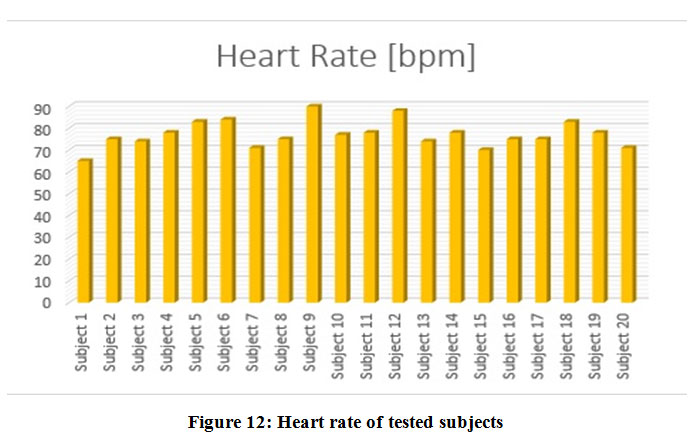 |
Figure 12: Heart rate of tested subjects. |
The IoT transmission involved sending the ECG data through the ESP8266 module. This data was plotted on the ThingSpeak platform to result in the ECG waveform shape being replicated in the platform. Figure 13 shows the ThingSpeak chart from the channel the data was collected in. The same channel may be viewed in third-party mobile applications such as ThingView (figure 14).
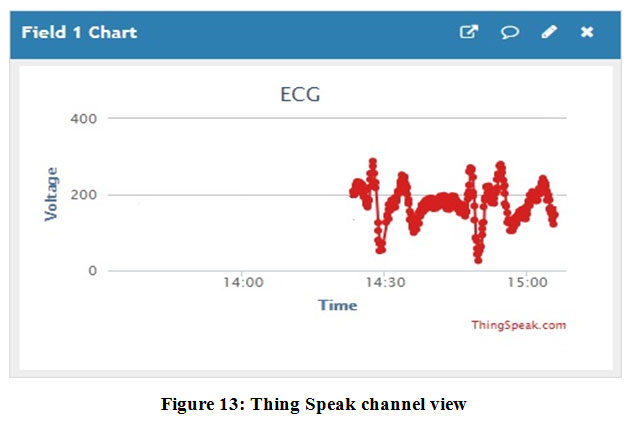 |
Figure 13: Thing Speak channel view. |
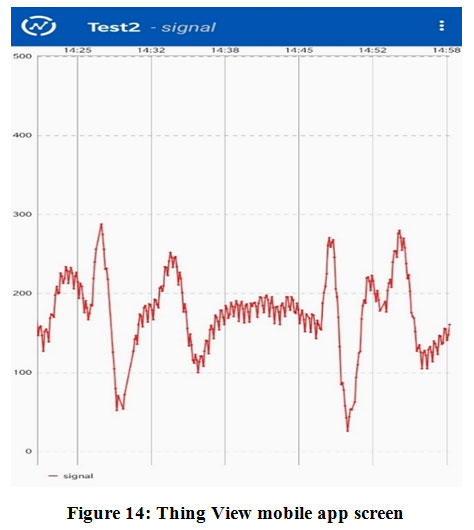 |
Figure 14: Thing View mobile app screen. |
The designed system yielded good ECG signals with a well-defined waveform shape. The signal helps to identify the existence of the QRS complex and the T wave in the signal. A similar type of signal was achieved in all of the 20 subjects, which tells us that the system construction is stable and does not deviate from its activity. This goes on to confirm that the applied electrode configuration works well enough to obtain the signal from a patient’s left arm using electrodes positive, negative and reference (GND) as shown in figure5.5,16 The lowest gain value that displays a visibly suitable output to the operator and user may vary from subject to subject. This may be due to less or more muscle mass in the arm, which maydecrease or increase in the diametric distance between the two active electrodes, that is, the placement of the electrodes on the arm region. Therefore, the gain must be adjusted from subject to subject. Also, the gain value should not be selected with the highest initially since it may clip the signal, so start with the low gain value till you get a suitable output.Discussion
However, the sensitivity to noise is still an important factor in the design. Any form of movement results in the introduction of a form of noise in the acquisition process. Any tension in the muscles surrounding the arm or the joints in the vicinity causes the introduction of an EMG signal as noise.20 Noise introduction is also caused by the electrode-skin interfaces and system power. Therefore, to deliver a good signal flow, the subject must be sitting perfectly still and more importantly, in a relaxed state. Doing so will allow a cleaner, undisrupted signal flow from the electrodes to the circuit. The pre-gelled disposable electrodes worked well for this procedure.
ECG data was successfully transferred via a wireless internet-based medium. While ECG systems based on wireless communications are available, they use setups like Bluetooth or radiofrequency (RF) transmitters and receivers or other more complex constructions such as Field Programmable Gate Arrays (FPGAs).27 This work uses the largely available resource of the internet to perform this action. Works based on IoT are slowly developing towards the stage where the signal shape could be exactly reproduced or viewed live directly on a wireless platform. As clearly shown in figure 13, the waveform maintains its shape and structure even in the wireless channel, thus giving a favourable outcome that an IoT-based application for sending signal data has been accomplished. As a platform, ThingSpeak offers a very durable option for IoT-based wireless transmission. Its ability to receive and display values is convenient and easily accessible and is often considered the first option for IoT projects and research.24 IoT-based kinds of research usually produce an output with a series of values sent wirelessly. This current research transmits the values taken directly from a real-time signal such that the line connecting the data points forms and replicates the shape of the ECG waveform, thus concluding the main objective of the work.
Conclusion
This experiment was desired to produce a system that allows the detection of an ECG rhythm from the left arm and to design a miniature version of the system for the sake of transportability and portability. Through this research, not only was a system designed and constructed in a small size, but it also enabled the collection of a signal with well-defined waveform shapes. By placing the negative electrode 2 cm below the armpit on the inner side of the arm, the positive electrode diametrically opposite on the outer side of the arm and finally placing a reference electrode 7.5 to 9 cm perpendicularly below from the centre point of the line joining the two active electrodes, it is made possible for the system to take its ECG input through these electrodes and run it through the signal conditioning circuitry. A miniature portable circuit ofsmall size (87 x 69 mm) was successfully constructed as a two-layer PCB which allows easier transportability to the user and allows easier access to an important health monitoring capability. Furthermore, the research’s final objective was to use the internet as a resource for data transmission. The method used was Internet-of-things (IoT). Through this medium, ECG data was stably pushed to the IoT platform, thus reproducing the signal while retaining the same waveform shape.
Acknowledgement
We want to thank the faculty and the Department of Biomedical Engineering, Vel Tech Rangarajan Dr.Sagunthala R & D Institute of Science and Technology, for their constant support, guidance and resources. We express our gratitude to SRM Institute of Science and Technology and Vel Tech Rangarajan Dr.Sagunthala R & D Institute of Science and Technology for providing the facilities and infrastructure needed for the performance of the research work.
Conflict of Interest
The authors of the paper declare that there is no conflict in interests whatsoever.
Financial Disclosure
The authors declare that no specific grant or funding from any agency in public, commercial, or non-profit sectors was received.
References
- Brent G Petty. Basic Electrocardiography. Springer, 2016.
CrossRef - George E Billman. Heartratevariability-ahistoricalperspective. Front Physiol., 2011; 2: 86.
- Einthoven W. The galvanometric registration of the human electrocardiogram, likewise a review of the use of the capillary-electrometer in physiology. Ann. Noninvas. Electro., 1997; 2: 93-98.
CrossRef - Meziane N, Webster J. G, Attari M, Nimunkar A. J. Dry electrodes for electrocardiography. Physiol. Meas., 2013; 34: R47-R69.
CrossRef - Karthik Raj V, Abdul K. N. J, Devapriya S, Gautham A, Uthvag S, Parveen S, Anand S, Hari Krishna M, Sara Ghosh, Srivishnuprasath Dry electrode material testing and gain analysis for single arm ECG system. Biomed. Eng. Appl. Basis. Commun., 2017; 29: 1750021-1-1750021-9.
CrossRef - Sérgio Gonçalves, Raul Carneiro Martins. Non-contact wearable single forearm cardiac biopotential acquisition device. Phys.: Conf. Ser., 2013; 459: 1-6.
CrossRef - AlperCömert, Honkala M, Puurtinen M, Perhonen M. The Suitability of Silver Yarn Electrodes for Mobile EKG Monitoring. 14th Nordic-Baltic Conference on Biomedical Engineering and Medical Physics. IFMBE Proceedings., 2008; 20: 198-201.
CrossRef - Betts R. P, Brown B. H. Method for recording electrocardiograms with dry electrodes applied to unprepared skin. Med. & biol. Engng., 1976; 14: 313-315.
CrossRef - Tompkins W. J, Webster J. G. Design of Microcomputer Based Medical Instrumentation. Prentice-Hall, 1981.
- Francis J. ECG monitoring leads and special leads. Indian Pacing Electrophysiol. J., 2016; 16: 92-95.
CrossRef - Dower G. E, Yakush A, Nazzal S. B, Jutzy R. E, Ruiz C. E. Deriving the 12-lead electrocardiogram from four (EASI) electrodes. J. Electrocardiol., 1988; 21 Suppl: S182-S187.
CrossRef - Lynn W. D, Escalona O. J, McEneaney D. J. Arm and wrist surface potential mapping for wearable ECG rhythm recording devices: A pilot clinical study. J. Phys.: Conf. Ser., 2013; 450: 1-8.
CrossRef
- Hannula M, Heikkinen P. Experimental determination of minimum distance between wrist and body electrodes in ECG measurement. Proceedings of 29th Conference of the Canadian Medical and Biological Engineering Society., 2006; Vancouver, Canada.
- Single arm ECG measurement using EPIC. Application note# 291491, plessey semiconductors.
- Weinan Li, Hao Zhang, Jiaxi Wan, Ye Li. A wearable exercise heart rate detection device based on single-arm ECG. International Conference on Biological Information and Biomedical Engineering., 2018; Shanghai, China, pp. 1-4.
- Escalona, O, Mcfrederick, L, BorgesM, Linares Herrera P, VillegasR,PerpiñanG, McLaughlinJ, MceneaneyD. Wrist and arm body surface bipolar ECG leads signal and sensor study for long-term rhythm monitoring. 2017 Computing in Cardiology (CinC)., 2017; Rennes, France, pp. 1-4.
CrossRef - Zhang Q, Zhou D, Zeng X. Highly wearable cuff‑less blood pressure and heart rate monitoring with single‑arm electrocardiogram and photoplethysmogram signals. BioMed. Eng. OnLine., 2017; 16: 23(1-20).
CrossRef - Acar G, Ozturk O, Yapici M. K. Wearable Graphene Nanotextile Embedded Smart Armband for Cardiac Monitoring. 2018 IEEE Sensors., 2018; New Delhi, pp. 1-4.
CrossRef - Sridhar Raja D. Wireless transmission of real time electrocardiogram (ECG) signals through radiofrequency (RF) waves. International Journal of Advanced Research in Electrical, Electronics and Instrumentation Engineering., 2013; 2: 793-798.
- Uttam D. U, Milan K. A. IoT based real time ECG monitoring system using Cypress WICED, International Journal of Advanced Research in Electrical, Electronics and Instrumentation Engineering., 2017; 6: 710-720.
- Kang K. An Adaptive Framework for Real-Time ECG Transmission in Mobile Environments. The Scientific World Journal, 2014; 2014: 1-12.
CrossRef - Sanghavi D. R, Athawale S. V. An IoT based low-cost ECG monitoring system for remote patient. International Journal for Research Trends and Innovation., 2018; 3: 70-77.
- Yang Z, Zhou Q, Lei L, Zheng K, Xiang W. An IoT-cloud Based Wearable ECG Monitoring System for Smart Healthcare. Med. Syst., 2016; 40: 286 (1-11).
CrossRef - Pasha S. Thingspeak based sensing and monitoring system for IoT with matlab analysis., International Journal of New Technology and Research., 2016; 2: 19-23.
- Villegas A, McEneaney D, Escalona O. Arm-ECG Wireless Sensor System for Wearable Long-Term Surveillance of Heart Arrhythmias., 2019; Electronics 8: 1300 (1-26).
CrossRef - Dhanaraj T, Umamaheswara Reddy G. Removal of baseline wandering in ECG signals using singular value decomposition. International Journal of Engineering Research and Applications., 2012; 2: 379-382.
- Yamagekar D, Bhaskar P. Real time ECG Monitoring: A Review. International Journal of Trend in Scientific Research and Development., 2017; 2: 1544-1549.
CrossRef

