
Manuscript accepted on :20-04-2021
Published online on: 03-05-2021
Plagiarism Check: Yes
Reviewed by: Dr. Elisabetta Liverani
Second Review by: Dr. Rajeshwari Nanaiah
Final Approval by: Dr. Anton R Kiselev
Roshni1, Ashok Prabhu K2 , Durga Rao Y1, Sowndarya K1 and Nandini M1*
1Department of Biochemistry, Kasturba Medical College Mangalore, Manipal Academy of Higher Education, Manipal, India-575004
2Department of Clinical Biochemistry, Kasturba Medical College Hospital, Ambedkar Circle, Mangalore -575001
Corresponding Author E-mail: nandini.m@manipal.edu
DOI : https://dx.doi.org/10.13005/bpj/2177
Abstract
Objective: Subclinical hypothyroidism(SCH)is a mild form of hypothyroidism where the TSH levels are slightly above the normal rangeand T3 & T4 values are within the normal limits.Oxidative stress caused by reactive oxygen species (ROS) causing an imbalance in the antioxidant/oxidant status of an individual is well recognized in hyperthyroidism & overt hypothyroidism but not in (SCH). Recently much attention is focussed on SCH, as it exhibits the same cardiovascular consequences as overt hypothyroidism. The current study evaluates the oxidative stress index (OSI) and the correlation of OSI with thyroid profile and Paraoxonase -1 (PON- 1), the antioxidant enzyme associated with HDL in subjects with subclinical hypothyroidism. OSI was calculated after measuring the total oxidant status (TOS) and total antioxidant status (TAS). This cross-sectional study included 64 subjects with sub-clinical hypothyroidism and 128 subjects with normal thyroid profile. Age of the subjects ranged between 25 and 75 years. Materials and methods: Serum levels of TAS, TOS and PON-1 was measured in the subjects whose thyroid profile was determined. OSI was calculated and differences between the variables in the two groups were analysed by the non-parametric tests. Correlation analysis was done by the spearman’s test. The diagnostic ability of OSI was assessed by ROC Curve. Results: Significant increase in the OSI and TOS was observed in subjects with SCH. There was no change in the antioxidant status as well as PON-1 activity.Conclusion: OSI can be considered as an efficient marker in the evaluation of oxidative stress.
Keywords
Oxidative Stress Index; PON-1; Subclinical Hypothyroidism
Download this article as:| Copy the following to cite this article: Roshni R, Prabhu K. A, Rao Y. D, Sowndarya K, Nandini M. Assessment of Oxidative Stress Index in Sub-clinical Hypothyroidism. Biomed Pharmacol J 2021;14(2). |
| Copy the following to cite this URL: Roshni R, Prabhu K. A, Rao Y. D, Sowndarya K, Nandini M. Assessment of Oxidative Stress Index in Sub-clinical Hypothyroidism. Biomed Pharmacol J 2021;14(2). Available from: https://bit.ly/3eaLYcg |
Introduction
Subclinical hypothyroidism(SCH)is a mild form of hypothyroidism where the TSH levels are slightly above the normal range and the thyroid hormones T3 & T4 are within the normal limits with few or no signs and symptoms of hypothyroidism. About 3- 15 % of the Indian population and about 4 -10 % of the western population have SCH.1, 2 Oxidative stress induced by reactive oxygen species (ROS) promotes an imbalance in the antioxidant/oxidant status of an individual and is indicated in the development of many chronic diseases such as cancer, arthritis, diabetes, etc. It is well acknowledged in hyperthyroidism & overt hypothyroidism 3, 4 but not in subclinical hypothyroidism (SCH). It is quite common for the condition to progress to full blown hypothyroidism. There are only a few studies on SCH reporting oxidative stress. The ubiquity in the population is affected by factors like TSH, cut-off to define SCH, race, sex, age, autoimmune thyroid disorders & intake of iodine.5 In recent times SCH has attracted more attention as it clearly manifests the similar cardiovascular outcome as in overt hypothyroidism.
Basal metabolic rate and oxidative metabolism are influenced by thyroid hormones and have a vital role in lipid and lipoprotein metabolism.6 Patients with hypothyroidism are at an increased risk of developing atherosclerosis7,8,9due to an increase in levels of low density lipoprotein cholesterol (LDL-C), total cholesterol (TC) as well as apolipoprotein B(apo B) and is well accepted. 10, 11 Thyroid hormones have a substantial influence on oxidative stress.12 The overproduction of ROS disturbs pro-oxidant /antioxidant balance leading to oxidative stress, and resulting in damage to lipids, proteins & DNA.13 Lipid peroxidation, a free radical chain reaction promotes the generation of (ROS) contributing to oxidative stress. Reports on the effect of lipid peroxidation in hypothyroidism are not equivocal.
Kebapcilar etal 14 have reported no significant changes in lipid peroxidation as compared to controls. Study of Dumitriu et al 15 have shown an increase in hypothyroidism. Elevated MDA levels have also been reported in subclinical hypothyroidism.16 Direct association between hypo and hyperthyroidism complications by reducing the activity of the antioxidant system components have been reported by Erdamar et al. 17These findings suggest that thyroid hormones have a strong effect on oxidative stress and antioxidant systems. Hence maintenance of adequate antioxidant levels is essential.
Serum paraoxonase 1 (PON1), an HDL associated enzyme capable of hydrolysing paraoxon and preventing lipid peroxidation, protects the LDL against peroxidation and is responsible for most of the antioxidant properties of HDL.18,19 Baskol et al 20 found increased plasma levels of malondialdehyde (MDA) and reduced activity of paraoxonase in patients with primary hypothyroidism. Diminished activity of PON1 was also seen in thyroid dysfunction.21 Amandeep Kaur et al 22 have reported a decrease in the antioxidant status in hypothyroid patients whereas no significant differences were shown in other studies.23
Depression of metabolism due to hypothyroidism has been reported to decrease the production of free radicals.24The depression of basal metabolism found in hypothyroidism is associated with decreased mitochondrial oxygen consumption and less generation of ROS resulting in decreased lipid peroxidation.25,26However studies have shown an increased production of ROS even in hypothyroidism.27. 28Thyroid hormones have a strong impact on the oxidative stress and the antioxidant system. Subclinical hypothyroidism often progresses to overt hypothyroidism which is associated with an increased risk of atherosclerosis. Data on the overall oxidant antioxidant status of patients with subclinical hypothyroidism are meager.Most of the studies have focussed on the individual antioxidants. Hence we proposed to study the oxidative stress index (OSI) by measuring the total antioxidant status (TAS), total oxidant status (TOS).
Materials and Methods
This was a cross-sectional study and was carried out at Kasturba Medical College, Mangalore Centre for Basic Sciences, Bejai.Institutional Ethical committee approval(IEC- KMC MLR 12-18/491) was obtained prior to the conduct of the study. The study included subjects visiting the Clinical Biochemistry Laboratory,KMC Hospital, Mangalore for routine check-up. 128 subjects with T3, T4 and TSH within the normal limits (T3-0.8-2ng/dl, T3-5.10-14.1µgm/dl, TSH-0.27-4.2µIU/ml) served as controls. 64 subjects with sub-clinical hypothyroidism (T, T4 values within the normal range and TSH levels between 4.5 to 10µIU/ml) formed the case group. The subjects were not under any medications.All subjects selected were in the age group of 25-75 years. Subjects with overt hypothyroidism, hyperthyroidism and subclinical hyperthyroidism and those subjects on treatment with thyroxine were excluded.
Sample collection
Fasting blood samples obtained from the above mentioned subjects were centrifuged at 3000 rpm for 10 minutes. Separated serum was used for the measurement of thyroid profile (T3, T4 &TSH) in COBAS 6000 auto analyser and Roche Diagnostic kits were used. The left over samples were stored at -20°C for a week. Assessment of TAS, TOS and paraoxonase were carried out in the stored samples.
Estimation of TOS was done by the method of Ozcan Erel 29.Oxidants present in the sample oxidise the ferrous ion-ortho-dianisidine complex to ferric ion. The ferric ion makes a coloured complex with xylenol orange in an acidic medium. The colour intensity is related to the total amount of oxidant molecules present in the sample andwas measured by a spectro. photometer and The oxidation reaction is enhanced by glycerol molecules, which are abundantly present in the reaction medium. . The assay is calibrated with Hydrogen peroxide and the results are expressed as micromoles of hydrogen peroxide equivalent per litre (µmolH₂O₂Equiv/L). Measurement of Total Anti-oxidant status was done by the method of Oscan Erel 30 which is based on the ability of the antioxidants in the sample to suppress the oxidation reaction and colour formation of standardized solution of Fe+2 –o- dianisidine .
Oxidative Stress Index (OSI) defined as the Ratio of TOS level to the TAS level was calculated as OSI= TOS (µmolH₂O₂Eq/L)/TAS (µmoltroloxEq/L).31
Estimation of Paraoxonase activity was done by the method of Beltowski et al.32 The activity was estimated spectrophotometrically using 5.5 mM 4-nitrophenyl phosphate as the substrate in 20mM Tris –HCl buffer at a pH of 8.0. The increase in absorbance due to the formation of 4 -nitrophenol was monitored at 410 nm for 3mins. Change in the absorbance per minute was calculated. One IU of paraoxonase activity is defined as µmol of p-nitro phenol formed per minute at 25⁰C.
Statistical Analysis
Statistical Analysis was carried out in SPSS version 20.0. Thyroid profile variables (T₃, T₄ and TSH) were analysed by Unpaired T-test (Mean ±SD) and the other parameters were analysed by Mann -Whitney U test and expressed as Median and inter-quartile range. Categorical variables were computed using chi-square test. Correlation analysis was done by Pearson’s or Spearman’s test. p<0.05 was considered significant.
Results
The demographic data of the subjects are shown in Table 1. There was no significant difference in age between the cases and controls. The control group had 40 males and 88 females while the Case group consisted of 15 males and 49 females.
Table 1: Demographic data of the subjects
| Variable | Controls(n=128) | Cases(n=64) |
| Age | 43.28±15.14 | 42.96±13.42 |
| Gender (male/female) | 40/88 | 15/49 |
Values are shown as Mean± Standard deviation. n= number of subjects
The values of thyroid profile, oxidant antioxidant status and paroxonase are given in Table 2.It is clearly seen that the levels of TSH are higher in subjects with subclinical hypothyroidism. Though a statistically significant increase in T4 & T3 levels is seen in controls, it is clinically not significant since the values are well within the normal range. parHighly significant increase in the TOS was seen while no significant change in the levels of TAS and paraoxonase activity was observed. Significant increase in the OSI was observed in the subjects with subclinical hypothyroidism. Figures 1, 2, 3, 4 depict the mean ± SD values of TAS, TOS, PON-1 and OSI obtained.
Table 2: Thyroid profile and oxidant /antioxidant levels
| Variables | Control (n=128) | Cases (n=64) | p value |
| T₃ (ng/dl) | 1.24±0.33
|
1.14±0.28 | 0.041 |
| T₄ (µg/dl) | 8.45±2.08 | 7.33±1.56 | <0.01 |
| TSH (µIU/ml) | 1.92±1.15 | 8.42±2.0 | <0.01 |
| TAS
(µmolTroloxEq/L) |
1365.90±121.81 | 1309.46±163.13 | 0.645 |
| TOS
(µmol H₂O₂Eq/L) |
46.42±3.82 | 72.21±5.99 | <0.01 |
| PON-1 (IU/L)
|
6.19±0.38 | 6.12±0.47 | 0.758 |
| OSI | 0.06±0.01 | 0.144±0.032 | <0.01
|
Values are expressed as Mean ± Standard deviation, n= number of subjects, p<0.05 was considered significant.
 |
Figure 1: Depicts the Mean values of TAS in controls and SCH groups. |
 |
Figure 2: depicts the Mean values of TOS in controls and SCH groups. |
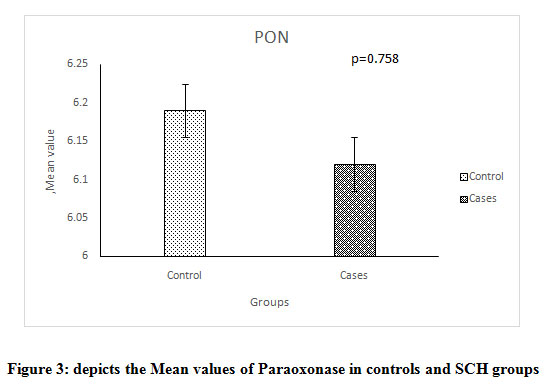 |
Figure 3: depicts the Mean values of Paraoxonase in controls and SCH groups. |
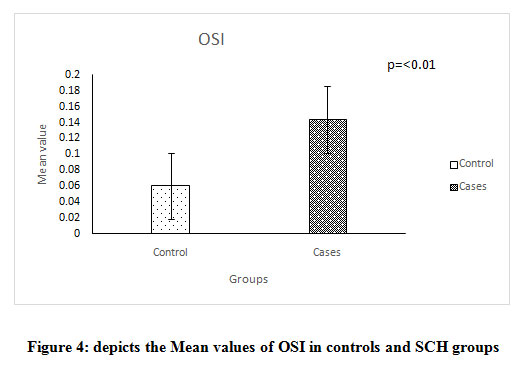 |
Figure 4: Depicts the Mean values of OSI in controls and SCH groups |
The values of the above mentioned parameters based on the levels of TSH in the control subjects (0.27- 2.5 & 2.5- 4.2 μIU/ml) and in the cases (4.2-7 & 7.1-10 μIU/ml) are presented in Table 3. No significant difference is seen in the values of TAS, TOS, OSI & PON-1 in the controls with TSH values < 2.5 and 2.5- 4.2 μIU/ml. Similarly no significant difference is seen in the subjects with TSH values < 7or 7 – 10 μIU/ml. Table 4 shows the correlation of thyroid profile & PON-1 with OSI in control and cases respectively.
Table 3: TSH grouping in controls and cases
| Controls | Cases |
|
||||
| Variables | 0.27-2.5 | 2.5-4.2 | p value | 4.2-7 | 7.1-10 | p value |
| TAS
(µmolTroloxEq/L) |
842.8
(979.55)
|
726.85
(773.65) |
0.97 | 1058.8
(1114) |
1125.0
(1290.1) |
0.67 |
| TOS
(µmolH₂O₂Eq/L) |
30.26 (43) |
32 (41)
|
0.84 |
48 (79.48) |
54.53 (90.0) |
0.96 |
|
OSI |
0.03 (0.05) |
0.03 (0.05)
|
0.90 |
0.05 (0.11) |
0.100 (0.11) |
0.72 |
|
PON-1 (IU/L) |
5.5 (4.8) |
4.92 (4.47) |
0.14
|
5 (5.83) |
5.54 (3.70) |
0.48 |
All values are expressed as median & inter quartile range; p<0.05 is considered significant.
Table 4: Correlation of clinical parameters with TAS, TOS & OSI in control and cases.
| Parameters | T₃ (ng/dl) | T₄ (µg/dl) | TSH (µIU/ml) | PON (IU/L) | |
| TAS
(µmolTroloxEq/L) |
Control | -0.024 | -0.021 | 0.086 | 0.107 |
| Cases | 0.010 | -0.014 | -0.094 | 0.025 | |
| TOS
(µmolH₂O₂Eq/L) |
Control | -0.017 | -0.021 | -0.031 | r=0.507**
p=(0.00) |
| Cases | -0.155 | -0.133 | -0.046 | -0.165 | |
| OSI | Control | 0.111 | 0.034 | -0.075 | r=0.175*
p=(0.049) |
| Cases | -0.088 | -0.155 | 0.113 | r=(-0.238)
p=(0.059) |
Correlation is significant when p=<0.05.Weak correlation: r=0.3-0.5, moderate correlation r=0.5-0.8, strong correlation r=0.8-1.
A positive correlation of Paraoxonase with TOS and OSI is seen in the control group ( r=0.507& r= 0.175) while a weak negative correlation of PON-1 with TOS and OSI in SCH subjects is seen (r=-0.165 and -0.238).
Table 5 shows the correlation of OSI with oxidant /antioxidant status and PON-1. Both the control and the test groups showed a negative correlation of OSI with TAS (p=0.001 and p=0.004) and a highly positive correlation with TOS ( p=0.000 and p=0.004). A positive association of OSI with PON-1 in controls while a weak negative association in SCH subjects is also observed (r = 0.175& r = -0.238. Table 6 shows the values of the AUC (Area under the curve ). The AUC for TOS and OSI was highly significant.(Fig 5)
Table 5: Correlation of OSI with TAS, TOS and Paraoxonase ( PON-1)
| OSI | TAS (µmolTroloxEq/L) | TOS (µmolH₂O₂Eq/L) | PON-1 (IU/L) |
| Control | r=(-0.295)**
p=0.001 |
r=0.514**
p=0.000 |
r=0.175*
p=0.049 |
| Test | r=(-0.356)**
p=0.004 |
r=0.574**
p=0.004 |
r=(-0.238)
p=0.059 |
Correlation is significant when p=<0.05.Weak correlation: r=0.3-0.5, moderate correlation r=0.5-0.8, strong correlation r=0.8-1.
Table 6: Characteristics of ROC curve.
|
Variables
|
Sensitivity | Specificity | AUC (confidence interval) | p value |
| TAS (µmolTroloxEq/L) | 70.3% | 32% | .520
(.432-.609) |
0.645 |
| TOS (µmolH₂O₂Eq/L) | 81.3% | 54% | .682
(.605-.759) |
0.000 |
|
OSI |
51.6% | 78% | .640
(.556-.725) |
0.002 |
|
PON-1(IU/L) |
42.0% | 60% | .514
(.428-.600) |
0.758 |
p<0.05 was considered significant.AUC-Area under the curve.
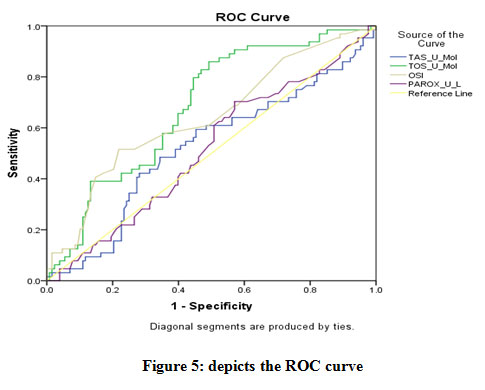 |
Figure 5: depicts the ROC curve. |
Discussion
Oxidative stress has an important role in the development of many chronic diseases. Prospective studies indicate the increased risk for cardio vascular mortality in patients with subclinical hypothyroidism (SCH). According to the present study there was no remarkable change in the total antioxidant status of SCH and control subjects. This finding is in agreement with the report of Torun et al and Cheserek et al.16, 33 Studies of Lakshmi et al and Joshi et al34,35 have reported a significant decrease in Total antioxidant capacity in hypothyroid patients. Bhimte et al have also opined that hypothyroidism resulted in a lowering of TAC.36The mean values of TAS observed in the control subjects in the present study is similar to the value reported by Jansen et al in Netherland males and the apparently healthy Chinese adults.However it appears to be lower as compared to the apparently healthy Chinese adults.37, 38 The values of TAS in SCH subjects were higher when compared to the value reported by Sivakanesan et al in thyroid dysfunction.38
The value of TOS observed in the control group is higher than the value of obtained by Erel et al30 in healthy subjects (46.42µmol/L vs 14.19±3.16µmol/L). This could be attributed to the quality of the chemicals used in the assay. A 1.5 fold increase in the Total Oxidant levels observed in the SCH subjects is highly significant. Thus measurement of oxidant status (TOS) appears to be a good marker of oxidative stress. The spectrophotometric method of Ozcan Erel used to measure TOS in the present study, is stable, reliable, sensitive and inexpensive with a linearty upto 200µmol H₂O₂/L.
There was no significant change in the activity of HDL associated PON-1 enzyme. The findings of our study agree with the report of Coria et al 23 who also did not observe any change in the activity of PON1 between overt hypothyroidism, subclinical hypothyroidism and euthyroidism. On the contrary Azizi et al21 have reported a significance reduction in PON1 activity in both hyper and hypothyroid patients. A positive correlation of paraoxonase with total oxidant status and OSI was observed in control subjects while a negative correlation only with OSI seen in subjects with subclinical hypothyroidism is an important finding suggesting the importance of measurement of PON-1 in evaluation of oxidative stress in SCH. A significant correlation of OSI values and severity of depression was found to be present in the study of Gupta et al.39 A similar finding was reported by Yanik et al.40Increase in the OSI in subjects with SCH indicates that calculation of OSI could be used as a screening test to measure the Oxidant/Anti-oxidant status. From the ROC curve it is evident that the AUC for TOS is the highest followed by OSI. Hence among the two, TOS can be considered as the best indicator for the assessment of oxidant and anti-oxidant status of an individual with subclinical hypothyroidism. Nevertheless it can certainly be used for evaluation of oxidative stress.
To summarize, the thyroid hormones are associated with the oxidative and anti-oxidative status of an individual. Subjects with SCH showed significant increase in oxidant status and oxidative stress index (OSI). There was no significant change in the antioxidant status as well the PON-1 activity in subjects with SCH .The method adapted for measurement of TAS and TOS was sensitive, reliable, and inexpensive which can be readily performed in the laboratory and can also be automated. Though serum concentrations of different oxidant species and antioxidant molecules can be measured in the laboratories they are time consuming, and involve complicated techniques.OSI, a recently investigated parameter is a proportional value between TAS and TOS. It is directly influenced by oxidant and antioxidant status which represents the degree of oxidative stress more clearly.
The result of the study highlights the importance of measurement of TOS as an important marker for the assessment of oxidative stress in subclinical hypothyroidism. In order to obtain a comprehensive understanding of the oxidative stress status of a subject, calculation of OSI is essential. Assessment of oxidant status would certainly aid the physician in the treatment.
Conclusion
Subclinical hypothyroidism relatively increases the oxidative stress as evidenced by the increase in TOS and Oxidative stress index (OSI). Thus both TOS and OSI can be considered as efficient markers of oxidative stress. TOS can certainly be used as a screening test for assessment of oxidative /antioxidative state of an individual with subclinical hypothyroidism. Neverthless OSI being a proportional value between TAS & TOS can represent the degree of oxidative stress more clearly and may be put into clinical use. The utility of the test is so great that but it can also be extended to other diseases which involve oxidative stress. Future studies with various cut off values of TSH with the clinical symptoms may improve its diagnostic performance.
Acknowledgement
The authors thank Manipal Academy of Higher Education, Manipal for the constant encouragement and Dr Vinodchandran, Clinical Biochemistry Department, KMCH AC, Mangalore for the cooperation in the process of sample collection.
Conflicts of Interest
The authors have no conflicts of interest.
Funding Sourse
There are no fund in this study.
References
- Ayala AR, Danese MD, Ladenson PW. When to treat mild hypothyroidism. Endocrinol Metab Clin N Am. 2000; 29(2): 399–415.
CrossRef - Razvi S, Shakoor A, Vanderpump M, Weaver J. U, and Pearce S.H.S. The influence of age on the relationship between subclinical hypothyroidism and ischemic heart disease:a meta-analysis. J Clin Endocrinol Metab.2004; 93(8): 2998–3007.
CrossRef - Ali A, Sultan P. The Effects of Hyperthyroidism on Lipid Peroxidation, Erythrocyte Glutathione and Glutathione Peroxidase. J of Med Biochem. 2011; 30(1): 11-14.
CrossRef - Santi A, Duarte M, Moresco R, Menezes C, Bagatini M, Schetinger M et al. Association between thyroid hormones, lipids and oxidative stress biomarkers in overt hypothyroidism. Clin Chem Lab Med. 2010 ; 48(11): 1635-39.
CrossRef - Biondi B, Cooper DS. The clinical significance of sub-clinical thyroid dysfunction. Endor Rev.2008; 29(1):76-131.
CrossRef - Aviram M, Lubushitzky R., Brook J.G. Lipid and lipoprotein pattern in thyroid dysfunction and the effect of therapy. Clin.Biochem.1982;15(1):62–6.
CrossRef - Tan K C, ShiuS W, Kung A.W. Plasma cholesterol ester transfer protein activity in hyper- and hypothoidism. J.Clin.Endocrinol.Metab.1998;83(1): 140-3.
CrossRef - Ozata M, Yildirimkaya M, Yilmaz K, Kutluay T, Corakci A, Beyhan Z et al.The effects of thyroid status on serum apolipoprotein A-I containing lipoprotein partiles. Horm Metab Res.1998;30(4):217-21.
CrossRef - Packard C.J.Shephard J. Physiology of lipoprotein transport system: an overview of lipoprotein metabolism.In: Betteridge D.J, Illingworth D.R,Shephard J.(Eds), Lipoproteins in health and diesese. Arnold,London .1st edition.1995;17-51.
- Wiseman S.A, Powell J.T, Humphries S.E, and Press M .The magnitude of the hypercholesterolemia of hypothyroidism is associated with variation in the low density lipoprotein receptor gene. Clin. Endocrinol. Metab.1993; 77(1): 108–112.
CrossRef - Mya M M, Aronow W S .Subclinical hypothyroidism is associated with coronary artery disease in older persons. J Gerontol A Biol Sci Med Sci.2002; 57(10):M658–M659.
CrossRef - Venditti P, Meo SD. Thyroid hormone-induced oxidative stress. Cell Mol Life Sci.2006; 63(4): 414–34.
CrossRef - Fernandez V, Tapia G, Varela P, Romanque P, Cartier Ugarte D, VidelaLA. Thyroid hormone-induced oxidative stress in rodents and humans: A comparative view and relation to redox regulation of gene expression. Comp Biochem Physiol C Toxicol Pharmacol.2006;142(3-4): 231–9.
CrossRef - Kebapcilar L, Akinci B, Bayraktar F, Comlekci A, Solak A, Demir Tet al. Plasma thiobarbituric acid-reactive substance levels in subclinical hypothyroidism. Med Princ Pract.2007;16(6):432-436.
CrossRef - Dumitriu L, Bartoc R, Ursu, Purice M, Ionescu V. Significance of high levels of serum malonyldialdehyde (MDA) and ceruloplasmin (CP) in hyper and hypothyroidism.Endocrinologie.1998;26:35-38
- Torun A N, Kulaksizoglu S, Kulaksizoglu M, Pamuk B.O, Isbilen E, TutuncuN.B. Serum total antioxidant status and lipid peroxidation marker malondialdehyde levels in overt and subclinical hypothyroidism. Clin Endocrinol.2009;70:469–474.
CrossRef - Erdamar H, Yaman H, Erbil MK,Yakar T, Sancak B, Elbeg S et al. The effect of hypothyroidism, hyperthyroidism and their treatment on parameters of oxidative stress and antioxidant status. Clin Chem Lab Med.2008;46 :1004-10.
CrossRef - Mackness M I, Mackness B, Durrington P N, Connelly P W, Hegele R A. Paraoxonase: biochemistry, genetics and relationship to plasma lipoproteins. Curr Opin Lipidol.1996; 7: 69-76.
CrossRef - Deakin S, BiolettoS, Bochaton-Piallat M, James R.HDL associated paraoxonase-1 can redistribute to cell membranes and influence sensitivity to oxidative stress. Free Radic Biol Med. 2011;50: 102-109.
CrossRef - Baskol G, Atmaca H ,Tanriverdi F, Baskol M ,Kocer D , Bayram F.Oxidative stress and enzymatic antioxidant status in patients with hypothyroidism before and after treatment. Exp Clin Endocrinol Diabetes.2007; 11:522–526.
CrossRef - Azizi F, Raiszadeh F, Solati M, Etemadi A, Rahmani M, Arabi. Serum paraoxonase 1 activity is decreased in thyroid dysfunction. J.Endocrinol.Invest.2003;26:703-709.
CrossRef - Amandeep Kaur, Jaskiran Kaur, Sahiba Kukreja, Anju Sharma, Neha. Total antioxidant status and serum lipid profile in hypothyroid patients in tertiary care hospital of Northerm India. International Journal of Clinical Biochemistry and Research.2016;3: 259-261.
CrossRef - Coria M J, Pastrán A I, Gimenez M S. Serum oxidative stress parameter of women with hypothyroidism. Acta Biomed. 2009;80: 135-139.
- Messarah M, Boumendjel A, Chouabia A, Klibet F, Abdennour C, Boulakoud M et al. Influence of thyroid dysfunction on liver lipid peroxidation and antioxidant status in experimental rats. Experimental and Toxicologic Pathology. 2010;62(3):301-310.
CrossRef - VendittiP,De Rosa R,DiMeo S (2003).Effect of thyroid state on H₂O₂ production by rat liver mitochondria. Mol.Cell.Endocrinol;205:185-192.
CrossRef - Jansen E, Ruskovska T. Comparative Analysis of Serum (Anti) oxidative Status Parаmeters in Healthy Persons. International Journal of Molecular Sciences. 2013;14 :6106-6115.
CrossRef - YilmazS,OzanS,BenzerF,Canatan H(2003).Oxidative damage and antioxidant enzyme activities in experimental hypothyroidism.CellBiochem Funct;21:325-330.
CrossRef - Sarandol E ,Tas S, DiricanM,Serdar Z(2005).Oxidative stress and serum paraoxonase activity in experimental hypothyroidism: effect of vitamin E supplementation. Cell Biochem Funct;23:1-8
CrossRef - Erel O. A new automated colorimetric method for measuring Total oxidant status .Clin Biochem.2005; 38:1103-11.
CrossRef - Erel O. A novel automated method to measure Total antioxidant response against potent free radical reactions. Clin Biochem.2004; 37:112-19.
CrossRef - Motor S, Ozturk S, Ozcan O, Gurpinar A, Can Y, Yuskel R et al. Evaluation of total antioxidant status, total oxidant status and oxidative stress index in patients with alopecia areata. Int J Clin Exp Med. 2014;7: 1089-93.
- Beltowski J,Wójcicka G, Marciniak A. Species and substrate –specific stimulation of human plasma paraoxonase 1 (PON1) activity by high chloride concentration. Acta Biochim Pol.2002;49: 927-936.
CrossRef - Cheserek M, Wu G, Ntazinda A, Shi Y, Shen L, Le G. Association Between Thyroid Hormones, Lipids and Oxidative Stress Markers in Subclinical Hypothyroidism. J Med Biochem. 2015;34: 323-331.
CrossRef - Lakshmi LJ, Mohapatra E, Zephy D, Kumari S. Serum lipids and oxidative stress in hypothyroidism. JARBS. 2013;5 :63-66.
- Joshi B, Jabannavar VB, Malleshapa A. Estimation of the levels of lipid peroxidation and total antioxidant capacity in hyperthyroid, hypothyroid and euthyroid subjects- A cross sectional study. International journal of pharmacology and therapeutics.2014;4:1-7.
- Bhimte B, Agrawal BK, Sharma VK. Oxidative stress status in hypothyroid patients. Biomedical Research. 2012;23:286-288.
- Jansen E, Ruskovska T. Comparative Analysis of Serum (Anti) oxidative Status Parаmeters in Healthy Persons. International Journal of Molecular Sciences. 2013;14 :6106-6115.
CrossRef - Sivakanesan R, Wickramarathne AMSM, Nanayakkara DKK. Serum Thyroid Stimulating Hormone and Antioxidant Status in Patients with Suspected Thyroid Dysfunction. MOJ Clinical & Medical Case Reports. 2014; 1: 10-14.
CrossRef - Gupta S, Kunti S, Chatterjee S, Dutta S, Nath S, Das H. Oxidative stress index as a biochemical parameter in major depressive disorder. Asian Journal of Medical Sciences. 2016; 7:31-35.
CrossRef - Yanik M, Erel O, Kati M. The relationship between potency of oxidative stress and severity of depression. Acta Neuropsychiatrica. 2004; 16:200-203.
CrossRef

