
Manuscript accepted on :17-04-2021
Published online on: 01-06-2021
Plagiarism Check: Yes
Reviewed by: Dr. Navid Razmjooy
Second Review by: Dr. Tejaswi Chavan
Final Approval by: Dr. Ian James Martin
Anuradha Vashishtha*and Anuja kumar Acharya
School of computer engineering, KIIT University, Bhubaneshwar, India.
Corresponding Author E-mail: er.anuradhavashishtha30@gmail.com
DOI : https://dx.doi.org/10.13005/bpj/2192
Abstract
Osteoarthritis is the most common form of “Arthritis & Joint disease”. Osteoarthritis (OA) is one of the fundamental causes of older and overweight individual’s sickness. It is the main cause of disability in adults. Mostly this disease occurs in people above 45 years of age, in which women suffer more as compared to men. it is basically damaged the Cartilage, because of which bones rub each other causing intense pain and inflammation. this gets thick and makes spurs at the edges. The knee Osteoarthritis is of 4 grades according to X-ray. The first 2 grade and 3rd grade can be recovered with the help of therapy and medications, while the 4th grade is necessary for knee replacement. The emerging Osteoarthritis management approach involves clinical evaluation & diagnostic imaging techniques. Within this research, we explore descriptively and objectively the various medical imaging methods used to diagnose and identify knee osteoarthritis. We study on the automatically detection of recovery rate of human disease and classify Osteoarthritis in the knee from medical images (like Magnetic Resonance image, CT scan, X-ray) from various medical image classification procedures. This paper provides a study that focuses on the various medical imaging methods used to determine osteoarthritis.
Keywords
Convolutional neural network (CNN); Knee Osteoarthritis (OA); Medical imaging; Medical Image Classification
Download this article as:| Copy the following to cite this article: Vashishtha A, Acharya A. K. An Overview of Medical Imaging Techniques for Knee Osteoarthritis Disease. Biomed Pharmacol J 2021;14(2). |
| Copy the following to cite this URL: Vashishtha A, Acharya A. K. An Overview of Medical Imaging Techniques for Knee Osteoarthritis Disease. Biomed Pharmacol J 2021;14(2). Available from: https://bit.ly/3xd2n6J |
Introduction
This segment offers a brief overview to our study on the immeasurably significant parts of Image processing (IP), medical imaging, knee bone, knee bone disease, and K&L Grades.
The word digital image processing refers to an image being processed through a processor. A picture is a two-dimensional object that represents a measure of certain characteristics, such as brightness or the color of a scene being viewed. In health care, digital image processing (DIP) is becoming increasingly relevant [1]. Some of the essential research areas of image processing such as computer tomography, medical image processing, and morphological imaging, etc. Therefore, digital image processing is an integral part of medical technology. The image processing can usually be divided into digital image processing (DIP) and medical image processing. The article would focus on how medical images are handled. Medical imaging today plays an important role in several other applications in the healthcare field. Medical Imaging is a method used to establish visualization of the body’s internal parts, that is, certain organs as well as tissues mainly for clinical study such as diagnosis or treatment of diseases. Medical imaging has undergone significant developments in clinical medicine. Today, there are many good physiological applications of this capacity to obtain a better understanding of the human organ [1].
Diagnostic imaging is a tactic for creating a visual representation of areas in the interior of the human body in order to identify in addition monitor medical conditions. This has had significant impacts on public health. Medical imaging requires the use of imaging methods and procedures to capture human body images which may assist in medical diagnosis and treatment. This can also be used to monitor any chronic concerns, which can also assist with recovery plans. Medical imaging is the method of generating the inner graphical images Secret structures of the skin and the bones. It is the technique where for clinical diagnosis and medical intervention, we can show the interior of the body. This is the component of biological imaging that includes radiology that utilizes X-ray, MRI, CT scan, etc. [2].
Knee Osteoarthritis
One of the main causes of mainly in women, old aged people and overweight people is Osteoarthritis (OA). OA is a joint condition, which often affects the cartilage. Cartilage is the defensive connective tissue in a joint that covers the ends of bones. Healthy cartilage allows simple gliding of bone in the joint and avoids friction between them [3]. In OA the upper layer of cartilage breaks down & goes away. This allows one another to rub the bones causing pain. It usually affects the knee, hip, spine, and joint in the legs. Age is the most common cause of osteoarthritis of the knee. Two types of OA, primary OA, are seen in older people due to genetic reasons or aging. Secondary OA appears earlier in life due to some injury, diabetes, obesity, athletics, or arthritis patients. A sample of the normal and affected osteoarthritis knee image is shown in Figure. 1.1 [3].
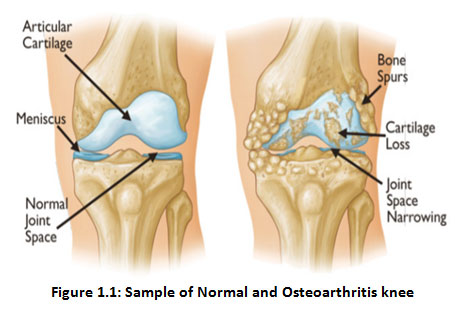 |
Figure 1.1: Sample of Normal and Osteoarthritis knee |
Diagnostic Features
Clinically, knee OA ‘s main neurotic qualities include narrowing of the joint field, osteophyte structure, and sclerosis [77,78]. Figure 1. Exhibits balanced anatomy of the hip and knee affected by OA: joint space contraction (JSN) due to cartilage deterioration and bone spurs (osteophytes). Knee OA symptoms include anatomical deformities, such as loss of articular ligament, menisci, tendons, synovial tissue, and subchondral bone.
The most important signs of OA include discomfort and difficulty in joint mobility, decreased limitations on operation and involvement, morning or after-rest joint stiffness. OA diagnosis is generally based on clinical assessment, symptoms, and basic techniques of radiographic evaluation (X-rays), MRI, CT, etc. While several other methods have been suggested, a reliable method for classifying individual pairs into 5 grades is the Kellgren-Lawrence (KL) scheme. Table 1. below shows the different grades of disease with OA [4,5].
Radiographic Classification of Knee OA
Knee OA grows progressively as the years progressed, and advances in stages. Knee OA range is usually split into 5 groups. The main (stage 0) matches to the normal healthy knee, and the last (stage 4) matches to the most severe event.
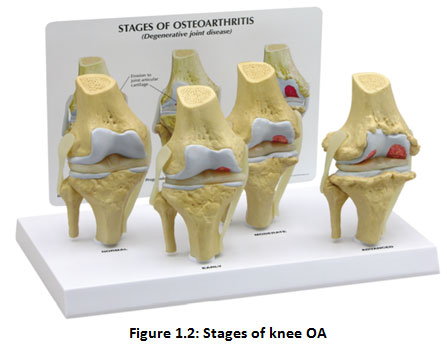 |
Figure 1.2: Stages of knee OA |
Figure 1.2 indicates the contrasting OA frequency levels in the knees. “The International Knee Documentation Committee (IKDC) scheme, the Ahlback scheme and Kellgren & Lawrence system2 are the most generally utilized strategies for grading knee OA”. The other commonly used OA assessment method for the non-radiographic knee is “Western Ontario and McMaster Universities osteoarthritis Index (WOMAC3)”, which tests pain, rigidity, and functional limitation.
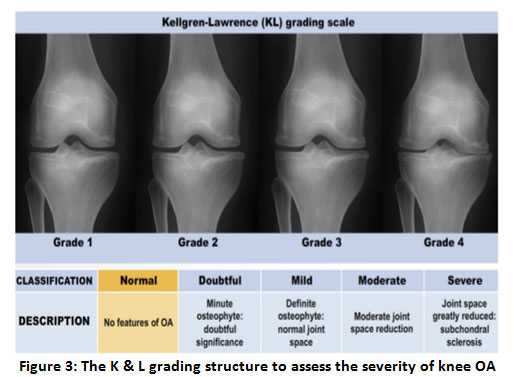 |
Figure 1.3: The K&L grading structure to assess the severity of knee OA. |
K&L grades can be used for radiographic Osteoarthritis quantification (Kellgren and Lawrence (1957)). As shown in Table 1.1, details the Grades assigned for different Osteoarthritis severities.
Table 1.1: Various grades of Osteoarthritis 4,5
| K&L Grades | Description |
| Grade 0 | Normal |
| Grade 1 | In doubt narrowing of joint space and possible osteophytic lipping |
| Grade 2 | Possible narrowing of joint space and definite osteophytes |
| Grade 3 | Definite narrowing of the joint space,
Moderate multiple osteophytes, Some sclerosis and possible deformity of bone ends |
| Grade 4 | Marked narrowing of joint space,
Large osteophytes, Severe sclerosis and definite of bone ends |
Structure of Human Knee
The human psyche has many joints but the knee joint plays a significant role in all joints as it is the largest joint. The aim of the figure is to find a way of making an important point available between thigh & lower leg during development. It includes bones (the femur, tibia, & patella), which are bound by the hyaline ligament articular surfaces (tibiofemoral and patellofemoral). In two significant areas, the femur cooperates with the tibia: average (closer to the body’s midline) & parallel (far from the center).Fig 1.4. shows an enticing knee reverberation diagram from a reference anatomical chartbook into a sagittal plane. You will see the ligament as a superb thin coating that protects the bone [6].
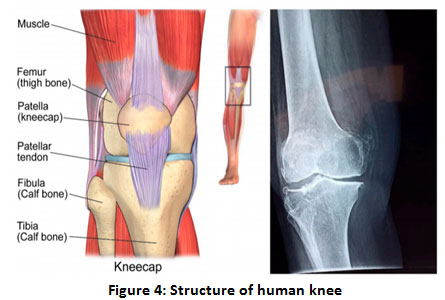 |
Figure 1.4: Structure of human knee [6]. |
Medical Image Classification
“Image processing tasks consist of three steps: extraction and representation of objects, classification of images, and interpretation of images” [7]. One of the active areas of computer vision is the detection and classification of osteoarthritis of the knee from MIME. One of the most widely discussed issues in computer vision is the classification of pictures. This field aims to detect all the artifacts of a given picture.
Classification of pictures is the most important obstacle to the tasks of image processing. This task was related to the use of methodologies to manipulate the effects of image analysis, the product of pattern recognition and methods of classification, and then authorizing the resulting image classification into health expert information [8]. The primary goal of classifying MIMEs is indeed to achieve high precision but to classify areas of the patient’s psyche that have the disease as well [9]. For better clinical treatment an automated diagnostic technique with image data is required in the future. Since the deal with image classification stays an open field and a significant test that nullifies the result of image classification through clinical master information, this paper focuses only on a thorough analysis of the methods used to classify clinical image mining using the updated approach that addresses this problem.
Therefore, this paper is designed as follows. section II presents in detail different types of medical images, Section III presents different types of medical image classification techniques and description of the convolutional neural network (CNN), Section IV presents the conclusion of the review.
Screening Techniques
Tragically, today’s typical OA treatment doesn’t cure the disease absolutely. It is then of utmost importance to consider the degeneration of the ligament until it becomes irreversible.
Medical imaging comprises a good understanding of imaging media & object, physical imaging, instrumentations & visual display method. There are several modalities of medical imaging which include ionized radiation, Ultrasound, Magnetic Resonance, Nuclear Medicine, also Optical Methods as a media of modality. Each medium of modality has a specific characteristic in addition the response of modifications to the structure of the human body and the tissue of the organs [10]. Medical imaging devices make use of the patient’s received signals to generate images. The extent of ligament degeneration in patients is determined by many methods [11].
Radiography (X-Ray) Imaging
It is a method of electromagnetic radiation by means of a frequency scope of 0.1-10 nm and changed into photons, 12-125 keV, of energy level. The X-ray imaging technology was used almost simultaneously with the need to use research laboratory work as a health instrument for diagnosis. These are used to take pictures of the bones, usually to see whether and where fractures occur. Dentists and orthodontists also use them to look at teeth. We can also see bone tumors on x-rays [11].
Across the last hundreds of years, Joint Space Width (JWS) X-rays have become the standard OA screening technique. As they are non-obtrusive, they provide considerable advantages over arthroscopy and can be performed again when needed. “The drawback of Radiology is the lack of sensitivity for brief moment monitoring due to how X-ray images appear to measure ligament changes over 2–3 years” [6].
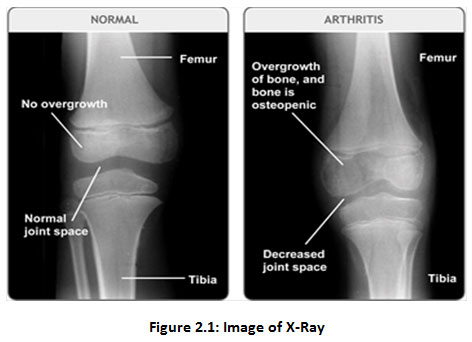 |
Figure 2.1: Image of X-Ray. |
Advantages of X-ray image
The machine does not surround the complete figure so in people with claustrophobia it will not cause anxiety.
The operation takes just a few minutes to complete.
Disadvantages of X-ray image
Some dissimilarity mediators could cause undesirable side effects.
X-rays expose the patient to toxic radiation, which may cause cancer, but the total of radiation provided is small [12].
Computed Tomography (CT scan)
CT is a method in medical imaging that has had a significant effect on health judgment & evaluations. This is a common multimodal modality Medical fusion picture [13-26]. A Scans is just the same as an X-ray producing cross-sectional images within a given area ‘s body. A CT production from one’s knee, for example, will allow specialists to examine illness or to examine wounds on one’s knee. The body is circled by a CT scanner, and pictures are forwarded to a Screen. These images are used by the Computer point by point to the point of view. This allows specialists to see the muscles, ligaments, tendons, lungs, & bones that make up one’s leg, in specialism and training. Likewise, a CT scan is also called a CAT scan. The output is assessed in a laboratory or in a specified casualty test facility. The key benefits of the CT scan are the comparatively tall processing periods then the high resolution of the images [6].
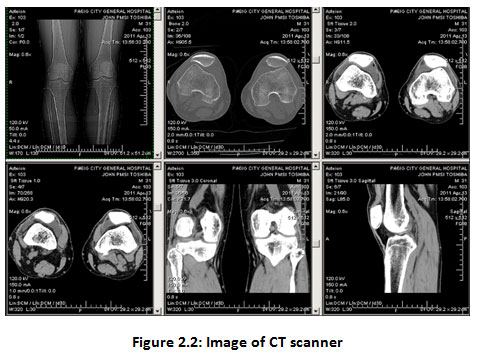 |
Figure 2.2: Image of CT scanner. |
Advantages of Computed Tomography
CT scans are relatively short-they last just about 10-20 minutes.
Results compared to some other types of scans are extremely fast.
CT scans are non-invasive, as they are painless.
Disadvantages of Computed Tomography
As with many scans, your body is exposed to a certain amount of radiation. The more the patient’s body is scanned the more they are exposed to radiation. These are also designed to limit the sensitivity to radiation.
An allergic reaction to the used dye is likely. [12].
Magnetic Resonance imaging (MRI)
MRI is a mostly modern standard ligament screening technique as it doesn’t use radiation therapy, is non-intrusive & reproducible, and offers high contrast and clarity with decent image quality. X-rays transmit images in a proprietary format that can be processed and easily retrieved, and offer a set of requirements for the appropriate supply of images. [6]. The MRI approach uses a strong magnetic field to coordinate the nuclear magnetization of water molecules with hydrogen atoms. The upside of MRI is that it is fit as a fiddle for pregnant ladies and youngsters since it doesn’t permit introduction to radiation. What’s more, delicate tissue structures are precisely reproduced in organs, for example, knee, mind, heart, and eyes. The main drawback of MRI images is their motion-related apathy, making it impossible to analyze movement-essential organs such as mouth tumors [27].
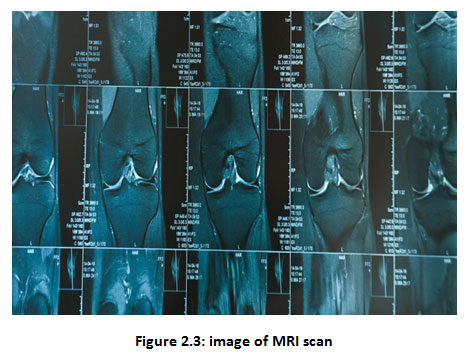 |
Figure 2.3: image of MRI scan. |
Advantages of MRI image
MRI scans are painless and safe because there is no known harmful impact on the enduring from the magnetic fields & radio waves.
Does not require exposure to x-ray radiation, so pregnant women & babies can use it if appropriate.
Disadvantages of MRI image
MRI scans involve plenty of figure and people with claustrophobia feel nervous.
Metal can’t go into an MRI scanner and people with other implants like pacemakers can’t use it. [12].
Medical Image classification techniques
“Clinical imaging is the technique and process of making a visual representation of the inside of a body for clinical research and clinical intercession, and the visual representation of the job of specific organs or tissues (physiology)”. Clinical imaging likewise gives a premise of typical life structures and physiology for the recognizable proof of anomalies. Despite the fact that imaging of separated organs and tissues can be performed for clinical purposes, such methodology is generally viewed as a major aspect of pathology as opposed to clinical imaging. Image classification is a pixel or group of pixels with gray value-based labeling.
Classification is one of the most commonly used forms of knowledge extraction. In Classification, multiple features are usually used to collect pixels, i.e., multiple images of a given object are needed. The procedure that will be used for the image classification is as follows:
Image Acquisition: It is the retrieving of an image from a source.
Image Enhancement: It aims to improve the image qualitatively with respect to a specific task.
Feature Extraction: This is the data cleaning process in which the features related to the classification are extracted from the cleaned images.
Classification: Classification of images is the marking of a pixel or group of pixels based on their gray color.
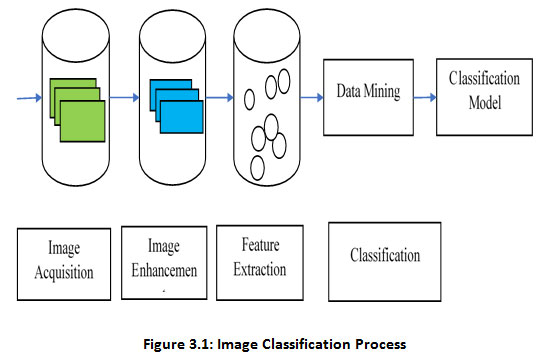 |
Figure 3.1: Image Classification Process. |
Texture classification
Texture offers essential features and properties for computer vision & IP difficulties such as investigation of images, classification, & analysis of segmentations. Texture classification requires a result as to the type of texture belongs to the trial image using prior class information and classification algorithms [28].
It can be useful to any digital image modality & assists in obtaining Image spectral properties. Besides, the description of textural characteristics may be useful for clinical analysis by the radiologist and Partitioning the selected features room by class/category of tissue. A wide range of techniques has been proposed for describing the texture of the image. Approaches of texture analysis can be broken down into four kinds of mathematical, graphical, model-based, & signal processing [29].
k-Nearest Neighbor Pattern Classification (KNN)
The KNN was going to be a non-parametric set of rules. First, the set of rules stores the vectors of the Training set function, and then you can find a novel case classification set of k closest training cases in the Function space, then assign the case to the class with more cases in the set [30]. “In Suguna & Thanushkodi’s work [31] an upgraded kNN utilizing a genetic set of rules has been utilized to diminish the high aim complexity with low reliance on the training set and no weight variance b/w each class”.
“Latifoglu et al., [32] have proposed a clinical technique for the conclusion of atherosclerosis sickness dependent on fundamental component analysis, KNN weight pre-processing, & Artificial Immune recognition System (AIRS)”. Nonetheless, this algorithm has some limitations: it can only store highly computationally complex local statistics, and it takes longer to compute new queries. It can deal with binary & continuous attributes yet it doesn’t expressly discrete those [33]. By the by, scarcely any ongoing investigations look to determine the restriction of customary kNN, e.g., in the [34,35,31] study, can yield better results.
Support Vector Machine (SVM)
SVM is a theory of statistical learning which analyzes data & recognizes patterns. It’s a good thing. Supervised way of studying. “The key training course in arrears SVM is to find the ideal linear hyper-lane, thus reducing the error predictable in classifying unknown samples of the analysis” [28]. SVM ‘s benefits: Both continuous and binary attributes can be handled; rating speed and accuracy are fine. Yet there are few inconveniences, such as SVM will take longer to train data set and does not manage discrete attributes [36]. “Kharrat et. al [37] recommend a classification technique for mind MRI utilizing an SVM genetic calculation and fit for characterizing cerebrum tissue into an ordinary, generous, or dangerous tumor”. In any case, when managing multi-measurements and consistent usefulness SVM will in general improve. It takes a large sample size to reach optimum predictive accuracy.
Convolutional Neural Networks (CNNs)
maintaining spatial data relations. In CNN, the input is settled in a net assembly and then fed through layers which preserve some layers, with respectively layer acting on a specific area of the previous layer (Figure. 3.2) [38]. However, we encounter three different types of layers in these networks instead of plain perceptron layers (a) Convolutional layers, (b) Pooling layers, (c) Completely connected layers (often called FC-layers). We define these layers below, concentrating mainly on the Convolutional layers which are the key strength source for CNN’s. CNN’s key bit of leeway over totally connected systems is that they’re simpler to train, have less parameters with a similar number of concealed units and learn invariant features in space. LeNet, AlexNet, GoogleNet, VGG net, and ResNet are some examples of the CNN architectures. As shown in Figure 3.2. The architecture of the convolutional neural network (CNN).
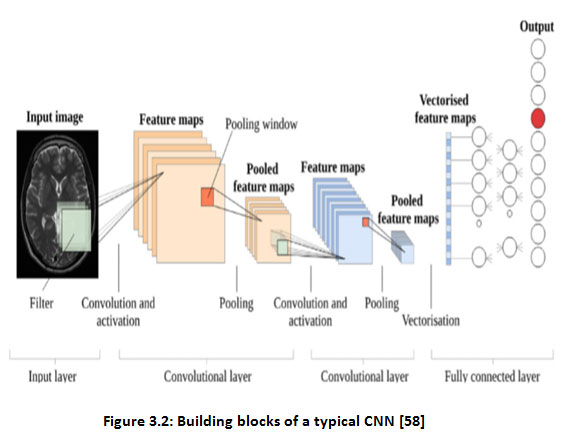 |
Figure 3.2: Building blocks of a typical CNN [58]. |
Convolutional layers
This layer is made up of several feature maps, which are gained by kernel convolution with the input signal. “For a two-dimensional (2-D) image of a solitary way, every convolution kernel is a weight matrix that can be a 3 × 3 or 5 × 5 matrix” [39]. An example of the 2-D convolution is shown in Figure. 3.3.
The convolution strategy gives an approach to the process variable size input sources utilizing the convolution kernels, and extraordinary inputs features are separated by convolution activity in the convolution layer. “The main layer draws tests of features of the lower level, for example, sides, corners, and endpoints. At that point, the higher layer takes out increasingly complex and more elevated level capacities by changing the features at the lower level” [39]. In the primary, the Convolution layer has minimal contact characteristics & weight sharing. Feature maps are fed through nonlinear activation functions from a convolutional layer. This permits almost any nonlinear function to be approximated for the whole neural network. “The activation functions are commonly exceptionally basic direct amended units, or ReLUs, characterized as ReLU(z) = max (0, z), or variations, for example, defective ReLUs or parametric ReLU. For more detail on these & other empowering features. Taking care of the feature maps with an activation function delivers new tensors, all the more regularly known as feature maps” [39].
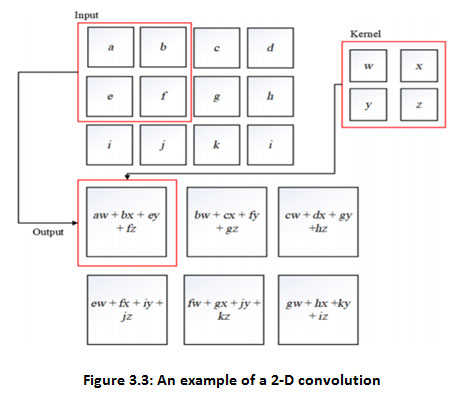 |
Figure 3.3: An example of a 2-D convolution |
Polling layer
In general, a pooling layer is then pooled into each feature map made by taking care of the information through at least one convolutionary layer. “Pooling tasks, accepting little network locales as data sources, yield single numbers for every area. Commonly, the number is resolved to utilize the capacity (max-pooling) or mean (average pooling)” [38]. The pooling layers give the CNN an invariance of an interpretation since a slight move in the input picture prompts minor changes in the activation maps.
“One way to get the sampling effect of pooling down is to use convections with the extended phase duration. Evacuating the pooling layers rearranges the system’s configuration without performance” [39]. The most widely used layer of max-pooling is given away in Figure. 3.4.
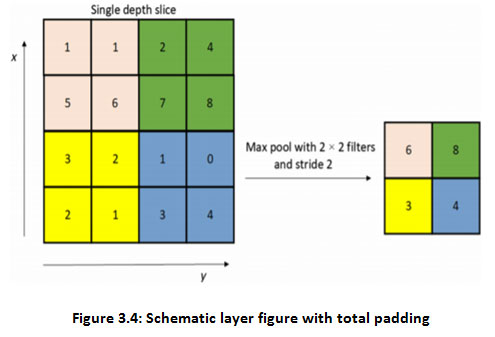 |
Figure 3.4: Schematic layer figure with total padding. |
Fully connected layer
The image’s feature map is separated after a progression of convolution and pooling layers, and all the neurons in the element map are changed over into a fully connected network. To finish, SoftMax is capable of classifying output by layer. The completely linked layer aims to combine local knowledge with class distinguishing in both the convolution layer and the pooling layer [39] in order to increase the CNN’s overall effectiveness.
Table 2: Medical image classification studies of knee Osteoarthritis
| Reference | Author | Year | Data | Algorithms | Results |
| [40]
|
Bin Liu, Jianxu Luo, Huan Huang. | 2020 | X-ray | FLA | 82.5% acc |
| [41] | N. Bayramoglu, A. Tiulpin, J. Hirvasniemi, M.T. Nieminen, S. Saarakkala. | 2020 | X-ray | Logistic regression | AUC of 0.84 |
| [42] | Pingjun Chen, Linlin Gao, Xiaoshuang Shi, Kyle Allen. | 2019 | X-ray | CNN | 69.7% acc |
| [43] | Marc Górriz, Joseph Antony, Kevin McGuinness, Xavier Giró-i-Nieto, Noel E. O’Connor. | 2019 | X-ray | CNN | 64.3% acc |
| [44] | Christoph von Tycowicz | 2019 | X-ray | CNN | 64.64% acc |
| [45] | Rima Tri Wahyuningrum, Lilik Anifah, I Ketut Eddy Purnama, Mauridhi Hery Purnomo. | 2019 | X-ray | LONG SHORT-TERM MEMORY (LSTM) | 75.28% acc |
| [46] | Nicholas Bien, Pranav Rajpurkar, Robyn L. Ball, Jeremy Irvin, Allison Park, Erik Jones, Michael Bereket, Bhavik N. Pate, Kristen W. Yeom, Katie Shpanskaya, Safwan Halabi, Evan Zucker, Gary Fanton, Derek F. Amanatullah, Christopher F. Beaulieu, Geoffrey M. Riley, Russell J. Stewart, Francis G. Blankenberg, David B. Larson, Ricky H. Jones, Curtis P. Langlotz, Andrew Y. Ng, Matthew P. Lungren. | 2018 | MRI | CNN | AUC of 0.937 |
| [47] | Aleksei Tiulpin, Jérôme Thevenot, Esa Rahtu, Petri Lehenkari and Simo Saarakkala. | 2018 | X-ray | CNN | 66.71% acc (multi-class grades 0–4) |
| [48] | J. Antony, et al. | 2017 | X-ray | CNN | 60.3% accuracy of multi-class scoring. |
| [49] | Shivanand S. Gornale, Pooja U. Patravali, Kiran S. Marathe, Prakash S. Hiremath. | 2017 | X-ray | SVM | 97.96% for grade-0, 92.85% for grade-1, 86.20% for grade-2, classification rate for grade-3 and grade-4. |
| [50] | V Ashwin Kumar; A. K. Jayanthy. | 2016 | MRI | SVM | 86.66% acc |
| [51] | Sandeep Sharma; Sunpreet Singh Virk; Vibhor Jain. | 2016 | X-ray | SVM | 95% acc |
| [52] | Dattatray Ishwar Navale, Ravindra S. Hegadi and Namrata Mendgudli.. | 2015 | X-ray | SVM | Accuracy is 80% for affected subjects. |
Table 3: Collection of medical image classification techniques.
| Reference | Author | Year | Different Techniques | Imaging Modalities | Dataset | Pros & Cons. |
| [53] | Arnaud A. A. Setio, Francesco Ciompi, Geert Litjens, Paul Gerke, Colin Jacobs, Sarah J. van Riel, Mathilde Marie Winkler Wille, Matiullah Naqibullah, Clara I. Sanchez, Bram van Ginneken.
|
2016 | CNN | CT scan | Dataset:
888 scans of the publicly available LIDCIDRI |
False positive reduction
In the sense of using the CAD method for lung cancer screening the efficiency in terms of sensitivity should be improved. |
| [54] | Marios Anthimopoulos, IEEE Member, Stergios Christodoulidis, IEEE Member, Lukas Ebner, Andreas Christe, Stavroula Mougiakakou. | 2016 | CNN | Lung CT Scanner
Weakness |
14696 image patches, derived by 120 CT scans | High performance
Because of the random initialization of weights, a large number of parameters slow training time, small fluctuation of results for the same data. |
| [55] | Mark J. J. P. van Grinsven, Bram van Ginneken, Carel B. Hoyng, Thomas Theelen, Clara I. Sanchez. | 2016 | (CNNs) + Selective
Sampling (SeS)
|
Color fundus image
|
A subset of images from the “Diabetic Retinopathy Identification” vs Kaggle images stored on the Messidor site which is publicly accessible. | High performance
Use of reference guide still issued by a single expert. |
| [56] | Qi Dou, Hao Chen, Lequan Yu, Lei Zhao, Jing Qin, Defeng Wang, Vincent CT Mok, Lin Shi and Pheng-Ann Heng. | 2016 | 3D CNN | Cerebral micro-bleeds (CMBs) MRI | Dataset:
320 volumetric MR scans
|
High sensitivity 93:16%
Not balance between the precision & speed of detection
|
| [57] | Junpyo Hong, Jared Vicory, Jörn Schulz, Martin Styner.
|
2016 | Principal Nested Spheres (PNS), Distance Weighted Discrimination (DWD)
|
MRI | Data set of 277 hippocampus s-reps
|
AUC > 0.600
Apply PNS separately
|
| [58] | Anju Rani, Deepti Mittal and Ritambhara. | 2016 | SVM | Ultrasound | Apply 95 images
|
High precision.
To each classifier receives training on only two N-classes. |
| [59] | Ammara Masood and Adel Al-Jumaily. | 2015 | SVM | Biopsy samples | Dataset 1 contains 300 labeled and 500 unlabeled images. Dataset 2 contains 160 images consisting of 60 labels and 100 unlabeled samples. | High accuracy.
For Histopathological Images classification error (%) almost equivalent to TSVM The classification error decreased around 16.5% for Histopathological images and 6% for Dermoscopic images
|
| [60] | Yang Song, Weidong Cai, Heng Huang, Yun Zhou, Yue Wang, David Dagan Feng. | 2015 | Locality-constrained Sub-cluster Representation Ensambler (LSRE) | High Resolution Computed Tomography (HRCT) | Dataset: 113 HRCT | High precision.
The Locality-constrained Linear Coding (LLC) did not use advanced distance function.
|
| [61] | Farzad Khalvati, Alexander Wong & Masoom A. Haider. | 2015 | SVM
|
Multi-parametric magnetic resonance imaging (MP-MRI) | 20 patients
|
High sensitivity & specificity (above 80%).
Limited number of datasets (20 patients) and targeting only seven and above Gleason score, clinicians did not evaluate the proposed model. |
| [62] | Vanathi Gopalakrishnan, Prahlad G Menon, Shobhit Madan. | 2015 | Bayesian rule
learning (BRL) methods |
Cardiovascular Magnetic Resonance Imaging (cMRI)
|
Used dataset of
83 de-identified cases |
High precision.
Limited datasets number.
|
| [63] | G.N.Balaji, T.S.Subashini, and N.Chidambaram. | 2015 | BPNN, SVM | Echocardiogram | A dataset of 200 patients. | Strong efficiency (87.5%)
Exclude other views, such as Doppler view and subcostal view.
High precision.
Limited datasets number
|
| [64] | Leo Ai, Xin Gao & Jinhu Xiong. | 2014 | Mean-Shift Clustering (MSC)
|
Functional magnetic resonance imaging (fMRI) | Ten subjects (5 females, 5 males, age 22–32) | Low false positive rate
The importance rates can’t be easily measured theoretically. Still, when very precise comparisons are needed, it may pose some challenges.
|
| [65] | Manju B, K. Meenakshy, and R. Gopikakumari. | 2014 | KNN classifier | CT images | Use 20 CT data, 103 CT image slices | High precision.
Limited datasets number
|
| [66] | Andreia Andrade, José Silvestre Silva, Jaime Santos, Pedro Belo-Soares. | 2012 | Compare ANN, SVM and KNN classifier. | Ultrasound
imagerie |
177 echo-graphic images from 36 patients were used | Superior precision for classifier SVM.
Limited Dataset number |
| [67] | João Miguel Pires Dias, Carlos Manta oliveira, Luís A. da Silva Cruz. | 2012 | Feed-Forward Backpropagation Neural Network | Digital Retinal Imageries
|
2032 images | High sensitivity & specificity.
The classification is not greatly affected by the random initialization of the load of the neural network. |
| [68] | M. A. Dabbah J Graham, I N Petropoulos, M Tavakoli, R A Malik. | 2011 | Multi-scale dual-model with classification of NNT pixels | Corneal confocal microscopy (CCM) image | Dataset: 521 CCM images from 68 subjects using an HRT-III microscope, including 20 control patients and 48 diabetic patients. | Up to 15.44 percent EER sensitivity and precision.
This method provides equal results as compared with the manual analysis (expert manual annotation). |
| [69] | Hesheng WangBaowei Fei. | 2009 | Multiscale fuzzy C-means (MsFCM) classification method | MRI | McGill brain MR database
|
Overlap ratio checked by ground reality exceeds 90 percent.
Classification approach was not threshold sensitive when it reached b/w 0.8 & 0.9. |
| [70] | Mutlu Mete, Leah Hennings, Horace J Spencer and Umit Topaloglu. | 2009 | SVM
|
Digital camera mounted to a microscope | 522 Samples taken from two tissues with high resolution. | Calculate the dimensional fraction variable based on set only. Sub-image has the same classification possibilities as the positive or negative attribute. That means the known sub-positive image does not affect the results of the classification of its neighboring sub-images.
|
| [71] | Meindert Niemeijer, Michael Abramoff, and Bram van Ginneken. | 2006 | SVM | Retinopathy screening | 1000 images | 0.9968 ROC-curve. Accuracy of 0.974, The accuracy achieved of 0.974 also shows room for improvement is still there. |
| [72] | Suyash P. Awate, Tolga Tasdizen, Norman Foster, and Ross T. Whitaker.
|
2006 | Markov statistics non-parametrically | MRI | Dataset: BrainWeb data.
|
Higher mean (by some%) & lower standard deviation.
The Markov neighborhood in the current algorithm comprises only nearest neighbors. |
Discussion
Research on CNNs has progressed rapidly over the years but computing resources and memory limitations frequently constrain the realistic implementation of these models. What has also led to extensive research on ConvNets is the accuracy of difficult classification tasks that involve an understanding of abstract concepts in pictures. Another reason why CNN is so popular is due to its architecture-the best thing is that there is no need for feature extraction. The computer learns to extract characteristics and the central concept of CNN is that it uses image and philtre convolution to establish invariant features that are passed on to the next layer. The next layer results are compared with unique philters to create more invariant and abstract features, and hence the process is repeated until the final feature / output (say, X face) becomes invariant to occlusions.
ConvNets are more effective than machine learning algorithms, and are therefore more accurate in numerical terms. ConvNets are also highly successful in areas involving vast unstructured data, such as image detection, speech recognition, & natural language processing. “We have developed deep learning & ML techniques for analysing knee bone images”. Deep learning & ML methods are set out in Table 4 below
Table 4: Deep Learning & Machine Learning Methodologies
| Deep Learning Techniques | Machine Learning Techniques |
| Convolutional Neural Network | Support Vector Machine |
| K-Nearest Neighbor Algorithm | Multivariate Support Vector Machine |
| Kellgren–Lawrence Classification | Bayesian Classifier |
| SSMs | Artificial Neural networks |
Conclusion
The principal motivation behind this review is to advance the state-of-the-art computer-aided diagnosis of knee OA severity through the advancement of predictive methods based on deep learning. Classification of health images is an important part of the study; it combines the diagnostic question with the goals of the scientific review. This paper introduced an intensive examination of knee osteoarthritis in clinical imaging, concentrating on automatic detection and methods for human body sickness analysis, in which the imaging modalities utilized for each Dataset and pros & cons. Improvements in image classification techniques for future research will improve the accuracy value and can be used for later computer-assisted diagnosis, and more reliable methods can be developed.
Acknowledgement
The authors want to acknowledge the support of the data set of different kinds of diseases through medical imaging (knee Osteoarthritis, Brain Tumor, Parkinson’s disease, Alzheimer’s disease, Eye Fund us Retina).
Conflict of Interest
The authors declare no conflict of interest.
Reference
- R. Gonzalez, R. Woods, B. Masters, (2009). Digital Image Processing, Third Edition. Journal of Biomedical Optics., 14(2): 029901.
CrossRef - E. Miranda, M. Aryuni, E. Irwansyah, (2017). A survey of medical image classification techniques. Proceeding of 2016 International Conference on Information Management and Technology, (ICIMTech) 2016., 56-61.
CrossRef - http://centrallibrary.cit.ac.in/dir/Project%20Report/2019/BTech/CSE/CLASSIFICATION%20AND%20DETECTION%20OF%20OSTEOARTHRITIS%20IN%20KNEE%20MRI%20IMAGES%20USING%20DEEP%20LEARNING.pdf
- P. Kawathekar, and K. Karande, (2014). Severity analysis of Osteoarthritis of knee joint from X-ray images: A Literature review. 2014 International Conference on Signal Propagation and Computer Technology, (ICSPCT 2014)., 648-652.
CrossRef - T. Mengko, R. Wachjudi, A. Suksmono, et al. (2005). Automated detection of unimpaired joint space for knee osteoarthritis assessment. Proceedings of 7th International Workshop on Enterprise Networking and Computing in Healthcare Industry, HEALTHCOM 2005., 400-403.
CrossRef - H. khalid, M. Hussain, M. Al Ghamdi et al. (2020). A Comparative Systematic Literature Review on Knee Bone Reports from MRI, X-Rays and CT Scans Using Deep Learning and Machine Learning Methodologies. Diagnostics., 10(8): 518.
CrossRef - A. P. Dhawan and S. Dai, (2008). Clustering and Pattern Classification. in Principles and Advanced Methods in Medical Imaging and Image Analysis. Singapore: World Scientific Publishing Co. Pte. Ltd., 229-265.
CrossRef - Monireh Sheikh Hosseini and Maryam Zekri. (2012). Review of Medical Image Classification using the Adaptive Neuro-Fuzzy Inference System. Journal of Medical Signals & Sensors., 2(1): 49–60.
CrossRef - Saima Anwar Lashari and Rosziati Ibrahim. (2013). A Framework for Medical Images Classification Using Soft Set., Procedia Technology ICEEI 2013., 548–556.
CrossRef - Denise Aberle, Suzie El-saden, Pablo Abbona, Ana Gomez, Kambiz Motamedi, Nagesh Ragavendra, Lawrence Bassett, Leanne Seeger, Matthew Brown, Kathleen Brown, Alex A. T. Bui, Hooshang Kangarloo. (2010). A Primer on Imaging Anatomy and Physiology. Medical Imaging Informatics. New York: Springer., 17-53.
CrossRef - Dr Mohd Fauzi Bin Othman, Norarmalina Abdullah, Nur Aizudin Bin Ahmad Rusli. (2010). An overview of MRI brain classification using FPGA implementation. 2010 IEEE Symposium on Industrial Electronics and Applications (ISIEA 2010)., 623–628. https://www.doc.ic.ac.uk/~jce317/types-medical-imaging.html
CrossRef - K. Mikoajczyk, J. Owczarczyk, W. Recko. (1993). A test-bed for computer-assisted fusion of multi- modality medical images, Computer Analysis of Images and Patterns, Springer., 664– 668.
CrossRef - R. Kapoor, A. Dutta, D. Bagai, T. S. Kamal. (2003). Fusion for registration of medical images-a study. Applied Imagery Pattern Recognition Workshop, 2003, Proceedings. 32nd, IEEE., 180–185.
CrossRef - Kang Yuanyuan, Li Bin, Tian Lianfang, Mao Zongyuan. (2007). Multi-modal medical image fusion based on wavelet transform and texture measure. 2007 Chinese Control Conference., 697–700.
CrossRef - Guihong Qu, Dali Zhang, Pingfan Yan. (2001). Medical image fusion by wavelet transform modulus maxima. Optics Express., 9(4): 184–190.
CrossRef - Anna Wang, Haijing Sun, and Yueyang Guan. (2006). The application of wavelet transform to multi-modality medical image fusion. Networking, Sensing and Control, 2006. ICNSC’06. 2006 IEEE International Conference on networking, sensing and control., 270–274.
CrossRef - Shangli Cheng, Junmin He, Zhongwei Lv. (2008). Medical image of PET/CT weighted fusion based on wavelet transform., 2523–2525.
CrossRef - Yuhui Liu, Jinzhu Yang, Jinshan Sun. (2010). PET/CT medical image fusion algorithm based on multiwavelet transform, 2010 2nd International Conference on Advanced Computer Control (ICACC)., 2: 64–268.
CrossRef - Jionghua Teng, Suhuan Wang, Jingzhou Zhang, Xue Wang. (2010). Fusion algorithm of medical images based on fuzzy logic. Seventh International Conference on Fuzzy Systems and Knowledge Discovery, FSKD 2010, 10-12 August 2010, Yantai, Shandong, China., 546–550.
CrossRef - Bettina Hentschel, Wolfgang Oehler, Dirk Strauss, Andreas Ulrich, Ansgar Malich, (2011). Definition of the CTV prostate in CT and MRI by using CT–MRI image fusion in IMRT planning for prostate cancer. Strahlenther Onkologie., 187(3): 183–190.
CrossRef - Stefan Franz Nemec, Philipp Peloschek, Maria Theresa Schmook, Christian Robert Krestan, Wolfgang Hauff, Christian Matula, Christian Czerny. (2010). CT–MR image data fusion for computer-assisted navigated surgery of orbital tumors. European journal of radiology., 73(2): 224–229.
CrossRef - Hiroki Fukunaga, Mitsugu Sekimoto, Masataka Ikeda, Ichiro Higuchi, Masayoshi Yasui, Iwao Seshimo, Osamu Takayama, Hirofumi Yamamoto, Masayuki Ohue, Mitsuaki Tatsumi, Jun Hatazawa, Masakazu Ikenaga, Tsunehiko Nishimura, Morito Monden. (2005). Fusion image of positron emission tomography and computed tomography for the diagnosis of local recurrence of rectal cancer. Annals of surgical oncology., 12(7): 561–569.
CrossRef - Rodney J Ellis, Hang Zhou, Deborah A Kaminsky, Pingfu Fu, Edward Y Kim, D Bruce Sodee, Valdir Colussi, John P Spirnak, Christopher C Whalen, Martin I Resnick. (2007). Rectal morbidity after permanent prostate brachytherapy with dose escalation to biologic target volumes identified by SPECT/CT fusion. Brachytherapy., 6(2): 149– 156.
CrossRef - A P Pecking, M Wartski, R V Cluzan, D Bellet, J L Alberini. (2007). SPECT–CT fusion imaging radionuclide lymphoscintigraphy: potential for limb lymphedema assessment and sentinel node detection in breast cancer. Cancer Metastasis And The Lymphovascular System: Basis For Rational Therapy, Springer, 2007., 79–84.
CrossRef - Jean L. Alberini, Myriam Wartski, Veronique Edeline, Olivier Madar, Soraya Banayan, Dominique Bellet, Alain P. Pecking. (2009). Molecular Imaging of Neuroendocrine Cancer by Fusion SPET/CT, From Local Invasion to Metastatic Cancer, Springer., 169–175.
CrossRef - Alex Pappachen James, Belur V. Dasarathy. (2014). Medical image fusion: A survey of the state of the art. Information Fusion., 19: 4–19.
CrossRef - Saima Anwar Lashari, & Rosziati Ibrahim. (2013). A Framework for Medical Images Classification Using Soft Set. Procedia Technology., 11: 548–556.
CrossRef - A. Kassner, R.E. Thornhill. (2010). Texture Analysis: A Review of Neurologic MR Imaging Applications, A Journal of NeuroRadiology 31:809-16., 809–816.
CrossRef - Belur V. Dasarathy. (1991). Nearest Neighbour (NN) Norms: NN Pattern Classification Techniques, Mc Graw-Hill Computer Science Series, IEEE Computer Society Press, Las Alamitos, California., 217-224.
- Suguna N & K. Thanushkodi. (2010). An Improved k-Nearest Neighbor Classification Using Genetic Algorithm. IJCSI International Journal of Computer Science Issues., 7(2): 1694-0784.
- Fatma Latifoglu, Kemal Polat, Sadik Kara, Salih Gunes. (2008). Medical diagnosis of atherosclerosis from carotid artery Doppler signals using principal component analysis (PCA), k-NN based weighting pre-processing and Artificial Immune Recognition System (AIRS). J. Biomed. Inform. 41(1): 15–23.
CrossRef - S. B. Kotsiantis. (2007). Supervised machine learning: A review of classification techniques. Informatica. 31: 249-268.
CrossRef - N. Hema Rajini & R. Bhavani. (2011). Classification of MRI Brain Images using k- Nearest Neighbor and Artificial Neural Network. IEEE-International Conference on Recent Trends in Information Technology (CRTIT)., 865-868.
CrossRef - Abdulkadir Sengur. (2008). An expert system based on principal component analysis, artificial immune system and fuzzy k-NN for diagnosis of valvular heart diseases. Computers in Biology and Medicine., 38(3): 329-38.
CrossRef - H. Selvaraj, S. Thamarai Selvi, D. Selvathi, & L. Gewali. (2007). Brain MRI Slices Classification Using Least Squares Support Vector Machine. International journal of intelligent computing in medical sciences & image processing., 1(1): 21-33.
CrossRef - Ahmed Kharrat, Gasmi karim, Mohamed ben Messaoud, Nacera Benamrane. (2010). A hybrid approach for automatic classification of brain MRI using genetic algorithm and support vector machine. Leonardo Journal of sciences., 71-82.
CrossRef - Alexander Selvikvåg Lundervold, Arvid Lundervold, (2018). An overview of deep learning in medical imaging focusing on MRI. Zeitschrift Für Medizinische Physik., 29(2): 102-127.
- Wei Wang, Yujing Yang, Xin Wang, Weizheng Wang, Ji Li. (2019) “Development of convolutional neural network and its application in image classification: a survey. Optical Engineering., 58(4): 040901.
CrossRef - Bin Liu, Jianxu Luo, Huan Huang. (2020). Toward Automatic Quantification of Knee Osteoarthritis Severity Using Improved Faster R-CNN. Int. J. Comput. Assist. Radiol. Surg., 15(3): 1–10.
CrossRef - N. Bayramoglu, A. Tiulpin, J. Hirvasniemi, M.T. Nieminen, S. Saarakkala. (2020). Adaptive Segmentation of Knee Radiographs for Selecting the Optimal ROI in Texture Analysis. Osteoarthritis and Cartilage., 28(9): 941-952.
CrossRef - Pingjun Chen, Linlin Gao, Xiaoshuang Shi, Kyle Allen. (2019). Fully Automatic Knee Osteoarthritis Severity Grading Using Deep Neural Networks with A Novel Ordinal Loss, Computerized Medical Imaging and Graphics 75., 84–92.
CrossRef - Marc Górriz, Joseph Antony, Kevin McGuinness, Xavier Giró-i-Nieto, Noel E. O’Connor. (2019). Assessing Knee OA Severity with CNN attention-based end-to-end architectures. Proceedings of the 2nd International Conference on Medical Imaging with Deep Learning., 102: 197-214.
- Christoph von Tycowicz. (2020). Towards Shape-Based Knee Osteoarthritis Classification Using Graph Convolutional Networks, 2020 IEEE 17th International Symposium on Biomedical Imaging (ISBI)., 750-753.
CrossRef - Rima Tri Wahyuningrum, Lilik Anifah, I Ketut Eddy Purnama, Mauridhi Hery Purnomo. (2019). A New Approach to Classify Knee Osteoarthritis Severity from Radiographic Images based on CNNLSTM Method. 2019 IEEE 10th International Conference on Awareness Science and Technology (iCAST).
CrossRef - Nicholas Bien, Pranav Rajpurkar, Robyn L. Ball, Jeremy Irvin, Allison Park, Erik Jones, Michael Bereket, Bhavik N. Pate, Kristen W. Yeom, Katie Shpanskaya, Safwan Halabi, Evan Zucker, Gary Fanton, Derek F. Amanatullah, Christopher F. Beaulieu, Geoffrey M. Riley, Russell J. Stewart, Francis G. Blankenberg, David B. Larson, Ricky H. Jones, Curtis P. Langlotz, Andrew Y. Ng, Matthew P. Lungren. (2018). Deep-learning-assisted diagnosis for knee magnetic resonance imaging: Development and retrospective validation of MRNet. PLOS Medicine., 15(11): e1002699.
CrossRef - Aleksei Tiulpin, Jérôme Thevenot, Esa Rahtu, Petri Lehenkari and Simo Saarakkala. (2018). Automatic Knee Osteoarthritis Diagnosis from Plain Radiographs: A Deep Learning-Based Approach. Scientific Reports., 8: 1-10.
CrossRef - J. Antony, et al. (2017) Automatic Detection of Knee Joints and Quantification of Knee Osteoarthritis Severity using Convolutional Neural Networks. Lecture Notes in Computer Science (Including Subseries Lecture Notes in Artificial Intelligence and Lecture Notes in Bioinformatics)., 1-15.
CrossRef - Shivanand S. Gornale, Pooja U. Patravali, Kiran S. Marathe, Prakash S. Hiremath. (2017). Determination of Osteoarthritis using Histogram of oriented Gradients and multiclass SVM, International Journal of Image, Graphics and Signal Processing (IJIGSP)., 9(12): 41-49.
CrossRef - V Ashwin Kumar; A. K. Jayanthy. (2016). Classification of MRI images in 2D coronal view and measurement of articular cartilage thickness for early detection of knee osteoarthritis. 2016 IEEE International Conference on Recent Trends in Electronics, Information and Communication Technology (RTEICT). 1907-1911.
- Sandeep Sharma; Sunpreet Singh Virk; Vibhor Jain. (2016). Detection of osteoarthritis using SVM classifications, 2016 3rd International Conference on Computing for Sustainable Global Development (INDIACom)., 2997-3002.
- Dattatray Ishwar Navale, Ravindra S. Hegadi and Namrata Mendgudli. (2015). Block Based Texture Analysis Approach for Knee Osteoarthritis Identification Using SVM. 2015 IEEE International WIE Conference on Electrical and Computer Engineering (WIECON-ECE)., 338-341.
CrossRef - Arnaud A. A. Setio, Francesco Ciompi, Geert Litjens, Paul Gerke, Colin Jacobs, Sarah J. van Riel, Mathilde Marie Winkler Wille, Matiullah Naqibullah, Clara I. Sanchez, Bram van Ginneken. (2016). Pulmonary Nodule Detection in CT Images: False Positive Reduction Using Multi-View Convolutional Networks. IEEE Transactions on Medical Imaging., 35(5): 1160 – 1169.
CrossRef - Marios Anthimopoulos, IEEE Member, Stergios Christodoulidis, IEEE Member, Lukas Ebner, Andreas Christe, Stavroula Mougiakakou. (2016). Lung Pattern Classification for Interstitial Lung Diseases Using a Deep Convolutional Neural Network. IEEE Transactions on Medical Imaging., 35(5): 1207–1216.
CrossRef - Mark J. J. P. van Grinsven, Bram van Ginneken, Carel B. Hoyng, Thomas Theelen, Clara I. Sanchez. (2016). Fast convolutional neural network training using selective data sampling: Application to hemorrhage detection in color fundus images. IEEE Transactions on Medical Imaging., 35(5): 1273 – 1284.
CrossRef - Qi Dou, Hao Chen, Lequan Yu, Lei Zhao, Jing Qin, Defeng Wang, Vincent CT Mok, Lin Shi and Pheng-Ann Heng. (2016). Automatic Detection of Cerebral Microbleeds from MR Images via 3D Convolutional Neural Networks. IEEE Transactions on Medical Imaging., 11(4): 1–14
- Junpyo Hong, Jared Vicory, Jörn Schulz, Martin Styner. (2016). Non-Euclidean classification of medically imaged objects via s-reps R. Medical Image Analysis., 31: 37–45.
CrossRef - Anju Rani, Deepti Mittal and Ritambhara. (2016). Detection and Classification of Focal Liver Lesions using Support Vector Machine Classifiers. Journal of Biomedical Engineering and Medical Imaging., 3(1): 21-34.
- Ammara Masood and Adel Al-Jumaily. (2015). Semi Advised SVM with Adaptive Differential Evolution Based Feature Selection for Skin Cancer Diagnosis. Journal of Computer and Communications., 3: 184-190.
CrossRef - Yang Song, Weidong Cai, Heng Huang, Yun Zhou, Yue Wang, David Dagan Feng. (2015). Locality-constrained Subcluster Representation Ensemble for Lung Image Classification. Medical Image Analysis., 22(1): 102-113.
CrossRef - Farzad Khalvati, Alexander Wong & Masoom A. Haider. (2015). Automated prostate cancer detection via comprehensive multi-parametric magnetic resonance imaging texture feature models. BMC Medical Imaging., 1–14.
CrossRef - Vanathi Gopalakrishnan, Prahlad G Menon, Shobhit Madan. (2015). cMRI-BED : A novel informatics framework for cardiac MRI biomarker extraction and discovery applied to pediatric cardiomyopathy classification. BioMedical Engineering., 14(2): 1–16.
CrossRef - G.N.Balaji, T.S.Subashini, and N.Chidambaram. (2015). Automatic classification of Cardiac Views in Echocardiogram using Histogram and Statistical Features. Procedia Computer Science ICICT 2014, 1569–1576.
CrossRef - Leo Ai, Xin Gao & Jinhu Xiong. (2014). Application of mean-shift clustering to Blood oxygen level dependent functional MRI activation detection. BMC Medical Imaging., 14(6): 1–10.
CrossRef - Manju B, K. Meenakshy, and R. Gopikakumari. (2014). Prostate Disease Diagnosis from CT images using GA optimized SMRT based Texture Features. Procedia Computer Science (ICICT 2014). 1692–1699.
CrossRef - Andreia Andrade, José Silvestre Silva, Jaime Santos, Pedro Belo-Soares. (2012). Classifier Approaches for Liver Steatosis using Ultrasound Images. Procedia Technology HCIST 2012., 763–770.
CrossRef - João Miguel Pires Dias, Carlos Manta oliveira, Luís A. da Silva Cruz. (2012). Evaluation of retinal image gradability by image features classification. Procedia Technology HCIST 2012, pp. 865–875.
CrossRef - M A Dabbah, J Graham, I N Petropoulos, M Tavakoli, R A Malik. (2011). Automatic analysis of diabetic peripheral neuropathy using multi-scale quantitative morphology of nerve fibres in corneal confocal microscopy imaging. Medical Image Analysis., 15(5): 738–747.
CrossRef - Hesheng WangBaowei Fei. (2009). A modified fuzzy C-means classification method using a multiscalediffusion filtering scheme. Medical Image Analysis., 13(2): 193–202.
CrossRef - Mutlu Mete, Leah Hennings, Horace J Spencer and Umit Topaloglu. (2009). Automatic identification of angiogenesis in double stained images of liver tissue. BMC BioInformatics., 10(11): 1–14.
CrossRef - Meindert Niemeijer, Michael Abramoff, and Bram van Ginneken. (2006). Image structure clustering for image quality verification of color retina images in diabetic retinopathy screening. Medical Image Analysis., 10: 888–898.
CrossRef - Suyash P. Awate, Tolga Tasdizen, Norman Foster, and Ross T. Whitaker. (2006). Adaptive Markov modeling for mutual-information-based, unsupervised MRI brain-tissue classification. Medical Image Analysis, 10: 726–739.
CrossRef

