
Manuscript accepted on :03-02-2021
Published online on: 04-02-2021
Plagiarism Check: Yes
Reviewed by: Dr Paola Vidal Rojo
Second Review by: Dr. Jyothsna Rao
Final Approval by: Dr. Ayush Dogra
Suman Vimal1 , Surendra Kumar Agarwal1 , Surabhi Yadav1 , Gauranga Majumdar1, Balraj Mittal2 , Neeraj Sinha3 and Renuka Ranjan3
1Department of Cardiovascular and Thoracic Surgery, SGPGIMS, Raibareli Road, Lucknow-226014, India
2Babasaheb Bhimrao Ambedkar University, Lucknow-226025, India.
3Centre of Biomedical Research, SGPGIMS, Raibareli Road, Lucknow-226014, India.
Corresponding Author E-mail: drskagarwalpgi@gmail.com
DOI : https://dx.doi.org/10.13005/bpj/2101
Abstract
Congenital heart disease (CHD) is one of the most important causes of the death of children and young adults. Most of the patients do not survive past their teen years. This occurs either due to delay in diagnosis or no diagnosis at all. In recent times, several studies have shown the importance of biomarkers in the prediction of such defects. These biomarkers give the real time snapshot of the on going processes inside the cells and can significantly support the diagnosis of CHD. The present experiment was designed as an observational single centre pilot study to identify and establish the diagnostic metabolic signatures associated with the congenital heart diseases. Metabolic profiles of sera collected from 35 cyanotic congenital heart disease patients and 15 controls were obtained using high-resolution 1D 1H CPMG and NMR spectra. The metabolic profiles were compared using multivariate statistical analysis to identify the disease specific metabolic disturbances associated with cyanotic heart disease. The results show perturbation in several metabolites in cyanotic CHD patients versus controls. The discriminatory metabolites were further analysedwith area under receiver operating characteristic (AUROC) curve and identified five metabolic entities (i.e.valine, glucose, glutamine, creatinineand PUFA) which could differentiate cyanotic CHDs from controls with higher specificity.In conclusion, untargeted metabolic approach proved to be helpful in identifying and differentiating disease causing metabolites in cyanotic cases from controls.
Keywords
Congenital Heart Disease; CHD; Cyanotic; Differential Diagnosis; Metabolic Signatures; NMR
Download this article as:| Copy the following to cite this article: Vimal S, Ranjan R, Yadav S, Majumdar G, Mittal B, Sinha N, Agarwal S. K. Serum Metabolomics Profiling to Identify Novel Biomarkers for Cyanotic Heart Disease. Biomed Pharmacol J 2021;14(1) |
| Copy the following to cite this URL: Vimal S, Ranjan R, Yadav S, Majumdar G, Mittal B, Sinha N, Agarwal S. K. Serum Metabolomics Profiling to Identify Novel Biomarkers for Cyanotic Heart Disease. Biomed Pharmacol J 2021;14(1). Available from: https://bit.ly/2YNi856 |
Introduction
Congenital heart disease (CHD) comprises one of the major diseases in pediatric age group and is one of the leading causes of death in children with congenital malformations, having a range of symptoms like excessive sweating, extreme tiredness, fatigue, poor feeding, rapid heartbeat, shortness of breath, chest pain, blue tinge to the skin (cyanosis), and clubbed fingernails.[1, 2]The prevalence of CHD varies globally such as it is recorded significantly higher in Asia as compared to other continents. So a prevalence of 8-12 per 1000 live birth has been accepted as general prevalenceworldwide as per published data.[3-5]
Congenital heart diseases are broadly classified into three types: a) cyanotic heart disease in which cyanosis in infants appears due to mixing of oxygenated and deoxygenated blood and that includes transposition of the great arteries (TGA), tetralogy of Fallot (TOF), tricuspid atresia, pulmonary atresia, Ebstein’s anomaly of the tricuspid valve, double outlet right ventricle (DORV), persistent truncus arteriosus (PTA) and total anomalous pulmonary venous, b) left-sided obstructive lesions which include hypoplastic left heart syndrome (HLHS), mitral stenosis, aortic stenosis, aortic coarctation and interrupted aortic arch (IAA) and c) septation defects which affects the septation of the atria (atrial septation defects, ASDs), septation of the ventricles (ventricular septal defects, VSDs) or formation of structures in the central part of the heart (atrioventricular septal defects, AVSDs).[6]
Out of which, TOF is a classical cyanotic CHD caused by a subpulmonary obstruction with shunting mainly from the right to the left ventricle via the VSD leading to an ejection of poorly oxygenated blood into the aorta with a prevalence of 1/3000 births. The morphological phenotype is characterized by four malformations: ventricular septal defect (VSD), narrowing of the right outflow tract (pulmonary stenosis), hypertrophy of the right ventricle (RV) and dextraposition of the aorta to the right side over the VSD (an overriding aorta).TOF patients have signs of cardiomyocyte hypertrophy, fibrosis, and cardiomyocyte degeneration due to high RV pressure and hypoxemia.[7, 8]Diagnosis of the patients with CHD remains variable as some are prenatally diagnosed, some become sick after birth and some are asymptomatic and are not diagnosed at all. The diagnosis of congenital heart disease in children or adults are performed by a) Fetal Echocardiogram, b) Echocardiogram, c) Electrocardiogram, d) Chest X-ray, e) Pulse Oximetry, f) Cardiac Catheterization.[9, 10]
NMR is a technique where Magnetic spin property, which is a mangentic moment caused by spin of elementary particle, is possessed by some nuclei due to which it can resonate to different energy levels depending on the type of nuclei such as 1H, 13C and 31P which are commonly used for biological metabolites. This property is the basis of NMR spectroscopy.[11]1H NMR spectroscopy is mainly used in metabolomics because of its quick acquisition and constant performance. That’s why NMR spectroscopy has been proved useful in determining metabolic changes such as energetics in permeated hearts, determining levels of metabolites such as creatine kinase, ATP, phosphates and intra cellular pH activity to list some.[12-14]These parameters have been exploited in studies of myocardial ischemia, diabetes mellitus, reperfusion injury and heart failure.[15-21]
Materials and Methods
Sample collection
Serum samples were collected from 50 patients with cyanotic congenital heart diseases (n = 35) and 15controls (n=15)attending the Department of Cardiovascular and thoracic surgery, SGPGIMS, Lucknow, Uttar Pradesh, India, between May 2017 to April 2019. The protocol for this pilot study was sanctioned by the Institutional Research Ethics Committee, SGPGIMS, Lucknow, and informed consents were obtained from all patients or each child’s parent(s) or guardian to the participation of their child in the study if the patients were minor and were not able to give their consent.
Sample preparation and NMR Measurements
Early in the morning, venous blood samples were obtainedfrom all participants to minimize the effect of dietary factors and inter-individual differences in metabolomic results. Blood samples were stored in vacutainer tubes for 30 minutes at room temperature for clotting. At 13,000 rpm, coagulated blood samples were centrifuged for 10 minutes to isolate the supernatant serum, which was then stored at a temperature of -80 ° C until the NMR tests were conducted.
NMR experiments were conductedat 300 K on the BrukerAvance III 800 MHz NMR spectrometer (equipped with Cryoprobe). The frozen serum samples were thawed and centrifuged at room temperature at 10,000 for 5 minutes before the NMR experiments to extract precipitates if any. The aliquots containing 350 μL of serum were then added to 150 μL of saline buffer solution (100% D2O, 0.05%NaN3, 20 mM sodium phosphate buffer, 0.9% NaCl,pH 7.4) to reduce pH variance. Buffer combined serum specimens were vortexedand 500μL of sample was transferred into a 5 mm NMR tube (Wilmad Glass, USA). Acoaxial insert containing a specified concentration of 0.1 mM TSP (Sodium Salt 3-trimethylsilyl-(2,2,2,3,3-d4)-propionic acid) dissolved in deuterium oxide (D2O) was introduced separately into all NMR tubes for both locking and chemical shift referencing purposes. Deuterium oxide (D2O) and sodium salt of sodium trimethylsilpropionic acid-d4 (TSP) used for NMR spectroscopy were obtained from Sigma-Aldrich (Rhode Island, USA). One-dimensional 1H NMR spectra were recorded using the Carr – Purcell – Meiboom – Gill (CPMG) pulse sequence (cpmgpr1d, standard Bruker pulse program), with 64 transients and 5s of relaxation delay. A total of 65k data points was collected with a spectral width of 20ppm at receiver gain value of 71.8 and echo time of 100 µs repeated in loop of 300 resulting in a total duration of 30ms effective echo time.
Statistical analysis
Before the multivariate data analysis, all 1D 1H CPMG NMR spectra were manually phased, baseline corrected and referenced internally to methyl lactate resonance at δ 1.3102. CPMG spectra in the chemical shift area d(0.6-8.44) ppm are bind to 0.01 ppm spectral buckets and integrated automatically using AMIX software (Version 3.8.7, Bruker GmbH, Germany). The chemical shift area d(4.56-5.14) skewed due to water suppression was omitted from the CPMG data matrix in order to avoid the effects of inadequate water suppressionand the dimension of the system was reduced to 726 bins. The integrated spectral bins have been further normalized to the total intensity of the spectrum. The resulting data matrix created with AMIX software was then exported to Microsoft Office Excel 2010, translated to CSV (comma-separated values) format, incorporated with sample and category details and finally imported into MetaboAnalyst 3.0 for multivariate analysis in which the data matrix was scaled to Pareto variance.Metaboanalyst is a freely available, user-friendly, web-based research tool for high-performance metabolomics studies (opened to educational users from the University of Alberta, Canada).
Results
Study subjects’ Characteristics
The demographic details of the patients and controls are given in Table1. The samples were collected according to the WMA declaration of Helsinki by taking into consideration the inclusion and exclusion criteria set for the study.The serum samples were obtained from thirty-five (n=35) cyanotic patients (6 females, 29 males, 11.2 ± 4.9 years of age) who fulfilled the inclusion criteria: cyanosis, difficulty in breathing, clubbed finger nails, and undergoing heart surgery for TOF repair. Since healthy children are not available in hospital set up and also ethically should not be subjected to research, the control group was selected from the patients with health problems other than congenital heart diseases and which did not show any signs of inclusion criteria laid down for CHD diagnosis. So fifteen (n=15) such patients were used as control subjects (3 females, 12 males, 10.6 ± 3.39 years of age).The cyanotic cases fell into the grade II and most of controls were in grade I ofdyspnea. Also the cyanotic group did not present any family history of the disease. Both the cases and controls were normotensive and were without any history of hypertension. Both the groups did not have diabetes. There was no history of smoking, drinking. The presence of smoking, diabetes, hypertension were assessed on the basis of subjects’ questionnaires and hospital records.
Table 1: The demographics and clinical features of Cyanotic patients and Control samples
| Parameters/Variables | Cyanotic CHD
(n=35) |
Control
(n=15) |
P-value |
| Gender (M:F) | 6:29 | 3:12 | – |
| Age | 11.2 ± 4.83
(range=2-20) |
10.6 ± 3.28
(range=6-20) |
0.75 |
| AST | 136.62 ± 297.28 | 46.73 ± 23.74 | 0.24 |
| ALT | 141.31 ± 340.04 | 43.4 ± 26.84 | 0.27 |
| Cyanosis | Yes | No | – |
| Clubbing | Yes | No | – |
| Hypertension | No | No | – |
| Diabetes | No | No | – |
| Dyspnea (grade) | II | I | – |
1H-NMR spectra of serum
Inspection of the serologic NMR spectra revealed the wide variety of metabolite resonances present in the spectra. Representative 1H NMR spectra of serum samples from cyanoticand control subjects are shown in Figure 1. A number of metabolites, including a range of amino acids, saccharides (Glucose), energy metabolism related molecules (Lactate, Creatine, Creatinine), and others (Cholines, Methanol,LDL, VLDL, Amines and Amides,) were identified based on the Human Metabolome Database (HMDB: http://www.hmdb.ca/), the Chenomx NMR suite (Chenomx Inc, Edmonton, AB, Canada) and previously published references[22-24], as well as 2D 1H−13C HSQC and 1H−1H TOCSY NMR experiments.
 |
Figure 1: Representative 800 MHz1H CPMG NMR spectra of serum samples from controlsandcyanotic patient. |
Multivariate data analysis and the selection of potential metabolic markers
With the purpose of demonstrating signifcant differences between cyanotic and control, The NMR spectra information was analyzed using multivariable statistics. Metabolomic difference by comparing the numerical integration was observed and partial least square discrimination analysis (PLS-DA)-based profiling was used to explore the inherent differences between the cyanotic and control group.PLS discriminant analysis(PLS-DA) is a supervised method of PLS rgression.[25]{Rajalahti, 2011 #91}The samples from two distinctgroups were separated and classifed into two distinct clusters presented in the PLS-DA score plot (Figure 2A); each point represents an individual sample (to show the group clusters). 10-fold cross-validation (CV) was performed to evaluate the statistical robustness of the study and the Q2 and R2 values were deduced.The Q2 provides an estimate of the predictive strength of PLS-DA models with a minimum separation threshold of Q2>0.5.Increased R2 values (0<R2<1) often represent power and variance in prediction.Our model scored high R2~ 0.9 and Q2~0.8, confirming good predictive power (Figure 2A and 2C). Permutation tests (100 repeats) yielded a very low p≤ 0.01, suggesting that none of the distributions produced by the permutation data were stronger than the statistic observed based on the original data.To determine changed metabolites and considering the highinformation content and complexity of the spectra, partial least squares discriminant analysis (PLS-DA) was used to amplify the subtle differences due to the abnormal state of cyanotic samples. The supervised model of PLS-DA could develop a better separation into two clusters and contribute to the discovery of biomarkers. The group of cyanotic condition exhibited a perfect separation from the controls in the PLS-DA scores plot (Figure 2A), as well as in permutation test(Figure2B). The metabolites responsible for a significant contribution to the separation of two groups were identified by PLS-DA analysis and sorted by increasing the VIP score (only those with a significant VIP value >1 are included). Taking a VIP cut-off at 1,16 features were found to be significant discriminators of cyanotic pateints from control(Figure 2D).After validating our hypothesis that cyanotic and controlgroup can be differentiated based on T2 filtered one dimensional 1H CPMG NMR spectra, a univariate analysis was executed to confirm the statistical significance of the distinctive metabolite. The Wilcoxon-Mann-Whitney test was applied to evaluate significant differences (p< 0.05) of metabolite candidates and to eliminate variables without significant differences between the two groups. As summarized in Table 2, there were 16 specific metabolites that can distinguish cyanotic from control.Among the 16 metabolites that passed the Wilcoxon-Mann-Whitney test, the abundances of 13 metabolites, including Leucine, Valine, Ethanol, 3-HB, Alanine, Acetate, Acetone, Glutamte, Glutamine, Choline, Betaine, Glucose and Glycine were higher in the cyanotic group than in the controlgroup. Meanwhile, the only3 metabolites, including Creatinine, Lactate and PUFAs were lower in the cyanotic group than in the control group.
 |
Figure 2: (A) Partial Least Square Discriminant Analysis (PLS-DA) classification model discriminating the cyanotic patients from control group. |
Table 2: List of signifcantly altered metabolites between cyanotic and control serum samples.
| S.No | Metabolite | ppm | Cyanotic vsControl | ||
| VIP | AUC | Variation | |||
| 1 | Leucine | 0.93 | 1.27 | 0.73 | ** |
| 2 | Valine | 1.01 | 2.11 | 0.83 | **** |
| 3 | Ethanol | 1.16 | 1.43 | 0.72 | * |
| 4 | 3-HB | 1.18 | 1.68 | 0.70 | * |
| 5 | Alanine | 1.45 | 2.16 | 0.74 | ** |
| 6 | Acetate | 1.89 | 1.09 | 0.79 | ** |
| 7 | Acetone | 2.19 | 1.51 | 0.74 | *** |
| 8 | Glutamate | 2.32 | 1.00 | 0.72 | * |
| 9 | Glutamine | 2.42 | 1.99 | 0.84 | **** |
| 10 | Choline | 3.17 | 1.25 | 0.73 | * |
| 11 | Betaine | 3.24 | 1.82 | 0.71 | * |
| 12 | Glucose | 3.48 | 1.66 | 0.82 | **** |
| 13 | Glycine | 3.53 | 2.34 | 0.79 | *** |
| 14 | Creatinine | 4.03 | 1.42 | 0.84 | ¯**** |
| 15 | Lactate | 4.09 | 2.61 | 0.76 | ¯** |
| 16 | PUFA | 5.27 | 2.63 | 0.85 | ¯** |
Note: The up and down arrows represent, respectively, increased and decreased metabolite levels in Cyanotic patients compared to controls. The discriminatory metabolite entities were identified based on the criterion if their VIP scores are more than 1.0 and validated further using p-value and AUROC analysis. *represents a statistically significant difference *(p-value <0.05), ** (p-value <0.01), *** (p<0.001), ****(p<0.0001).
Correlation analysis of potential biomarkers
To investigate the relationship among the potential markers metabolite, their quantities were correlated separately for patients and controls were correlated using Pearson’s correlation (Figure 3) with Metaboanalyst 3.0[26], an online data tool. A positive correlation showed the relationship of the significant metabolites with certain pathways that exerted influence on the cyanotic condition and was discerned with a red color, whereas a negative correlation suggested the metabolites may be from different pathways and was indicated with a blue color.[27]It is clear from the comparison of the two correlation plots in Figure 4 that the significant and altered changes between the cyanotic and control group were observed.In this study, we were focusing on the inverse correlation of metabolite between the cyanotic and controlgroup. Remarkably, altered metabolic correlation in cyanotic and control groups was observed for only one marker metabolite, as depicted in Figure 2 with a red asterisk. Glutamine was positively correlated with Valine and PUFA in a cyanotic group, while in control group, glutamine was negatively correlated.In addition, a number of other altered correlations were observed in cyanotic group for marker metabolite when compare with the control group.From the correlation difference matrix, it is apparent that the marker metabolite were significantly correlated with potential marker metabolite in cyanotic and control group as depicted in Figure 4with black asterisk (*).Correlation analysis of serum metabolites displaying significant difference was performed to gain insight into the pathogenic characteristics and pathways involved.
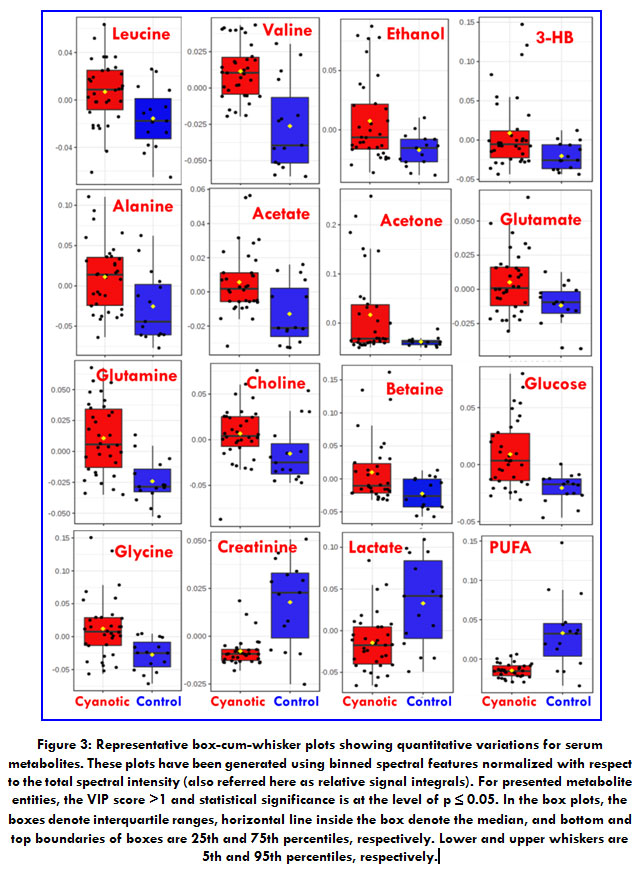 |
Figure 3: Representative box-cum-whisker plots showing quantitative variations for serum metabolites. |
These plots have been generated using binned spectral features normalized with respect to the total spectral intensity (also referred here as relative signal integrals). For presented metabolite entities, the VIP score >1 and statistical significance is at the level of p ≤ 0.05. In the box plots, the boxes denote interquartile ranges, horizontal line inside the box denote the median, and bottom and top boundaries of boxes are 25th and 75th percentiles, respectively. Lower and upper whiskers are 5th and 95th percentiles, respectively.
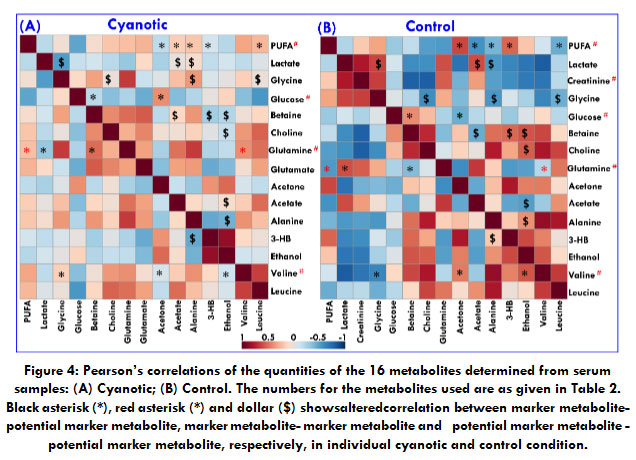 |
Figure 4: Pearson’s correlations of the quantities of the 16 metabolites determined from serum samples: (A) Cyanotic; (B) Control. |
The numbers for the metabolites used are as given in Table 2. Black asterisk (*), red asterisk (*) and dollar ($) shows altered correlation between marker metabolite-potential marker metabolite, marker metabolite- marker metabolite and potential marker metabolite – potential marker metabolite, respectively, in individual cyanotic and control condition.
Pathway analysis
The metabolic pathways were implemented based on the above 16 differentiating metabolites. To get more information about the biomarkers, the KEGG PATHWAY database of pathway analysis module of metaboanalyst was used and we found that the 16 altered metabolites with the standard of p values<0.05 and impact factor threshold>0 are impacted more seriously involved in 6 metabolic pathways including D-Glutamine and D-glutamate metabolism, Alanine, Aspartate and Glutamate metabolism, Glycine, Serine and Threonine metabolism, Arginine biosynthesis, Glutathione metabolism and Glyoxylate and Dicarboxylate metabolism with impact factors of 0.5, 0.3109, 0.29611, 0.11675, 0.10839 and 0.10582 respectively(Figure 5).
 |
Figure 5: Significantly altered metabolic pathways in cyanotic patient. |
All matched pathways are shown according to p values from the pathway enrichment analysis (y axis) and pathway impact values from the pathway topology analysis (x axis).[58]Color gradient and circle size indicate the significance of the pathway ranked by p value (yellow: higher p values and red: lower p values) and pathway impact values (the larger the circle the higher the impact score). Only the significantly affected pathways with low p value and high pathway impact score are showed.
Diagnostic capability evaluation of biomarker panel
Biomarkers with higher sensitivity and specifcity are expected to be developed. ROC analysis was applied to evaluate the accuracy of diagnosis based on the identifed potential biomarkers or combinations and the area under the curve (AUC) of ROC; 0.5<AUC<0.7, 0.7<AUC<0.9, AUC>0.9 explain a low, fair, and superior accuracy of diagnosis, respectively. AUCs were < 0.8 for most biomarkers, indicating a poor prediction likely due to a single metabolite’s inability to predict a disease accurately or a small sample size.Subsequently, by selecting the metabolites demonstrating an AUC>0.8, some combinations of potential biomarkers, including the biomarker panel mentioned above that could provide higher predictive power than single one, were examined. The AUC of the biomarker panel containing 5 metabolites indicated the highest predictive ability of cyanotic condition(Table 2).The AUC value of the established model is 0.957 (Figure 6), which showed a good ability for discriminating cyanoticcondition from the control.
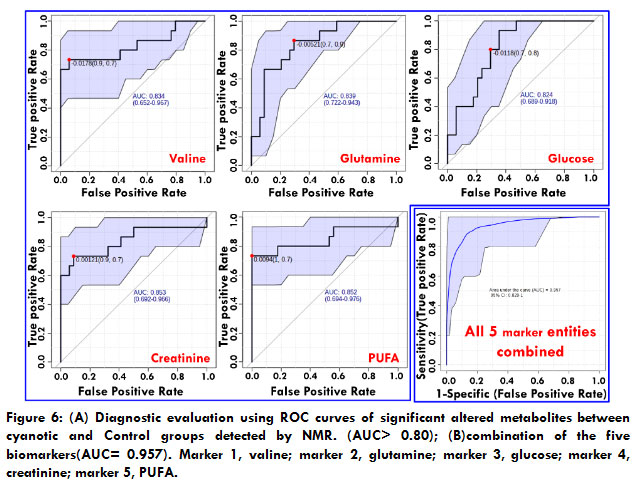 |
Figure 6: (A) Diagnostic evaluation using ROC curves of significant altered metabolites between cyanotic and Control groups detected by NMR. (AUC> 0.80); (B)combination of the five biomarkers(AUC= 0.957). Marker 1, valine; marker 2, glutamine; marker 3, glucose; marker 4, creatinine; marker 5, PUFA. |
Discussion
Metabolomics profiling has recently emerged as a powerful screening method that can aid in the prompt diagnosis of various cardiovasculardiseases. Despite the considerable investigations into physiological, epigenetic, and signaling pathway changes in cyanotic group, specific disturbances characterizing the cardiac metabolic state remain unclear. Our study provides insight into cyanotic metabolic signatures with the potential for unraveling novel biomarkers for diagnosis, prognosis, and prediction of disease.In the present study, 1H NMR-based metabolomics approach was conducted to demonstrate metabolic expression differences between cyanotic and control groups. Subsequent analysis of the metabolite profiles of serum samples from cyanotic patients could distinguish patients from disease controls using PLS-DA modelling and provide a fingerprint of metabolic changes that characterized the disease, and highlighted the potential of metabolomics analysis in the evaluation of a disease condition. To the best of our knowledge, this is the first published report on serum metabolomics in cyanotic heart disease. The metabolite profiles of serum samples allowed differentiation of cyanotic patients from controls.The 1H NMR analysis enabled the identification of a total of 16 metabolites as contributors to the discrimination of cyanotic and control groups. About five metabolic biomarkers were highly possible to be associated with cyanotic group, which showed better performance in terms of both specificity and sensitivity. These metabolites included Valine, Glutamine, Creatinine, Glucose, and PUFA. In our study, three unique metabolic pathways of Glutamine and Glutamate metabolism, and Alanine, Aspartate and Glutamate metabolism, Glycine, Serine and Threonine metabolism are identifed from cyanotic and control group (Figure 5). The altered metabolites related to cyanotic group are most involved in energy metabolism and amino acids metabolism. We found that the potential biomarkers were primarily correlated with lipid metabolism dysfunction, dysfunction of the energy metabolism, amino acid dysfunction and dysfunction of the glucose metabolism in the pathological development of the cyanotic condition.
In recent years, it has become increasingly clear that heart related problem is characterized by alterations in energy metabolism. The striking image that emerges for cyanotic patients is one of the profound impairments in processing a wide range of metabolic fuels, likely reflecting a significant energy deficit that leads to impaired cardiac function in these patients.Glucose is the principal source material for cell production of ATP.It is mainly produced by the metabolism of glucose under normaxia condition, which consists of three relay pathways: the cycle of citric acid (TCA cycle, Krebs cycle), the cytoplasmic oxygen – independent glucose pyruvate pathway, and the oxygen-dependent electron transmission chain.The reduced level of oxygen in cyanotic patients is expected to significantly affect the TCA cycle as it is oxygen-dependent.Under hypoxia conditions, anaerobic glycolysis begins to play a dominant role under ATP production which leads to a glucose disorder.Also, a severe reduction of the serum Lactate (a significant source of pyruvate under normal aerobic conditions) further supports the assumption that the TCA cycle was “pyruvate-starved” in cyanotic condition.Lactic acid, a reduced product of pyruvate metabolism, is lower following decreased glycolytic flux;[28]and plays a pivotal role for tissue energy requirements in the TCA cycle flux.[29, 30]Therefore, these depressed metabolite may reflect the impaired energy metabolism and biosynthesis linked to the TCA cycle in cyanotic patients. Increasing Glucose and a low level of Lactate in the serum seem to confirm the impairment of the important energetic pathways in patients with cyanosis.
Creatine, which is synthesized in the liver and the kidney, is transported through the blood and taken up by high energy demanding tissues.It may reflect energy metabolism changes in the muscles.Creatine has the ability to increase phosphocreatine’s muscle stores, potentially increasing the ability of the muscle to resynthesize ATP from ADP to meet growing demands for energy.Creatinine is derived from creatine and phosphocreatine. Low creatinine levels are a marker for high HDL-C and low low-density lipoprotein cholesterol levels.[31]Thus, the presence of creatinine and an unsaturatedlipid structure could indicate that our metabolite risk score is a marker for an unfavorable lipid profile. Therefore, the level of creatinine also reflect the disorder of energy metabolism in cyanotic patients.
The elevated levels of ketone bodies due to dysregulated fat metabolism are another common metabolic region that could also be associated with energy metabolism stress.All 3-hydroxybutyrate, acetate and acetone are ketone bodies primarily synthesized from the oxidation of fatty acids and known for their function in the metabolism of glucose and lipids.[32]The low energy yield of the metabolism of glucose causes cells to use fat as a source of energy and release ketone bodies as end products.Consequently, elevation levels in ketone in organisms indicate an increase in the catabolism of fatty acids that are consistent with the incapacity of the TCA cycle to fully metabolize acetyl CoA.[33]In this study, the levels of polyunsaturated fatty acid (PUFA) such in the patients with cyanotic were lower than those in the control groups, indicating that the oxidation of PUFA was enhanced and the level of non-PUFA was decreased.Studies have shown that because of myocardial ischemia and hypoxia in patients with CHD, the intracellular energy receptor AMP-activated protein kinase (AMPK) is activated at this time, which can regulate the uptake and oxidation of fatty acid.[34]
One previous study showed that the principal metabolic changes observed using NMR were derived both from lipoprotein and choline lipids in patients with CVD.[35]Betaine and glycine are both derived from choline. Betaine is synthesized by choline dehydrogenase and betaine aldehyde dehydrogenase in gut mucosa, liver and kidney[36]and is secreted in large quantities during the neonatal period.[37]Moreover, a possible link between the methyl metabolism and oxidative stress in preterm infants was hypothesized by earlier research workhighlighting the relationship between the Choline-Betaine-Glycine pathway and the response to oxidative stress through the provision of glycine for glutathione synthesis.[38]Previousresearch also observed an increase in choline and betaine levels in patients undergoing coronary angiography.[39]In cyanotic patients, such an upregulation in these metabolites, linked via a specific biochemical pathway, adds credence to the current results recorded herein for observed serum levels in Choline and Betaine.
Amino acids and their derivatives, among the most important basic substances in the life of organisms, play an important role in human metabolism. Moreover, amino acid metabolism as a precursor of energy metabolism can increase ATP formation.[40]It has been reported that the abnormality in amino acid metabolism is related to cardiovascular diseases and is one of the basic metabolic pathways in vivo.[41-43]In this study, two biomarkers with linear trends appeared simultaneously in the amino acid metabolic pathway, which also suggests that amino acid metabolism is the focus of cyanotic group.Leucine, Isoleucine and Valine are essential amino acids with branch points (BCAA) characterizing the carbon structures.These three amino acids are essential to human life and are especially involved in the metabolism of stress, energy and muscles.BCAA can be an important source of calories, particularly leucine, and is superior to the ubiquitous intravenous D-glucose as fuel.[44]Our results showed that compared with those of control, the serum levels of Glutamine, Glutamate, Isoleuicine, leucine, Alanine, Valine, and Glycine in cyanotic group were significantly increased.As the most ample amino acid in the serum, Glutamine is the most important amino acid gluconeogenic precursor for adding new carbon to the glucose pool.[45]The glutamine is the central part of the TCA cycle and plays an important role in many metabolic pathways, especially in maintaining the amino acid homeostasis. Glutamate and glutamine, as well as the other BCAAs, can serve as anaplerotic substrates that refuel the TCA cycle via intraconversion into a-ketoglutarate or succinyl-CoA, respectively.[46]In addition, guanosine triphosphate (which can be converted to ATP) can be generated through substrate – level phosphorylation in the absence of oxygen during the Glutamate and Glutamine metabolism.[46]Previous studies have shown that increased glutamate has been found to be linked to ongoing ischemic stroke.[47]Researchers, previously, used metabolomic profiling to compare cardiac extraction and plasma substrates, and demonstrated that patients with CHD had decreased concentration of glutamate/glutamine.[48]Valine has been also associated with metabolic risk factors and future cardiovascular events.[49, 50]However, we also noted an increase in alanine release.Alanine is highly concentrated in the muscle and one of the most essential amino acids produced by the muscle, which acts as a major source of energy.Net alanine production is likely to occur through pyruvate transamination, with glutamate in the alanine transaminase reaction as the nitrogen donor.Taken together, this metabolic profile is consistent with impaired glucose oxidation during this period and subsequent pyruvate diverting away from the TCA cycle and into transaminase reactions to Alanine.In the cyanotic patients, the levels of Alanine, Leucine, Valine, Glutamine, glutamate and glycine were all elevated. Previous studies have shown that metabolomic analysis of failing mouse hearts and human plasma from cardiometabolic patients showed that amino acid levels were increased.[49, 51-54]These changes suggest an association between amino acid levels and the progression of heart failure and have been attributed to increased protein breakdown in skeletal muscle. During heart failure, skeletal muscle serves as an additional amino acid source for the heart.[55-57]The overall pattern of changes was strongly suggestive for a branch chain amino acid metabolic dysregulation in cyanotic patients.
Conclusion
In the present study, the 1H NMR-based metabolomics method combined with multivariate data analysis was used to distinguish independently cyanotic patients from controls with high reliability. 16 potential biomarkers related to cyanotic disease were found by analysis and using 5 of the 16 metabolites as the biomarkers in diagnosing the cyanotic disease exhibited excellent diagnostic value (AUC>0.95). The metabolomics approach is proved to be useful in improving the under diagnosis of cyanosis. Hopefully, novel cyanotic scores could be developed in the future that are also based on metabolic fingerprinting, or that at least consider altering the metabolomic profile as an early predisposing condition. The untargeted approach, that is, the unravelling of the entire serum-linked metabonome of the subject, may therefore suggest a targeted analysis of a small subset of metabolites that could be included in the standard clinical practice.
At this point, owing to the lack of follow – up samples, we cannot demonstrate a real improvement in risk assessment by adding all or some of the new metabolites mentioned in this research to the cyanotic risk panel. However, in summary our study shows that metabolic profiling is a powerful tool for identifying cyanosis and may be useful in managing cyanotic conditions.
Acknowledgement
The authors would like to thank University Grants commission, New Delhi, India, for grant support to carry out this work (Grant ID: F1-17.1/2015-16/RGNF-2015-17-SC-UTT-20907) and Council of Scientific and Industrial Research, New Delhi, India (Grant ID: 09/916(0085)2015-EMR-I).
Conflict of Interest
On behalf of all authors, the corresponding authors state that there is no conflict of interest.
References
- B, E., Congenital heart disease in infancy and childhood. Heart Diseases; Text Book of Cardiovascular Medicine. Philadelphia, PA: W. B. Saunders Co, 2007. 8th ed.
- NHS, Congenital heart disease. 12 June 2018.
- Bernier, P.-L., et al. The challenge of congenital heart disease worldwide: epidemiologic and demographic facts.Seminars in Thoracic and Cardiovascular Surgery: Pediatric Cardiac Surgery Annual, 2010;13(1):26-34.
CrossRef - Van Der Linde, D., E.E.M. Konings, and M. Slager, , Witsenburg, M., Helbing, W. a., Takkenberg, JJM & Roos-Hesselink, JW Birth prevalence of congenital heart disease worldwide: A systematic review and meta-analysis. J. Am. Coll. Cardiol. 2011 Nov 15;58(21):2241-2247.
CrossRef - Hoffman, J.I.E., The global burden of congenital heart disease. Cardiovascular journal of Africa. 2013 May 24(4):141-5.
CrossRef - Bruneau, B.G., The developmental genetics of congenital heart disease. Nature, 2008. 451(7181):943-948.
CrossRef - Hoffman, J.I.E. and S. Kaplan, The incidence of congenital heart disease. Journal of the American college of cardiology, 2002. 39(12):1890-1900.
CrossRef - Lahm, H., et al., Tetralogy of fallot and hypoplastic left heart syndrome-complex clinical phenotypes meet complex genetic networks. Current genomics. 2015 June 16(3):141-158.
CrossRef - Desai, K., E.J. Rabinowitz, and S. Epstein, Physiologic diagnosis of congenital heart disease in cyanotic neonates. Current opinion in pediatrics. 2019 Apr31(2):274-283.
CrossRef - Mayoclinic, Congenital heart defects in children.
- Bothwell, J.H.F. and J.L. Griffin, An introduction to biological nuclear magnetic resonance spectroscopy.Biol Rev Camb Philos Soc. 2011 May86(2):493-510.
CrossRef - Ackerman, J.J.H., et al., Nmr studies of metabolism in perfused organs. Philosophical Transactions of the Royal Society of London. B, Biological Sciences, 1980. 289(1037):425-436.
CrossRef - Gadian, D.G., et al., Phosphorus nuclear magnetic resonance studies on normoxic and ischemic cardiac tissue. Proceedings of the National Academy of Sciences, 1976. 73(12):4446-4448.
CrossRef - Bailey, I.A., et al., Activity of phosphorylase in total global ischaemia in the rat heart A phosphorus-31 nuclear-magnetic-resonance study. Biochemical Journal, 1981. 196(1):171-178.
CrossRef - Nunnally, R.L. and D.P. Hollis, Adenosine triphosphate compartmentation in living hearts: a phosphorus nuclear magnetic resonance saturation transfer study. Biochemistry, 1979. 18(16):3642-3646.
CrossRef - Kusuoka, H., et al., Mechanism of early contractile failure during hypoxia in intact ferret heart: evidence for modulation of maximal Ca2+-activated force by inorganic phosphate. Circulation research, 1986. 59(3):270-282.
CrossRef - Orchard, C.H., D.G. Allen, and P.G. Morris, The role of intracellular [Ca2+] and [H+] in contractile failure of the hypoxic heart. Advances in myocardiology, 1985. 6:417-427.
- Chatham, J.C., et al., Depletion of myocardial glutathione: its effects on heart function and metabolism during ischaemia and reperfusion. Cardiovascular research, 1988. 22(11):833-839.
CrossRef - Yoshiyama, M., et al., 31P-MRS study of bio-energy recovering phenomenon. Biochemical and biophysical research communications, 1988. 151(2):865-871.
CrossRef - Matsumoto, Y., et al., Creatine kinase kinetics in diabetic cardiomyopathy. American Journal of Physiology-Endocrinology and Metabolism, 1995. 268(6):E1070-E1076.
CrossRef - Pieper, G.M., et al., Abnormal phosphocreatine metabolism in perfused diabetic hearts. A 31P nuclear-magnetic-resonance study. Biochemical Journal, 1983. 210(2):477-481.
CrossRef - Nicholson, J.K., et al., 750 MHz 1H and 1H-13C NMR spectroscopy of human blood plasma. Analytical chemistry, 1995. 67(5):793-811.
CrossRef - Beckonert, O., et al., Metabolic profiling, metabolomic and metabonomic procedures for NMR spectroscopy of urine, plasma, serum and tissue extracts. Nature protocols, 2007. 2(11):2692.
CrossRef - Yu, M., et al., Discovery and validation of potential serum biomarkers for pediatric patients with congenital heart diseases by metabolomics. Journal of proteome research. 2008 Oct 5;17(10):3517-3525.
CrossRef - Rajalahti, T. and O.M. Kvalheim, Multivariate data analysis in pharmaceutics: a tutorial review. International journal of pharmaceutics, 2011. 417(1-2):280-290.
CrossRef - Xia, J., et al., MetaboAnalyst 3.0–making metabolomics more meaningful. Nucleic acids research. 2015 Jul 1;43(W1):W251-W257.
CrossRef - Wei, T., et al., Metabonomic analysis of potential biomarkers and drug targets involved in diabetic nephropathy mice. Scientific reports. 2015 Jul 7;5:11998.
CrossRef - Tomas, L., et al., Altered metabolism distinguishes high-risk from stable carotid atherosclerotic plaques. Eur Heart J. 2018 Jun 21;39(24):2301-2310.
CrossRef - Christen, S., et al., Breast cancer-derived lung metastases show increased pyruvate carboxylase-dependent anaplerosis. Cell Rep. 2016 Oct 11;17(3):837-848.
CrossRef - Yang, C., et al., Glutamine oxidation maintains the TCA cycle and cell survival during impaired mitochondrial pyruvate transport. Molecular cell. 2014 Nov 6;56(3):414-424.
CrossRef - Bernini, P., et al., The cardiovascular risk of healthy individuals studied by NMR metabonomics of plasma samples. Journal of proteome research. 2011 Nov 4;10(11):4983-4992.
CrossRef - Wang, J., et al., Metabolomic identification of diagnostic plasma biomarkers in humans with chronic heart failure. Molecular BioSystems. 2013 Nov;9(11):2618-2626.
CrossRef - Jobard, E., et al., A serum nuclear magnetic resonance-based metabolomic signature of advanced metastatic human breast cancer. Cancer letters. 2014 Feb 1;343(1):33-41.
CrossRef - Zhang, e.a., Research progress in myocardial energy metabolism of ischemic heart disease. Chin. Heart J. 2018. 30(2):207.
- Gibbons, H., A. O’Gorman, L. Brennan, Metabolomics as a tool in nutritional research. Current opinion in lipidology. 2015 Feb;26(1):30-34.
CrossRef - Moeckel, G.W. and Y.H. Lien, Distribution of de novo synthesized betaine in rat kidney: role of renal synthesis on medullary betaine accumulation. American Journal of Physiology-Renal Physiology, 1997. 272(1):F94-F99.
CrossRef - Davies, S.n.E.C., et al., Proton nmr studies of betaine excretion in the human neonate: consequences for choline and methyl group supply. The Journal of Nutritional Biochemistry, 1992. 3(10):523-530.
CrossRef - Friesen, R.W., et al., Relationship of dimethylglycine, choline, and betaine with oxoproline in plasma of pregnant women and their newborn infants. The Journal of nutrition, 2007. 137(12):2641-2646.
CrossRef - Senn, T., S.L. Hazen, and W.H.W. Tang, Translating metabolomics to cardiovascular biomarkers. Progress in cardiovascular diseases. 2012 Jul-Aug;55(1):70-76.
CrossRef - Guo, N., et al., Metabonomic study of chronic heart failure and effects of Chinese herbal decoction in rats. Journal of Chromatography A. 2014 Oct 3;1362:89-101.
CrossRef - Jiang, L., et al., Disturbed energy and amino acid metabolism with their diagnostic potential in mitral valve disease revealed by untargeted plasma metabolic profiling. 2019 Apr 1;15(4): 57
CrossRef - Zhang, H., et al., Metabolic profiles revealed anti-ischemia-reperfusion injury of Yangxinshi tablet in Rats. Journal of Ethnopharmacology. 2018 Mar 25;214:124-133.
CrossRef - Shearer, J., et al., Metabolomic profiling of dietary-induced insulin resistance in the high fat-fed C57BL/6J mouse. Diabetes, Obesity and Metabolism, 2008 Sep;10(10):950-958.
CrossRef - Sener, A. and W.J. Malaisse, L-leucine and a nonmetabolized analogue activate pancreatic islet glutamate dehydrogenase. Nature, 1980 Nov 13;288(5787):187-189.
CrossRef - Tapiero, H., et al., Glutamine and glutamate. Biomedicine & pharmacotherapy, 2002 Nov;56(9):446-457.
CrossRef - Drake, K.J., et al., Amino acids as metabolic substrates during cardiac ischemia. Experimental Biology and Medicine. 2012 Dec;237(12):1369-1378.
CrossRef - Meng, X.-e., et al., High plasma glutamate levels are associated with poor functional outcome in acute ischemic stroke. Cellular and Molecular Neurobiology. 2015 Mar;35(2):159-165.
CrossRef - Turer, A.T., et al., Metabolomic profiling reveals distinct patterns of myocardial substrate use in humans with coronary artery disease or left ventricular dysfunction during surgical ischemia/reperfusion. Circulation, 2009 Apr 7;119(13):1736-1746.
CrossRef - Shah, S.H., et al., Association of a peripheral blood metabolic profile with coronary artery disease and risk of subsequent cardiovascular events. Circulation: Cardiovascular Genetics. 2010 Apr;3(2):207-214.
CrossRef - Cheng, S., et al., Metabolite profiling identifies pathways associated with metabolic risk in humans. 2012 May 8;125(18):2222-2231.
CrossRef - Hakuno, D., et al., Plasma amino acid profiling identifies specific amino acid associations with cardiovascular function in patients with systolic heart failure. PLoS One. 2015 Feb 6;10(2):e0117325.
CrossRef - Pasini, E., et al., Hypercatabolic syndrome: molecular basis and effects of nutritional supplements with amino acids. The American journal of cardiology, 2008 Jun 2;101(11A):11E-15E.
CrossRef - Sun, H., et al., Catabolic defect of branched-chain amino acids promotes heart failure. 2016 May 24;133(21):2038-2049.
CrossRef - Shah, S.H., W.E. Kraus, and C.B. Newgard, Metabolomic profiling for the identification of novel biomarkers and mechanisms related to common cardiovascular diseases: form and function. 2012 Aug 28;126(9):1110-1120.
CrossRef - Bowen, T.S., G. Schuler, and V. Adams, Skeletal muscle wasting in cachexia and sarcopenia: molecular pathophysiology and impact of exercise training. Journal of Cachexia, Sarcopenia and Muscle. 2015 Sep;6(3):197-207.
CrossRef - Toth, M.J., et al., Skeletal muscle atrophy and peak oxygen consumption in heart failure. American Journal of Cardiology, 1997 May 1;79(9):1267-1269.
CrossRef - Morrison, W.L., J.N.A. Gibson, and M.J. Rennie, Skeletal muscle and whole body protein turnover in cardiac cachexia: influence of branched-chain amino acid administration. European journal of clinical investigation, 1988. 18(6): 648-654.
CrossRef - Xia, J. and D.S. Wishart, Web-based inference of biological patterns, functions and pathways from metabolomic data using MetaboAnalyst. Nature protocols. 2011 Jun;6(6): 743-60.
CrossRef
Abbreviations
| 1 | CHD | Congenital heart disease | 10 | NMR | Nuclear Magnetic Resonance |
| 2 | TGA | Transposition of the great arteries | 11 | CPMG | Carr–Purcell–Meiboom–Gill |
| 3 | TOF | Tetralogy of Fallot | 12 | HSQC | Heteronuclear single quantum correlation spectroscopy |
| 4 | PTA | Persistent truncus arteriosus | 13 | FT | Fourier Transformation |
| 5 | HLHS | Hypoplastic left heart syndrome | 14 | FID | Free induction decay |
| 6 | IAA | Interrupted aortic arch | 15 | PLS-DA | partial least-squares discriminant analysis |
| 7 | ROC | Receiver operating characteristic curve | 16 | VIP | Variable importance on projection |
| 8 | AUC | Area under curve | 17 | CV | Cross validation |
| 9 | TOCSY | Total Correlated Spectroscopy |

