
Manuscript accepted on :29-Dec-2020
Published online on: 15-01-2021
Plagiarism Check: Yes
Reviewed by: Dr. Tejaswi Chavan
Second Review by: Dr. Ankur Singh Bist
Final Approval by: Dr Ricardo Lagoa
Ahmad Fauzi1*, Rizky Gatham2, Phedy2, Ajiantoro2, Luthfi Gatam2, Harmantya Mahadipta3 and Riza Aprizal4
1 Department of Orthopaedic Surgery, Medical Faculty of Lampung University
2 Department of Orthopaedic Surgery, Fatmawati Hospital, Jakarta, Indonesia.
3 Department of Orthopaedic Surgery, Tangerang Regional Public Hospital, University of Indonesia
4 Department of Orthopaedic Surgery, Pasar Rebo Regional Public Hospital, Jakarta, Indonesia.
Corresponding Author E-mail: ahm4d.faouz1@gmail.com
DOI : https://dx.doi.org/10.13005/bpj/2125
Abstract
This study aimed to assess the factors that influence The Oswestry Disability Index (ODI) clinical outcomes in patients with Lumbal Spinal Stenosis (LSS) after Percutaneous Stenoscopic Lumbar Decompression (PSLD). A total of 92 patients were analyzed for factors that affecting ODI clinical outcome. These factors were age, sex, body mass index, cigarette consumption, alcohol consumption, sports history, pain onset, radicular pain, VAS pain score, paresis and paresthesia symptoms, duration and conservative management, length of operation, duration of treatment, recurrence of pain, and duration of postoperative healing. Data were collected by direct examination, questionnaires, in-depth interviews, and patient medical records. A Pearson correlation or Spearman Rank test and independent T-test or Mann Whitney was conducted to determine the significant relationship between these factors and ODI clinical outcomes. Multiple linear regression was performed to find out which factor most influences ODI clinical outcome. Some factors influence ODI outcome in the sample as resulted by statistical analysis. From the statistic analysis, only three factors that influence the ODI postoperative there was age (p=0.003), VAS preoperative (p=0.001), and ODI preoperative (p=0.001). There was no statistical significance found in the other factors with p>0.005. Factors influencing clinical outcomes by ODI in patients with lumbar spinal stenosis after PSLD was the age of the patient, preoperative ODI, and preoperative VAS.
Keywords
Clinical Outcome; Lumbar Spinal Stenosis; Oswestry Disability Index; Percutaneous Stenoscopic Lumbar Decompression
Download this article as:| Copy the following to cite this article: Fauzi A, Gatham R, Phedy P, Ajiantoro A, Gatam L, Mahadipta H, Aprizal R. Multivariate Analysis of Factors that Influence the Clinical Outcome Oswestry Disability Index in Patients with Lumbar Spinal Stenosis Post Percutaneous Stenoscopic Lumbar Decompression. Biomed Pharmacol J 2021;14(1). |
| Copy the following to cite this URL: Fauzi A, Gatham R, Phedy P, Ajiantoro A, Gatam L, Mahadipta H, Aprizal R. Multivariate Analysis of Factors that Influence the Clinical Outcome Oswestry Disability Index in Patients with Lumbar Spinal Stenosis Post Percutaneous Stenoscopic Lumbar Decompression. Biomed Pharmacol J 2021;14(1). Available from: https://bit.ly/35Lvdjk |
Introduction
Lumbar Spinal Stenosis (LSS) is a condition of narrowing the spinal canal or intervertebral foramen in the lumbar region, accompanied by the pressure of nerve roots coming out of the foramen1. It is believed there are 5 out of 1,000 people over the age of 50 are suffering from this disease. It is the most common disease that requires spinal surgery in people over 60 years old2,3.
Indications of surgery on LSS are neurological symptoms that get heavier, progressive neurological deficits, decreased quality of life due to disruption of daily activities, and failure of conservative therapy4. The most common treatment procedure is decompression laminectomy. That treatment aims to decompress the nerve root with various techniques to reduce symptoms in the lower limbs. There are currently many minimally invasive procedures that can be performed, one of which is very popular is to use endoscopic spine surgery, such as the percutaneous stenoscopic lumbar decompression method (PSLD). Endoscopic spine surgery can reduce postoperative pain incidence by minimizing muscle damage around the spine and preventing instability5-8.
The Oswestry Disability Index (ODI) is one of the clinical outcomes for evaluating the success of lower back pain management9,10. ODI is in the form of a questionnaire and has been tested for validity, reliability, and has become the primary choice in assessing patients’ clinical outcomes with lower back problems11. Based on studies conducted by Vianin et al.,11, it is said that ODI is a valid, reliable questionnaire and is a responsive specific condition check tool that is suitable for use in clinical practice. ODI shows good validity, acceptable internal consistency, test-retest reliability, and low administrative complexity11,12.
This study was conducted to assess the predictive factors affecting ODI clinical outcomes in Lumbar Spinal Stenosis patients after PSLD treatment. These factors were age, sex, body mass index, cigarette consumption, alcohol consumption, exercise history, pain onset, radicular pain, VAS pain score, paresis and paresthesia symptoms, duration and conservative management, length of operation, duration of treatment, recurrence of pain, and duration of postoperative healing.
Methods
Study Design
This study was an observational analytic study with a cohort design of LSS patients undergoing PSLD at the Premiere Bintaro Hospital, Tangerang, from January 2016 – January 2019. The inclusion criteria were patients diagnosed with Lumbar Spinal Stenosis without instability, both men and women, who received PSLD treatment. All patients involved did not get another surgical procedure and did not have other complicated diseases in the spinal area. In total, 92 patients met these criteria. All patients involved had signed informed consent for approval to take part in the study. The study was approved by the Health Research Ethics Committee, Faculty of Medicine, University of Lampung.
Patient data were obtained through direct examination, questionnaires, in-depth interviews, and patient medical record data. Before surgery, these patients were interviewed in-depth to find out factors related to demographics and clinical factors. Demographic factors include age, sex, weight, height, BMI, cigarette consumption, alcohol consumption, and sports history. Clinical factors include pain onset, presence or absence of radicular pain, VAS score, and the presence or absence of paresthesias and paresis symptoms. Patients were also examined for their IDO scores using a questionnaire tested for validity and reliability. The ODI questionnaire was divided into ten groups of questions with 0-5 per section. A score of 5 indicates the most severe disability. The index will be calculated by adding up all the values divided by 50 and multiplying by 100%.12.
After that, LSS patients underwent surgery with the PLSD method using the stenoscope (a 12 o stenoscope). This procedure was performed on one incision made. At first, the patients were anesthetized epidurally, then placed supine. The incision is then made vertically 7 mm long at a location that has been confirmed by prior intraoperative fluoroscopic guidance. Furthermore, the blunt dilator was inserted right next to the spinous process next to the ipsilateral at right angles to the lamina. The working sleeve was inserted into the dilator; then, the rigid angle stenoscope was inserted through the other side through the working sleeve4. Then a laminotomy was performed to expose the outermost portion of the ligamentum flavum. After that, ipsilateral decompression is performed to remove the contralateral ligament and superior articular process to decompress the contralateral transverse nerve root. After surgery, the patient was re-examined for VAS and IDO scores and outcome factors, such as the recurrence of pain, duration of operation, duration of treatment, and postoperative healing duration.
Data Analysis
All data were analyzed using the Pearson correlation test or the Spearman Rank test and the independent T-test or Mann-Whitney test. Furthermore, the Linear Regression Multivariate test is performed on factors that have a p-value <0.2. Data about the time of recurrence of pain is used as a reference in conducting survival analysis. The data is displayed in units per month and has a maximum range of up to 1 year postoperatively according to the longest follow-up time.
Results
General Characteristics
In this study, the average age of the sample was 60.8 (45-78) years. There are more women than men, with a male: female ratio of 1: 1.3. The majority of the sample, not smoking (72.8%), did not consume alcohol (91.3%), and rarely exercise (81.5%). The sample averaged pain onset at month 48 months, with mean preoperative VAS and IDO values of 4.5 and 42.5. The majority of samples had paresthesias symptoms (91.3%) but did not have paresis symptoms (86.9%).
Relationship between Demographic Factors and IDO Score Change
From 7 demographic factors associated with IDO score change, only the age was known to have a significant relationship with IDO scores on the first day to 12 months postoperatively. Bodyweight did not have a significant relationship with IDO scores change on the first day, three months, and 12 months postoperatively, but at six months postoperatively, weight had a significant relationship with sample IDO scores. BMI did not significantly correlate with changes in sample IDO scores on the first day after surgery, but BMI was significantly related to IDO scores change in subsequent measurements. Height did not have a significant relationship with changes in sample IDO scores, either on all measurements (Table 2).
Regarding sex, there were significant differences in changes in IDO scores between men and women on the first day postoperatively. In subsequent measurements, there were no significant differences in changes in IDO scores between men and women. There were no significant differences in IDO scores on factors such as smoking history, alcohol consumption, and exercise history throughout the measurements (Table 3).
Table 1: Characteristic of the 92 patients with LSS after PSLD
| Patient Characteristic | Values |
| Ages, years – means (SD) | 60.8 (45-78) |
| Sex
-. Male -. Female |
40 (43.5%) 52 (56.5%) |
| Weight, kg – means (SD) | 75.4 (55-92) |
| Height, cm – means (SD) | 165.5 (155-181) |
| Body Mass Index, kg/m2 – means (SD) | 25.7 (18.1-37.7) |
| Ciggarete Consumption
-. No -. Yes |
67 (72.8%) 25 (27.2%) |
| Exercise History
-. Rarely -. Frequently Pain Onset, month – means (SD) |
75 (81.5%) 17 (28.5%) 48 (1-128) |
| Radicular Pain
-. No -. Yes |
7 (7.7%) 85 (92.3%) |
| Paresthesias Symptoms
-. No -. Yes |
8 (7.7%) 84 (91.3%) |
| Paresis Symptoms
-. No -. Yes Length of Operation, minute – means (SD) |
80 (86.9%) 12 (13.1%) 64 (43-140) |
| Duration of Treatment, days – means (SD) | 1.5 (2-4) |
| Pain Recurrences
-. No -. Yes Duration of Postoperative Healing, days – means (SD) |
86 (93.5%) 6 (6.5%) 6 (2-40) |
Table 2: The correlation of age, weight, height, and BMI with IDO score change
| Demographic Factors | IDO Score Change (p-value) | |||||||
| 1st day | 3rd month | 6th month | 12th month | |||||
| R | P | R | P | R | P | R | P | |
| Age | -0.228 | 0.014* | -0.480 | 0.011* | -0.564 | 0.004* | -0.677 | 0.003* |
| Weight | 0.245 | 0.165 | 0.155 | 0.155 | 0.175 | 0.030* | 0.090 | 0.350 |
| Height | 0.345 | 0.165 | 0.175 | 0.155 | 0.245 | 0.154 | 0.270 | 0.350 |
| BMI | -0.127 | 0.080 | -0.233 | 0.025* | -0.259 | 0.010* | -0.292 | 0.001* |
Experiment: The p-value was calculated based on the Pearson correlation test at α 5%. * indicates a significant relationship.
Table 3: IDO score changes based on gender, cigarette consumption, alcohol consumption, and exercise history
| Demographic Factors | Mean IDO Score | Mean Difference (IK95%) | P | |
| Sex | Male
(N=40) |
Female
(N=52) |
||
| 1st day postoperatively | 46 (8 – 80) | 40.5 (2 – 70) | 3.65 (-0.11 – 7.21) | 0.025* |
| 3 months postoperatively | 50 (10 – 82) | 42 (18 – 80) | 0.377 (-314 – 3.7) | 0.454 |
| 6 months postoperatively | 50.5 (10 – 83) | 46 ± 7.6 | 0.95 (-2.51 – 4.3) | 0.565 |
| 12 months postoperatively | 52 ± 5.86 | 49.4 ± 6.4 | 1.5 (-1.1 – 3.7) | 0.345 |
| Cigarette Consumption | No
(N=67) |
Yes
(N=25) |
||
| 1st day postoperatively | 44 (2 – 52) | 45.5 (8 – 60) | -0.835 (-5.0 – 3.4) | 0.525 |
| 3 months postoperatively | 46.5 ± 6.2 | 42 (10 – 75) | 1.95 (-1.9 – 5,8) | 0.333 |
| 6 months postoperatively | 48.6 ± 7.1 | 43.5 (10 – 87) | 0.89 (-3.1 – 4.7) | 0.676 |
| 12 months postoperatively | 51.4 ± 6.2 | 49.6 ± 5.86 | -0.75 (-3.6 – 1.9) | 0.635 |
| Alcohol Consumption | No
(N=84) |
Yes
(N=8) |
||
| 1st day postoperatively | 46.5 (2 – 78) | 44.5 (8 – 70) | 4.78 (-3.89 – 13.1) | 0.456 |
| 3 months postoperatively | 46.9 (10 – 80) | 43.5 (10 -68) | 6.56 (-1.7 – 13.7) | 0.345 |
| 6 months postoperatively | 48.9 ± 8.2 | 47.5 (12 – 50) | 5.88 (-2.4 – 13.1) | 0.787 |
| 12 months postoperatively | 51.5 ± 6.14 | 50.7 ± 4.9 | 2.76 (-2.9 – 8.2) | 0.245 |
| Exercise History | Rarely
(N=81) |
Frequently
(N=18) |
||
| 1st day postoperatively | 37.5 (2 – 42) | 45.5 (2 -80) | -1.666 (-5.7 – 2.42) | 0.070 |
| 3 months postoperatively | 44.5 (10 – 56) | 45.9 (10 – 49) | -6.87 (-4.3 – 3.14) | 0.675 |
| 6 months postoperatively | 45.7 ± 8.2 | 49.7 (12 – 52) | -1.35 (-5.33 – 2.8) | 0.545 |
| 12 months postoperatively | 49.4 ± 6.3 | 51.9 ± 5.39 | -1.75 (-4.6 – 0.67) | 0.235 |
Experiment: The p-value was calculated based on the independent T-test and Mann Whitney at α 5%. * indicates a significant relationship.
Relationship between Clinical Factors and IDO Score Change
From 7 clinical factors associated with IDO score change, only VAS and preoperative IDO scores were significantly associated with IDO scores change from the first day to 12 months postoperatively. Pain onset was associated with IDO score change at 3, 6 and 12 months postoperatively, whereas rehabilitation duration before surgery is only associated with IDO scores on the first postoperative day. However, subsequent measurements at month 3rd through month 12th, the length of rehabilitation before surgery did not show any significant relationship with changes in IDO scores (Table 4).
There was no significant difference in IDO score change due to radicular pain and paresis symptoms on the first day to 12 months postoperatively. In the symptoms of paresthesias, differences in IDO score change only occur on the first day postoperatively, whereas in subsequent measurements up to 12 months postoperatively, no significant difference in IDO score change was found (Table 5).
Table 4: Correlation of pain onset, preoperative VAS and IDO score and duration of rehabilitation with IDO score change
| Clinical Factors | IDO Score Change (p-value) | |||||||
| 1st day | 3rd month | 6th month | 12th month | |||||
| R | P | R | P | R | P | R | P | |
| Pain Onset | 0,140 | 0,687 | 0,171 | 0,050* | 0,191 | 0,016* | 0,365 | 0,001* |
| Preoperative VAS | -0,354 | 0,001* | -0,375 | 0,001* | -0,476 | 0,001* | -0,655 | 0,001* |
| Preoperative IDO | 0,576 | 0,001* | 0,657 | 0,001* | 0,657 | 0,001* | 0,799 | 0,001* |
| Duration of Rehabilitation | -0,245 | 0,015* | -0,088 | 0,575 | -0,458 | 0,787 | 0,671 | 0,216 |
Experiment: The p-value was calculated based on the Pearson correlation or Spearman Rank test at α 5%. * indicates a significant relationship
Table 5: IDO score change based on radicular pain, paresis and paraesthesia symptoms.
| Clinical Factors | Mean IDO Score | Mean Difference (IK95%) | P | |
| Radicular Pain | No
(N=7) |
Yes
(N=85) |
||
| 1st day postoperatively | 45 ± 3.5 | 39 (2 – 60) | 3.47 (-7.4 – 14.3) | 0.687 |
| 3 months postoperatively | 48.9 ± 3.6 | 45 (10 – 68) | 5.84 (-4.1 – 15.8) | 0.454 |
| 6 months postoperatively | 49.5 ± 2.6 | 46.7 ± 8.7 | 5.72 (-4.3 – 15.7) | 0.454 |
| 12 months postoperatively | 52.5 ± 4.04 | 49.77 ± 6.13 | 3.5 (-3.5 – 10.6) | 0.245 |
| Paraesthesia Symptoms | No
(N=21) |
Yes
(N=81) |
||
| 1st day postoperatively | 38 (2 – 50) | 42 (2 – 60) | -6.06 (-10.6 – -1.67) | 0.001* |
| 3 months postoperatively | 45 (10 – 60) | 41 (10 – 64) | -1.1 (-5.3 – 3.05) | 0.657 |
| 6 months postoperatively | 49 (10 – 54) | 48 ± 7.6 | -2.2 (-6.4 – 1.9) | 0.387 |
| 12 months postoperatively | 51.4± 6.59 | 50.01 ± 6.0 | 0.12 (-3.1 – 3.3) | 0.823 |
| Paresis Symptoms | No
(N=80) |
Yes
(N=12) |
||
| 1st day postoperatively | 30 (2 – 42) | 32.5 (14 – 40) | -1.80 (-6.6 – 3.01) | 0.631 |
| 3 months postoperatively | 41.2 (10 – 54) | 40 (16 – 56) | -0.82 (-5.6 – 3.9) | 0.795 |
| 6 months postoperatively | 44.5 ± 8.8 | 42.9 ± 7.5 | -0.543 (-4.9 – 3.9) | 0.809 |
| 12 months postoperatively | 50.09 ± 5.85 | 45.6 ± 7.34 | 0.69 (-2.5 – 3.8) | 0.665 |
Experiment: The p-value was calculated based on the independent T-test and Mann Whitney at α 5%. * indicates a significant relationship.
Relationship between Outcome Factors and IDO Score Change
From 4 outcome factors studied, only pain recurrence factors had a significant relationship with IDO score change from the first day to 12 months postoperatively. Other factors, such as duration of operation, duration of treatment, and postoperative healing duration, were not related to IDO score change, both on the first day to 12 months postoperatively (Table 6 and 7).
Table 6: Correlation of duration of operation, duration of treatment and duration of postoperative healing with IDO score change
| Outcome Factors | IDO Score Change (p-value) | |||||||
| 1st day | 3rd month | 6th month | 12th month | |||||
| R | p | R | P | R | P | R | P | |
| Duration of Operation | -0.175 | 0.145 | -0.222 | 0.148 | -0.105 | 0.375 | -0.245 | 0.558 |
| Duration of Treatment | -0.225 | 0.875 | -0.175 | 0.574 | -0.165 | 0.107 | -0.295 | 0.125 |
| duration of healing | -0.224 | 0.454 | -0.185 | 0.241 | -0.193 | 0.272 | -0.159 | 0.592 |
Experiment: The p-value was calculated based on the Spearman Rank test at α 5%. * indicates a significant relationship.
Table 7: IDO score change based on pain recurrence
| Outcome Factors | Mean IDO Score | Mean Difference (IK95%) | P | |
| Pain Recurrence | No
(N=7) |
Yes
(N=85) |
||
| 1st day postoperatively | 40 (12 – 50) | 38.7 (2 – 60) | 15.38 (10.78–19.99) | 0.001* |
| 3 months postoperatively | 44.5 ± 6.5 | 40.1 (10 – 62) | 11.5 (6.9 – 16.01) | 0.001* |
| 6 months postoperatively | 48.7 ± 5.7 | 45.6 (10 – 64) | 13.7 (9.4 – 18.03) | 0.001* |
| 12 months postoperatively | 50.55 ± 5.6 | 47 ± 7.7 | 4.5 (1.1 – 8.1) | 0.011* |
Experiment: The p-value was calculated based on the independent T-test and Mann Whitney at α 5%. * indicates a significant relationship.
Survival Analysis
Based on the survival test that has been done, it is known that only 12.7% of patients experience recurrence of pain in the first year, while 93.5% of the remaining patients do not experience pain recurrence in the first year. The pain recurrence time experienced by patients varies from month 1st to month 12th (Figure 1).
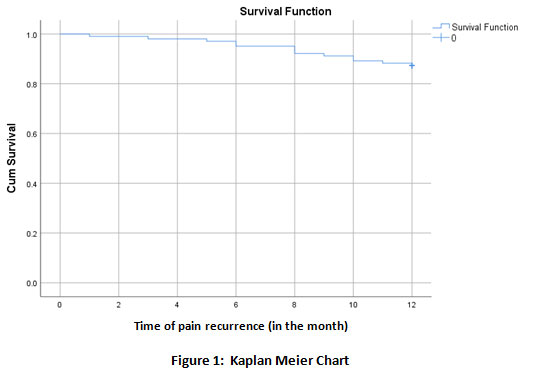 |
Figure 1: Kaplan Meier Chart |
The results of the Cox Regression test showed that there were no significant relationships between the five variables that affected the change in IDO scores 12 months postoperatively, i.e., age, BMI, the onset of pain, VAS and IDO preoperatively, with pain recurrence (p> 0.05) (Table 8). Therefore, the hazard ratio obtained from the Cox regression statistical test cannot be interpreted.
Table 8: Survival analysis with variables related to changes in IDO 12 months post operatively
| Variable | Pain Recurrence
|
||||||
| No
N (%) |
Yes
N (%) |
Total | p-value | HR
(IK 95%) |
p-value | aHR
(IK 95%) |
|
| Age
< 46 years ≥ 46 years |
33 (83%) 46 (88%) |
7 (17%) 6 (12%) |
40 52 |
0.273c) | 0.543 | – | – |
| VAS Preoperation
< 5 ≥ 5 |
10 (90%) 71 (92%) |
5 (10%) 6 (8%) |
15 77 |
0.845c) | 1.238 | – | – |
| IDO Preoperation
< 55 ≥ 55 |
43 (86%) 36 (85%) |
7 (14%) 6 (15%) |
50 42 |
0.541c) | 0.714 | – | – |
| BMI
< 25 ≥ 25 |
37 (90%) 42 (82%) |
4 (10%) 9 (18%) |
41 51 |
0.437c) | 1.769 | – | – |
| Pain Onset
< 36 Months ≥ 36 Months |
38 (88%) 41 (84%) |
5 (12%) 8 (16%) |
43 49 |
0.756c) | 1.312 | – | – |
Results are displayed in the Hazard Ratio value
c) p-value calculated by Cox Regression test.
Discussion
Percutaneous Stenoscopic Lumbar Decompression (PSLD) is an alternative method of lumbar stenosis therapy. This method provides more advantages than the open discectomy method, including smaller incision wounds, better cosmetics, premature ambulation, lighter postoperative pain, less blood loss during surgery, short duration of treatment, and shorter analgesic dose lower, shorter return to activities and thus lower maintenance costs13,14. Besides, better long-term outcomes are also the reason this method is used in this study.
Based on this research, three factors most influence the change in IDO scores in LSS patients undergoing PSLD therapy, namely age, preoperative VAS score and preoperative IDO score. Age is one of the factors that influence changes in IDO scores. The strongest correlation to change in IDO scores was 12 months rather than one day, three months, or six months postoperatively. In this study, the age factor can influence long-term clinical outcomes in Lumbar spinal stenosis patients who performed the PSLD procedure. Age is one factor that affects the general condition of the spine, both intervertebral discs, degeneration and thickening of the facet joints and thickening of the ligamentum flavum. It is known that notochord cells, stem cells in the intervertebral discs, begin to decrease at the age of 15 years, and degeneration in the intervertebral discs has occurred at that time only slightly15,16. In other words, the older the patient is, the recovery ability of the intervertebral discs will deteriorate. This change will result in complaints due to the lumbar canal’s narrowing, suppressing the nerve fibers. It might explain the relationship between increasing age with changes in IDO scores declining in this study’s results. This result is supported by other studies conducted by Boden et al., That in patients who are already degenerative, this does not only occur in the spine but also in other places, especially in the hip joint and knee joint17.
Besides age, VAS and IDO scores before surgery also significantly affect changes in IDO scores. VAS or Visual Analog Scale is a psychometric response scale for subjective characteristics or attitudes that cannot be measured directly and is often used to evaluate pain in patients with lumbar spinal stenosis. This VAS has proven to be sensitive and can be repeated, but it is not specific enough for lumbar spinal stenosis. Some studies still use VAS to estimate the severity of pain and intervene according to the patient’s condition. A numerical system can be used with VAS, where one will show no pain, and ten will show the worst possible pain18,19. Patients with high VAS will show a lower IDO value than patients with lower VAS because the VAS value will affect the patient’s clinical outcome.
Our study also found that preoperative IDO scores could be one of the factors that could influence changes in IDO scores 12 months postoperatively. The greater the IDO score before surgery, the more significant the change in IDO scores 12 months postoperatively.
This study’s survivability test did not show any relationship between the predicted factors of changes in the 12-month IDO score to the pain recurrence pain in LSS patients after PSLD. It is possible because the follow-up period is only limited to 1 year postoperatively. Patients without recurrence of pain one year after surgery in this study were still likely to experience the event for a longer time. If the follow-up is continued for a longer time, it will undoubtedly significantly affect the proportion of patients who experience recurrence of pain.
There are three factors that most influence changes in 12 months IDO score in LSS patients undergoing PSLD therapy, namely age, preoperative VAS score and preoperative IDO score.
Conflict of Interest
The author declares no conflict of interest.
References
- Spivak JM. Degenerative lumbar spinal stenosis. J Bone Joint Surg Am, 80(7):1053–66 (1998).
CrossRef - Postacchini F. Surgical management of lumbar spinal stenosis. Spine, 24(10):1043–7 (1999).
CrossRef - Vaccaro AR, Garfin SR. Degenerative lumbar spondylolisthesis with spinal stenosis, a prospective study comparing decompression with decompression and intertransverse process arthrodesis: A critical analysis. Spine, 22(4):368–9 (1997).
CrossRef - Lim KT, Nam HGW, Kim SB, Kim HS, Park JS, Park CK. Therapeutic feasibility of full endoscopic decompression in one- to three-level lumbar canal stenosis via a single skin port using a new endoscopic system, percutaneous stenoscopic lumbar decompression. Asian Spine J, 13(2):272–82 (2019).
CrossRef - Genevay S, Atlas SJ. Lumbar spinal stenosis. Best Pract Res Clin Rheumatol, 24(2):253–65 (2010).
CrossRef - Sabia M, Mathur R. Interventional Pain Procedures. New York: Springer Publishing Company; 2018.
CrossRef - Kent DL, Haynor DR, Larson EB, Deyo RA. Diagnosis of lumbar spinal stenosis in adults: a meta-analysis of the accuracy of CT, MR, and myelography. Am J Roentgenol, 158(5):1135–44 (1992).
CrossRef - Harvard Women’s Health Watch. Treating Lumbar Spinal Stenosis. Massachusetts: Harvard Health Publishing; 2008. Available from: https://www.health.harvard.edu/ newsletter_article/ Treating_lumbar_spinal_stenosis
- Fairbank JCT, Pynsent PB. The oswestry disability i Spine, 25(22):2940–53 (2000).
CrossRef - Mehra A, Baker D, Disney S PP. Oswestry Disability Index scoring made easy. Ann R Coll Surg Engl, 90(6):497–9 (2008).
CrossRef - Vianin M. Psychometric properties and clinical usefulness of the Oswestry Disability Index. J Chiropr Med, 7(4):161–3 (2008).
CrossRef - Fairbank J. Why are there different versions of the Oswestry Disability Index? J Neurosurg Spine, 20(1):83–6 (2014).
CrossRef - Kulkarni A, Bassi A, Dhruv A. Microendoscopic lumbar discectomy: Technique and results of 188 cases. Indian J Orthop, 48(1):81–7 (2014).
CrossRef - Garg B, Nagraja UB, Jayaswal A. Microendoscopic versus open discectomy for lumbar disc herniation : a prospective randomized study. J Orthop Surg, 19(1):30–4 (2011).
CrossRef - Li H, Jiang C, Mu X, Lan W, Zhou Y, Li C. Comparison of MED and PELD in the treatment of adolescent lumbar disc herniation: a 5-year retrospective follow-up. World Neurosurg, 112:255–60 (2018).
CrossRef - Wang M, Zhou Y, Wang J, Zhang Z. A 10-year follow-up study on long-term clinical outcomes of lumbar microendoscopic discectomy. J Neurol Surg A, 73(4):195–8 (2012).
CrossRef - Boden SD, Davis DO, Dina TS, Patronas NJ, Wiesel SW. Abnormal magnetic-resonance scans of the lumbar spine in asymptomatic subjects. A prospective investigation. J Bone Joint Surg Am, 72(3):403–8 (1990).
CrossRef - Reips UD, Funke F. Interval-level measurement with visual analogue scales in internet-based research: VAS g Behav Res Methods, 40(3):699–704 (2008).
CrossRef - Adamchic I, Langguth B, Hauptmann C, Tass PA. Psychometric evaluation of visual analog scale for the assessment of chronic tinnitus. Am J Audiol, 21(2):215–25 (2012).
CrossRef

