
Manuscript accepted on :04-02-2021
Published online on: 11-02-2021
Plagiarism Check: Yes
Reviewed by: Dr. John George Hardy
Second Review by: Dr. Ahmed Salah
Final Approval by: Dr Ricardo Lagoa
Sheeba Santhosh1 , A. Vimala Juliet2 and G. Hari Krishnan3
1Sathyabama Institute of Science and Technology, Chennai, Tamil Nadu, India
2Department of ICE, SRM Institute of Science and Technology, chennai , Tamil Nadu India
3Department of EEE, Sree Vidyanikethan Engineering College,Tirupati. Andhra Pradesh, India.
Corresponding Author E-mail: haris_eee@yahoo.com
DOI : https://dx.doi.org/10.13005/bpj/2108
Abstract
Bio-impedance diagnosis depends mainly on two factors first being the location of electrode placement and second being the distance between electrodes. To minimize the errors caused during bio impedance measurement at variable frequencies, it is required to study the electrodes used for the measurement and its exact location where the electrodes are placed. This paper analyses various electrode separations used for bioimpedance measurement for cardiac signal. The electrode system is used based on the type of tissue under consideration for measurement. It is found that the errors are dependent on the frequencies at which the measurement is carried out and it also depends on the intensity of current applied. Thus, selection of current and frequency is very important for measurements. In this paper, the impact of size, distance and location of the electrodes that can be used for bio-impedance cardiograph.
Keywords
Bio-Impedance; Bio Potential Measurement; Electrode Configuration; Electrodes Distance; Magnitude Impedance Analyzer
Download this article as:| Copy the following to cite this article: Santhosh S, Juliet V, Krishnan G. H. Impact of Electrodes Separation Distance on Bio-Impedance Diagnosis. Biomed Pharmacol J 2021;14(1). |
| Copy the following to cite this URL: Santhosh S, Juliet V, Krishnan G. H. Impact of Electrodes Separation Distance on Bio-Impedance Diagnosis. Biomed Pharmacol J 2021;14(1). Available from: https://bit.ly/2Z5rklr |
Introduction
Techniques used in bioimpedance methods completely depend on the application of low intense high frequency current on the surface of a tissue [1&2]. These electric current produces a voltage drop which is basically caused due to variation in impedance of the tissue under test. Tissues or the medium acts as a conductor which can produce different impedance values based on the composition of the underlying tissues or cells [3&4]. These impedance values can be utilized for studying various physiological and pathological changes of the tissues that can provide information about the conditions of the tissues [5].
One of the most popular application of bioimpedance technique used is the analysis of bioimpedance of cardiac signal for the detection of cardiovascular diseases [6]. All types of measurement are conducted by the use of an effective electrode system. An electrode is basically an electro-chemical interface which acts as abridge to connect the tissue or cells to measuring instruments [7].
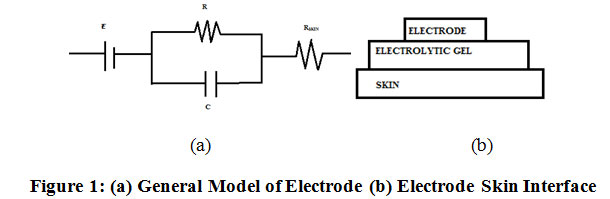 |
Figure 1: (a) General Model of Electrode (b) Electrode Skin Interface. |
Figure 1 shows the generalized model of the electrodes. ‘E’ represents the potential between the electrode and the electrolyte, ‘R’ represents the resistance associated with the conduction current and ‘C’ represents the displacement current and ‘Rskin’ is associated with the conduction losses from the electrolyte. Electrodes are available in different sizes. Most commonly used electrodes used for bioimpedance measurement are available in mm diameter for the ease of comfort for the subject [8 & 9].
Bioimpedance diagnosis depends on proper selection of electrodes type, region of electrodes placement and distance of separation between electrodes. Researchers in Bio-impedance focus mostly on location of the electrode placement depending on the part of human body to be diagnosed and type of electrodes used (Benjamin Sanchez et al., 2016 & Eiko Priidel et al 2020). Nonuniformly spaced electrodes were studied with intra class correlation between electrode placement and qualitative estimation. EIM reproducible depended minimum muscle length based electrode position (Benjamin Sanchez et al., 2016). For accurate diagnosis electrode separation distance plays a vital role in addition to selection of region for placement of electrodes based on the disease type. Proposed work focus on the analysis of electrodes separation distance impact on measured bio-impedance data. Work flow starts with electrodes type and electrode placement location for measurement of bio-impedance later experimental data analysis based on electrode separation distance.
Electrodes are made of variety of materials. Most prominent materials used are copper, titanium, silver, platinum, etc. Silver-Silver Chloride electrodes are popularly used in much bioimpedance measurement system. Electrodes can be further classified as gel electrodes, capacitive electrodes, and active electrodes. Bioimpedance measurements depend on the number of electrodes selected for the measurement of bio potential signal. Based on this, the electrode system can be classified as:
Bipolar Method
It makes use of two pair of electrodes, one pair of electrodes are considered as input electrodes and another pair of electrodes are considered as output electrodes. Input electrodes are used to apply a low intense high frequency current generated from a current source into the biological medium. These current disturbs the ionic movements underlying the tissue and thereby produces variation in the impedance of the tissue. Output electrodes sense the variation of the impedance in the form of voltage change [16]. It works well at high frequencies reducing the effect of electrode- electrolyte impedance change. Most popularly used in the analysis of soft tissues. Another most important aspect of bioimpedance measurement is the position where electrodes are placed [17]. For cardiac signal measurement, electrodes can be positioned at various locations [18]. In general surface electrodes are used and are further classified as shown in figure 1 and figure2
Tetrapolar Method
It makes use of two pair of electrodes, one pair of electrodes are considered as input electrodes and another pair of electrodes are considered as output electrodes. Input electrodes are used to apply a low intense high frequency current generated from a current source into the biological medium. These current disturbs the ionic movements underlying the tissue and thereby produces variation in the impedance of the tissue. Output electrodes sense the variation of the impedance in the form of voltage change [16]. It works well at high frequencies reducing the effect of electrode- electrolyte impedance change. Most popularly used in the analysis of soft tissues. Another most important aspect of bioimpedance measurement is the position where electrodes are placed [17]. For cardiac signal measurement, electrodes can be positioned at various locations [18]. In general surface electrodes are used and are further classified as shown in figure 1 and figure2
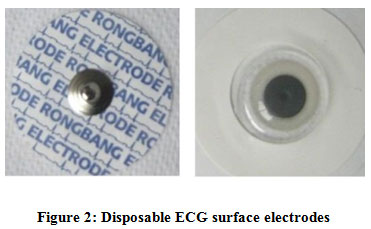 |
Figure 2: Disposable ECG surface electrodes |
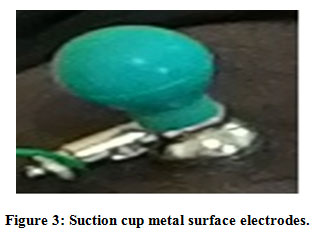 |
Figure 3: Suction cup metal surface electrodes. |
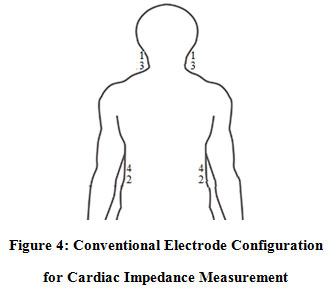 |
Figure 4: Conventional Electrode Configuration for Cardiac Impedance Measurement. |
For bioimpedance measurement 8 electrodes are used, four electrodes are used to inject input current and four near the lower limb region. The electrode system configuration for conventional Cardiac Impedance measurement is shown in figure 4.
Impedance Plethysmography method utilizes disposable electrodes for measurement. This It uses 4 electrodes which are placed on the wrist to measure bioimpedance signal. This measurement is carried at high frequency analysis. A current signal of 5mA with frequency sweep of ranging between 500 Hz -5.5kHz with increment of 500Hz is used as input excitation signal. Two electrodes acts as input electrodes and two electrodes act as output electrodes. This method measures the impedance change due the blood volume changes along a segment. The change in blood volume is related to the electrical conductivity.
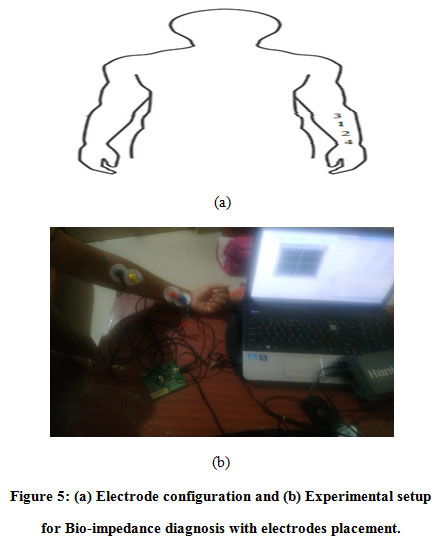 |
Figure 5: (a) Electrode configuration and (b) Experimental setup for Bio-impedance diagnosis with electrodes placement. |
Experimental Methods and Results
Experiment were conducted using AD5933EBZ evaluation board by Analaog Electronics. Initial configuration were done with start frequency set at 500Hz, Delta Frequency 50Hz with number of increments was set at 100. During frequency sweep each frequency value will stay for 14 seconds. Input exciation signal was set to sine wave of 2V peak to peak. Proper calibration was carried out by setting the value of feedback resistance between Vin and Vout voltage nodes for getting un distorted impedance wave.
Once the initial configuration was done program device register was loaded with the set values and made the setup to calculate the value of gain factor. Frequency sweep option was selected to excited the part upder study with differenct set frequencies. After taking the readings for a electrodes placements at a particular distance (22 cm initially) the electrodes are removed and distance between electrodes were changed to 20 cm and same procedure to get frequency sweep was done and readings were tabulated as given in table 1
Table 1: Experimental data with different electrodes placement distances.
| S.No | Electrodes distance in cm | Peak Impedance | Phase | Magnitude |
| 1 | 22 | 6172563 | 9.641915 | 6732.603 |
| 2 | 20 | 6178830 | 11.04035 | 6530.755 |
| 3 | 18 | 6086207 | 11.48377 | 6489.356 |
| 4 | 16 | 6109916 | 6.818947 | 6344.05 |
| 5 | 14 | 6168390 | 12.3733 | 6314.951 |
| 6 | 12 | 6282094 | 13.05496 | 6028.763 |
| 7 | 10 | 6271306 | 13.18936 | 6020.925 |
| 8 | 8 | 6203427 | 7.741548 | 6000.469 |
| 9 | 6 | 6100504 | 7.577627 | 5858.264 |
| 10 | 4 | 6032968 | 7.324137 | 5955.906 |
Graphs were plotted between electrodes distance in x-axis and its corresponding variation in magnitude and peak impedance value were plotted in y-axis as shown in figure 6 and figure 7. From graph it has been observed that magnitude varies linearly with respect to the variation in distance between electrodes as distance increases peak magnitude increases. It has been observed that resonance frequency where peak magnitude was obtained varies between 1700Hz to 1800Hz for various electrode distances.
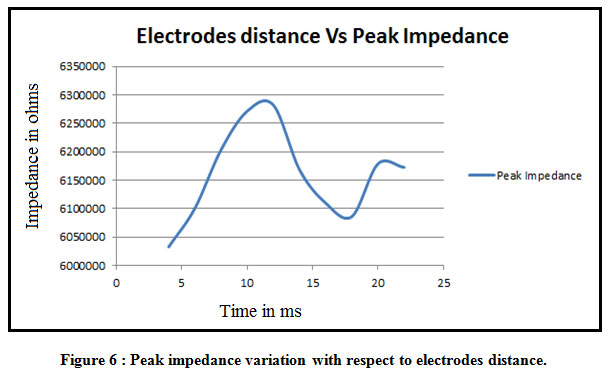 |
Figure 6 : Peak impedance variation with respect to electrodes distance. |
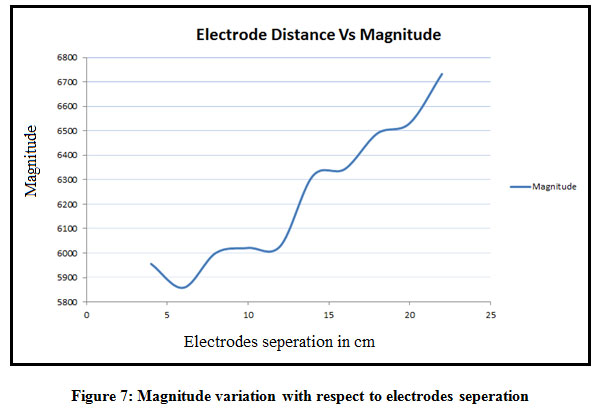 |
Figure 7: Magnitude variation with respect to electrodes separation . |
Conclusion
Analysis on electrodes placement with respect to distance was performed. The deviation in impedance signal with respect to magnitude due to location of the placement of electrode are differentiated. Magnitude and impedance variation due to the change in distance between electrodes under bio-impedance diagnosis were analyzed. Proper placement of electrode system to diagnosis particular diseases leads to the high efficient diagnosis of the patient condition.
Acknowledgement
The authors of this research work were thankful to Department of Biomedical Engineering, Sathyabama University and Centre for Energy, Sree Vidyanikethan Engineering College for providing needed support in all means.
Conflict of Interest
The three authors of this paper have no conflict of interest in any means
Funding Source
We have not received any funding from any external or internal funding agencies. Funding for this research work has been contributed by our self.
References
- Aimn Mohamed AdmedGhiet- “Robot arm control with Arduino”. June 2017. DOI:10.13140/RG:2.2.1027.53286.
- Amit Shelke, Manoj Botre, Ravikumar Mourya, Sourabh Satpute, Sushant Kakade, “Design and Implementation of Pick and Place Robotic Arm”, Vol.2,Issue1, April-September 2015, pp:232-240.
- Hari Krishnan, G., Ananda Natarajan, R., Nanda, A (2014) Synovial fluid density measurement for diagnosis of arthritis. BPJ 7(1): 221–224.
CrossRef - Gong WeiYan, LV JingHua, Wang Yan, Sha Hong, Zhao Shu, Ren ChaoShi, The impedance property of Electrode used in Electrical Bio-impedance Measurement, 3rd International Conference on Bioinformatics and Biomedical Engineering, Beijing, China, IEEE Xplore2009;11-13.
CrossRef - Tanaka, N.I, Miyatani, M, Masuo, Y, Fukunaga, T, Kanehisa, H, Applicability of a segmental bioelectrical impedance analysis for predicting the whole body skeletal muscle volume, J. Appl. Physiol., 2007; vol.103, pp.1688–1695.
CrossRef - Benjamin Sanchez, Adam Pacheck & Seward B. Rutkove, Guidelines to electrode positioning for human and animal electrical impedance myography research. Sci Rep 6, 32615 (2016).
CrossRef - Eiko Priidel, Paul Annus, Andrei Krivosei, Marek Rist, Raul Land, Mart Min and Olev Martens, Methods for detection of bioimpedance variations in resource constrained environmments. Sensors, Vol.20, 1363, pp 1-16, 2020.
CrossRef - Sami F. Khalil, Mas S. Mohktar and Fatimah Ibrahim, The Theory and Fundamentals of Bioimpedance Analysis in Clinical Status Monitoring and Diagnosis of Diseases. Sensors, Vol. 14, pp. 10896-10928, 2014.
CrossRef - Walter C Willett, Meir Stampfer and JoAnn Manson, Importance of electrode position in bioelectrical impedance analysis. The American Journal of Clinical Mitution, Vol. 56, pp. 10-15.
- Anand, G. Krishna, G. Mohandass, R. Hemalatha, and S. Sundaram (2010) Predicting grade of prostate cancer using image analysis software, Trends in Inform. Sciences and Computing (TISC). IEEE, pp 122–124.
CrossRef - Hari Krishnan, R. Ananda Natarajan & Anima Nanda. Microcontroller based non invasive diagnosis of knee joint diseases, IEEE conference on Information Communication and Embedded Systems (ICICES-2014), IEEE Xplore2014; pp:1-3.
CrossRef - Jia-Jung Wang, Wei-Chih Hu, Tsiar Kao, Chun-Peng Liu and Shih-Kai Lin, Development of forearm impedance plethysmography for minimally invasive monitoring of cardiac pumping function, Journal of Biomedical Science and Engineering 2011; Vol.4, pp:122-129.
CrossRef - TusharKantiBera, Bioelectrical Impedance Method for Noninvasive Health Monitoring: A Review, Journal of Medical Engineering2014; pp:1-28,.
CrossRef - Hari Krishnan, R. Ananda Natarajan & Anima Nanda. Impact of Upper Limb Joint Fluid Variation on Inflammatory Diseases Diagnosis, Journal of Electrical Engineering & Technology (JEET)2014; Vol.9, No. 6, pp:2114-2017.
CrossRef - Wang Lei, The effect of medical electrodes on ECG & EEG verification instrument measurement, Practical medical technology journal 2007; vol.4(20), pp: 2625-2626.
- RenChaoShi, Wang Yan, Deng Juan, The application study of Electrical Impedance Tomography, Chinese Journal of Medical Instrumentation 2007; vol. 31 (4), pp:235-238.
- Hari Krishnan, R. Ananda Natarajan & Anima Nanda. Comparative Study of Rheumatoid Arthritis Diagnosis Using two Different Methods 2014; BPJ, Vol.7, No.1, pp: 379-382.
CrossRef - Suxian Cai, Shanshan Yang, Fang Zheng, Meng Lu, YunfengWu, & Sridhar Krishnan,Knee Joint Vibration Signal Analysis with Matching Pursuit Decomposition and Dynamic Weighted Classifier Fusion, Computational and Mathematical Methods in Medicine2013; 1-11.
CrossRef - Hari Krishnan, G., Abhinaya, N., Hemalatha, R.J., Mohandass, G., “Hardware implementation for feedback control based health monitoring and drug delivery”, Biomedicine(India), 37(1), pp.123-126 (2017).
- Santhosh, S., Juliet, A.V. & Krishnan, G.H. Predictive analysis of identification and disease condition monitoring using bioimpedance data. J Ambient Intell Human Comput (2020). https://doi.org/10.1007/s12652-020-02452-7.
CrossRef - Sheeba Santhosh, A Vimala Juliet, G Hari Krishnan. “Bio Impedance Signal Anaysis with Variation in Input Signal Frequency”, International Journal of Advanced Trends in Computer Science and Engineering, Vol.9(4), pp.5332-5336 (2020).
CrossRef - Nandhini, P., Hari Krishnan, G., Umashankar, G. Home based telemedicine system for respiratory disorder, International Journal of Pharma and Bio Sciences, 6(4), pp.8227-8231 (2015).
- Sudhakar, T., Hari Krishnan, G., Santosh, S., Meenakshi, S., Thomas, “Prosthetic arm control using processing device, a comparative approach”, Biomedical Research (India), 29(13), pp.2904-2907 (2018).
CrossRef - Mohandass, G., Ananda Natarajan, R., Hari Krishnan, G. Comparative analysis of optical coherence tomography retinal image using multidimensional and cluster methods. Biomedical Research(India), 26(2), pp.273-285 (2015).
- Nagarjuna Reddy, A., Hari Krishnan, G., Raghuram, D., “Real time patient health monitoring using raspberry PI, Research Journal of Pharmaceutical, Biological and Chemical Sciences, 7(6), pp.570-575 (2016).
- Hari Krishnan, G., Umashankar, G., Abraham, S., “Cardiovascular disorder diagnosis using MR angiography”, Biomedical Research(India), 27(3), pp.773-775 (2016).
- Margreat, L., Hari Krishnan, G. “Stastical approach for diagnosis of diseases using histopathology data”, International Journal of Pharma and Bio Sciences, 6(2), pp. B199-B203.
- Umashankar, G., Hari Krishnan, G., Abraham, S., (…), Kirubika, T.R., Rajendran, M. Proximity sensing system for retinal surgery patients, Journal of Chemical and Pharmaceutical Sciences, 8(4), pp. 607-610.
- Ilangovan, N., Hari Krishnan, G. “Wheel chair movement control using human input: Comparative study approach”, Research Journal of Pharmaceutical, Biological and Chemical Sciences, 6(3), pp.568-570 (2015).
- Radhakrishna Rao, G., Hari Krishnan, G. Comparative study of pacemaker energy harvesting techniques, Research Journal of Pharmaceutical, Biological and Chemical Sciences, 6(1), pp.1545-1547 (2015).
- Sabarivani, A., Hari Krishnan, G. “Home health assistive system for critical care patients”, Research Journal of Pharmaceutical, Biological and Chemical Sciences, 6(2), pp.629-633 (2015).
- Hari Krishnan, G., Hemalatha, R.J., Umashankar, G., Ahmed, N., Nayak, S.R., “ Development of Magnetic Control System for Electric Wheel Chair Using Tongue”, Advances in Intelligent Systems and Computing 308 AISC (VOLUME 1), pp.635-641 (2015).
CrossRef - Hemalatha, R.J., Krishnan, G.H., Umashankar, G., Abraham, S. “Computerized breast cancer detection system”, Biosciences Biotechnology Research Asia 11(2), pp.907-910 (2014).
CrossRef - Abraham, S., Krishnan, G.H., Hemalatha, R.J., Divakaran, S., Umashankar, G. “Design of voice based pill ejector system”, Biomedical and Pharmacology Journal, 7(1), pp.231-234 (2014).
CrossRef - Umashankar, G., Hari Krishnan, G., Hemalatha, R.J., Abraham, S., Divakaran, S. “Assistive system for remote accident patients”, Research Journal of Pharmaceutical, Biological and Chemical Sciences, 5(5), pp.516-520 (2014).

