
Manuscript accepted on :31-Dec-2020
Published online on: 13-01-2021
Plagiarism Check: Yes
Reviewed by: Dr Rupesh Gautam
Second Review by: Dr Madiha Amjad
Final Approval by: Dr. Ayush Dogra
Ajay Kumar Shukla1, Rekha Mehani2, Swati Jain2 and Sheema Maqsood2
1AIIMS, Bhopal
2RKDF MCH RC Bhopal
Corresponding Author Email: drsheemamaqsood@gmail.com
DOI : https://dx.doi.org/10.13005/bpj/2117
Abstract
Background: United States Food and Drug Administration (FDA) is the fastest drug review agency in the world. FDA is responsible for the protection of public health by assuring that foods are safe, wholesome, sanitary and, properly labeled. Novel drug Approvals are usually innovative products to serve unmet medical needs or otherwise help to advance patient care. Methods: FDA novel drug approvals were analyzed from calendar year (CY) 2012 to 2018 based on not only their numbers but also BASED ON their impact, innovation, access, and predictability. Results: The total number of novel drugs approved from CY 2012 to 2018 was 279 (average 40 novel drugs/ year). Impact of novel drug approvals: 50% were first in class and 43% were for rare diseases. Overall expedited development and review methods were used in 63% of the novel drug approvals. Access of novel drug approvals: 84% were first-cycle approval, 74% were approved in the US before other countries, 58% priority reviews among novel drug approvals. Predictability of novel drug approvals: 98% approvals able to meet PDUFA goal dates for application review. Conclusions: Novel drug approvals during CY 2012-2018 had a high quality which is very much evident by their high impact, good access, and high predictability.
Keywords
BLA; FDA; NDA; NME; Novel drug approvals
Download this article as:| Copy the following to cite this article: Shukla K. A, Mehani R, Jain S, Maqsood S. Analysis of FDA Novel Drug Approvals. Biomed Pharmacol J 2021;14(1). |
| Copy the following to cite this URL: Shukla K. A, Mehani R, Jain S, Maqsood S. Analysis of FDA Novel Drug Approvals. Biomed Pharmacol J 2021;14(1). Available from: https://bit.ly/3qdCkc0 |
Introduction
In the United States (US), the US Food and Drug Administration (FDA) is responsible for the regulatory review of drugs and devices. Regulation of the development and approval of new medicines in the US is the responsibility of the FDA Center for Drug Evaluation and Research (CDER) and the FDA Center for Biologics Evaluation and Research (CBER).1 European Medicines Agency (EMA) is the centralized authorization procedure of medicines in Europe.2 Pharmaceuticals and Medical Devices Agency (PMDA) is responsible for reviewing applications for drugs in Japan.3
Pondering over the history of FDA back in 1906, the Pure Food and Drugs Act in 1906 was implemented for the prohibition of interstate commerce in adulterated and misbranded food and drugs. Food, Drug, and Cosmetic Act passed in 1938, according to which approval of all new drugs by the FDA before marketing was required. In 1962, the Kefauver-Harris amendment was passed which mandated proof of safety as well as efficacy before drug approval. In 2007, the FDA Amendments Act (FDAAA) was passed to enhance FDA authority to manage the safety of approved drugs and implementation of Risk Evaluation and Mitigation Strategies (REMS). The Food and Drug Administration Safety and Innovation Act (FDASIA) 2012 introduced a Breakthrough Therapy designation to expedite development and review of promising new drugs or serious and life-threatening diseases. 1
The estimated cost of the overall drug development process from discovery to approval of a new drug is $1 to $2 billion and spans over an average of 10–15 years. The emphasis on clinical trials to assess the efficacy and safety of new drugs has led to a marked rise in drug development costs. 1 During 1994-2003 in the span of 10 years, an average number of 33.6 new drugs approved per year by the FDA; in the following eight years up to 2011, there has been an average of slightly more than 26 approvals per year. 1,4 Thus, there has been a relative stagnation in the rate of novel drug approvals.
The FDA is responsible for the advancement of public health by boosting innovations that make more effective, safer, and affordable medicines and foods. Presently, the FDA is facing a huge challenge, and it is widely believed that it cannot accomplish missions with the resources allocated by the US Congress. There is a risk of not only the harm due to the unanticipated adverse effects from drugs but also due to the delay in the new drug approval with important beneficial effects due to the imperfect system in place. 5
To promote the development of drugs for orphan diseases, the Orphan Drug Act in 1983 was implemented. Under this act, financial incentives are offered to the pharmaceutical companies that develop drugs for orphan diseases. Orphan diseases are defined as diseases affecting fewer than 200,000 individuals in the United States. Apart from it, an orphan drug has an exclusive approval for the orphan indication for 7 years following approval. This act has been very successful in promoting the development of new drugs for orphan diseases. The development of drugs for orphan diseases presents several challenges. With a very less number of patients, designing the clinical trial is very challenging. If the disease has a natural long history or heterogeneous in its clinical course, the assessment of the expected treatment effect becomes even more challenging. 1,6
To meet serious unmet needs, FDA employs four principal mechanisms to expedite drug development. These are Fast Track designation, Breakthrough Therapy designation, Accelerated Approval, and Priority Review. Although each expedited program is intended to target novel drugs for serious conditions, each program has its qualifying criteria and advantages.1 In the EU, there are two assessment categories: The standard assessment and accelerated assessment. The Committee for Medicinal Products for Human Use (CHMP) has to finalize their opinion for the accelerated assessment and standard assessment within 150 and 210 days after submission of applications, respectively.7 In Japan, standard review and priority review categories are there with a target review time of nine and 12 months respectively.8
To overcome the stagnation in the number of novel drug approvals and to foster an environment to promote novel drug approvals FDA regulations for drug approval are continuously evolving in the form of revisions of PDUFA and the introduction of new acts. Therefore, this study was conducted regarding novel drug approvals in the CY 2012-2018 to evaluate the novel drug approvals.
Methods
The information was obtained about regulatory approvals of novel drugs by the U.S. FDA from publicly accessible databases. 9,10 The definition of “new molecular entities” included both New Drug Applications (NDAs) and Biologics License Applications (BLAs). The information about the original new drug approvals (NDAs and BLAs) was retrieved from CY 2012 to 2018. Original abbreviated new drug approvals (ANDAs) and supplemental approvals were not included for analysis. The obtained information was analyzed using a Microsoft Excel worksheet.
Number of FDA novel drug approvals during the period of CY 2012- 2018 were evaluated and the average number of drugs approved during this period was compared with the average number of FDA novel drug approvals during CY 2005 to 2011.
Evaluation of quality of FDA novel drug approvals from CY 2012 to 2018 based on four parameters i.e., their impact, innovation, access, and predictability was also done. 11
The impact of novel drug approvals was assessed based on two parameters: percentage of novel drug approvals which were (a) First in Class (FIC) (b) orphan drugs.
The innovation of novel drug approvals the period of CY 2012- 2018 was assessed based on the percentages of approvals for which expedited novel drug approvals methods were utilized. The overall use of expedited development and review methods in the study period was analyzed. In this assessment, four expedited development, and review pathways were included Fast Track designation, Breakthrough designation, Accelerated Approval pathway, and Priority Review designation.
Access was assessed based on three parameters: percentage of novel drug approvals which were (a) first cycle approval (b) approval in the U.S. before other countries and (c) priority reviews. 11
Predictability was assessed based on the percentage of novel drug approvals that we’re able to meet the PDUFA goal dates for the application review.
Results
The authors evaluated the quality of novel drug approvals during CY 2012- 2018 in terms of the total number of novel drug approvals, their impact, innovation, predictability, and access in the above-mentioned period. An average number of novel drugs approvals during the CY 2012- 2018 is 40 novel drugs per year (Table 1 and 2). Total numbers of novel drugs approved during CY 2012 to 2018 and CY 2005 to 2011 were 279 and 161, respectively. (Table 3) Thus, the average number of novel drug approvals during the period of CY 2012- 2018 is 1.7 times more than the average number of novel drug approvals during CY 2005 to 2011( 23 novel drug approvals per year). (Figure 1, Table 3)
Table 1: Novel new drug approvals from calendar year 2012 to 2018.
| Calendar year | Novel drug approvals |
| 2012 | 39 |
| 2013 | 27 |
| 2014 | 41 |
| 2015 | 45 |
| 2016 | 22 |
| 2017 | 46 |
| 2018 | 59 |
| Total drug approvals | 279 |
Table 2: Novel new drug approvals from calendar year 2012 to 2018.
| Calendar year | Approved novel drugs |
| 2012 | Amyvid, Aubagio, Belviq, Bosulif, Choline C-11, Cometriq, Elelyso, Eliquis, Erivedge, Fulyzaq, Fycompa, Gattex, Iclusig, Inlyta, Jetrea, Juxtapid, Kalydeco, Kyprolis, Linzess, Myrbetriq, Neutroval, Omontys, Perjeta, Picato, Prepopik, raxibacumab, Signifor, Sirturo, Stendra, Stivarga, Stribild, Surfaxin, Synribo, Tudorzapressair, Voraxaze, Xeljanz, Xtandi, Zaltrap, Zioptan |
| 2013 | Actemra, Adempas, AnoroEllipta, Apitom, BreoEllipta, Brintellix, Dotarem, Duavee, Gazyva , Gilotrif, 2013 Imbruvica, Invokana, Kadcyla, Kynamro, Luzu, Lymphoseek, Mekinist, Nesina, Olysio,Opsumit,
Osphena, Pomalyst, Sovaldi, Simponi, Tafinlar, Tecfidra, Tivicay, Vizamyl, Xofigo |
| 2014 | Akynzeo, Beleodaq, Belsomra, Blincyto, Cerdelga, Cyramza, Dalvance, Entyvio, Esbriet, Farxiga,
Harvoni, Hetlioz, Impavido, Jardiance, Jublia, Kerydin, Keytruda, Lumason, Lynparza, Movantik, 2014 Myalept, Neuraceq, Northera, Ofev, Opdivo, Orbactiv, Otezla, Plegridy, Rapivab, SivextroSylvant, Striverdi Respimat, Tanzeum, Trulicity, Viekira Pak Vimizim, Xtoro, Zerbaxa, Zontivity, Zydelig, Zykadia, |
| 2015 | Addyi, Alecensa, Aristada, Avycaz, Bridion, Cholbam, Corlanor, Cosentyx, CotellicCresemba, Daklinza,
Darzalex, Empliciti, Entresto, Farydak, Genvoya, Ibrance, Kanuma, Kengreal, Kybella, Lenvima, Lonsurf, 2015 Natpara, Ninlaro, Nucala, Odomzo, Orkambi, Portrazza, Praluent, Praxbind, Repatha, Rexulti, Savaysa, Strensiq, Tagrisso, Tresiba, Unituxin, Uptravi, Varubi, Veltassa, Viberzi, Vraylar, Xuriden, Yondelis, Zurampic |
| 2016 | Adlyxin, Anthim, Axumin, Briviact, Cinqair, Defielio, Epclusa, Eucrisa, Exondys 51, Lartruvo, Netspot, Nuplazid, Ocaliva, Rubraca, Spinraza, Taltz, Tecentriq, Venclexta, Xiidra, Zepatier, Zinbryta, Zinplava |
| 2017 | Aemcolo, Aimovig, Ajovy, Akynzeo, Annovera, Asparlas, Biktarvy, Braftovi, Copiktra, Crysvita, Daurismo, Diacomit, Doptelet, Elzonris, Emgality, Epidiolex, Erleada, Firdapse, Galafold, Gamifant, Ilumya, Krintafel, Libtayo, Lokelma, Lorbrena, Lucemyra, Lumoxiti, Lutathera ,Mektovi, Motegrity, moxidectin, Mulpleta, Nuzyra, Olumiant, Omegaven, Onpattro, Orilissa, Oxervate,Palynziq, Pifeltro, Poteligeo, Trogarzo, Revcovi, Ultomiris, Seysara, Vitrakvi, Symdeko, Vizimpro, Takhzyro,Xerava, Talzenna, Xofluza, Tavalisse, Xospata, Tegsedi, Yupelri, Tibsovo, Zemdri,Tpoxx |
| 2018 | Aliqopa, Brineura, Alunbrig, Calquence, Austedo, Dupixent,Bavencio, Emflaza, Baxdela, Fasenra, benznidazole, Giapreza, Besponsa, Hemlibra, Bevyxxa, Idhifa, Imfinzi, Ocrevus, Solosec, Ingrezza, Ozempic, Steglatro, Kevzara, Parsabiv,Symproic, Kisqali, Prevymis, Tremfya, Macrilen, Radicava, Trulance, MavyretRhopressa, Tymlos, Mepsevii, Rydapt ,Vabomere, Nerlynx,Siliq, Verzenio, Vosevi, Vyzulta, Xadago, Xermelo ,Xepi, Zejula |
Table 3: Novel new drug approvals from calendar year 2005 to 2011.
| Calendar Year | Novel drug approvals |
| 2005 | 20 |
| 2006 | 22 |
| 2005 | 18 |
| 2008 | 24 |
| 2009 | 26 |
| 2010 | 21 |
| 2011 | 30 |
| Total drug approvals | 161 |
 |
Figure 1: Novel drug approvals during CY 2005-2011 and 2012-2018 |
The impact of novel drug approvals during CY 2012 to 2016 was measured in terms of FIC and orphan drugs. There were 40% novel drug approvals which were FIC during this period. In this tenure of seven years between CY 2012 to 2018, 43% of the novel drug approvals were orphan drugs (Table 4).
Table 4: Impact of the novel drugs approved from calendar year 2012 to 2018
| Calendar year | First in class | Drugs for rare disease |
| 2012 | 20(51%) | 13 (33%) |
| 2013 | 9 (33%) | 9 (33%) |
| 2014 | 17 (41%) | 17 (41%) |
| 2015 | 16 (36%) | 21 (47%) |
| 2016 | 8 (36%) | 9 (41%) |
| 2017 | 15 (33%) | 18 (39 %) |
| 2018 | 19 (32 %) | 34 (58%) |
| Total drug approvals | 141 (50%) | 121 (43%) |
The innovation of novel drug approvals the period of CY 2012- 2018 was assessed based on the percentages of methods for which expedited novel drug approvals methods were utilized. Overall expedited development and review methods were used in 63% of the novel drug approvals. The slope time course of novel drug approvals with time shows a positive trend figure 2,3 (Table 5).
Table 5: Percentage of fast Track designation, Breakthrough designation, Accelerated Approval pathway and Priority Review
| Calendar year | PDUFA target dates met |
| 2012 | 38 (97%) |
| 2013 | 27 (100%) |
| 2014 | 40 (98%) |
| 2015 | 43 (96%) |
| 2016 | 21 (95%) |
| 2017 | 46 (100%) |
| 2018 | 59 (100%) |
| Total drug approvals | 274 (98%) |
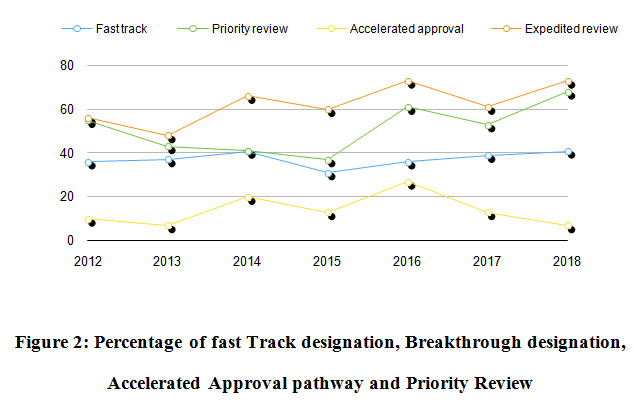 |
Figure 2: Percentage of fast Track designation, Breakthrough designation, Accelerated Approval pathway and Priority Review |
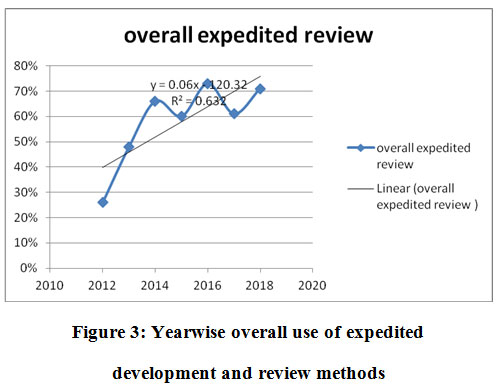 |
Figure 3: Yearwise overall use of expedited development and review methods |
During CY 2012 to 2018, predictability of novel drug approvals during was measured in terms of novel drug approvals which were able to meet or exceed PDUFA goal dates. During the study period, 98% of the novel drug approvals were able to meet or exceed PDUFA goal dates for application review (Table 6).
Table 6: Predictability of novel drugs approved from calendar year 2012 to 2018.
|
Calendar year |
PDUFA target dates met |
| 2012 | 38 (97%) |
| 2013 | 27 (100%) |
| 2014 | 40 (98%) |
| 2015 | 43 (96%) |
| 2016 | 21 (95%) |
| 2017 | 46 (100%) |
| 2018 | 59 (100%) |
| Total drug approvals | 274 (98%) |
During the study period CY 2012 to 2018, access to novel drug approvals was measured in terms of first cycle approvals, approvals in the US before other countries, and percentage of priority reviews. During this period, 84% of the novel drug approvals were first-cycle approvals and 74% of the novel drug approvals were approvals in the US before other countries (Table 7). During this period, the percentage of priority reviews among novel drug approvals was 58% (Figure 4).
Table 7: Access of the novel drugs approved from calendar year 2012 to 2018
| Calendar year | First cycle approval | Approval in US before other countries |
| 2012 | 31 (79%) | 30 (77%) |
| 2013 | 24 (89%) | 10 (34%) |
| 2014 | 26 (63%) | 41(78%) |
| 2015 | 39 (87%) | 29 (64%) |
| 2016 | 21 (95%) | 19 (86%) |
| 2017 | 39 (85%) | 38 (78%) |
| 2018 | 56 (95%) | 42 (71%) |
| Total drug approvals | 236 (84%) | 207 (74%) |
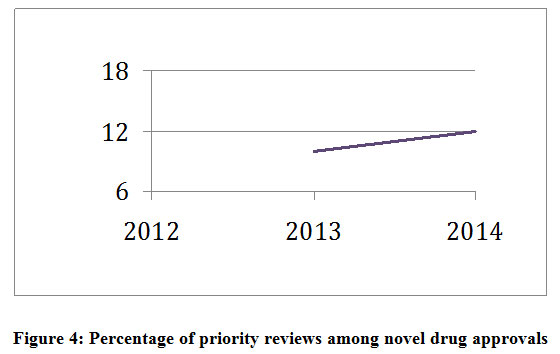 |
Figure 4: Percentage of priority reviews among novel drug approvals. |
Discussion
During the period of CY 2012-2018, there were 279 novel drug approvals with an average of 40 novel drug approvals per year. The novel drug approvals during this period had a high impact which is evident by the fact that these drug approvals were 50% FIC and 43% for orphan diseases. Overall expedited development and review methods were used in 63% of the novel drug approvals. There was high predictability evident by the fact that 98% of novel drug approvals were able to meet PDUFA goal dates. There was good access to novel drug approvals which is evident by the 89% first cycle approvals, 58% priority reviews, and 74% approvals in the US before other countries.
There were 279 novel drug approvals from CY 2012 to 2018 (40 novel drug approvals per year) while during the period of CY 2005 to 2011, there were only 161 novel drug approvals (23 novel drugs approvals per year). Thus, as compared to a period of CY 2005 to 2011, during the period of CY 2012 to 2018, there was the rise in the total number of novel drug approvals (from 161 during CY 2005-2011 to 279 during CY 2012-2018) with a significant rise in the average number of novel drug approvals per year (from 23 during CY 2005-2011 to 40 during CY 2012-2018) . 10
The impact of the novel drug approvals is a measure of their potential positive impact and unique contributions to quality medical care and public health. FIC drugs offer new therapeutic options for the treatment of previously untreatable conditions.1 There were 50% of first in class novel drug approvals thus offering new therapeutic options for the offer new treatment of previously untreatable diseases. Thus, overall 141 first in the class drugs were approved during the span of the period from CY 2012-2018 offering new treatment options that were previously not available. Thus, FIC drugs have an impact on playing their distinctive role in public health.
There are about 350 million people are suffering from rare diseases all over the world and less than 5% of these rare diseases. As a result of the orphan drug act 1983, now a day’s more than 400 drugs have been approved for the treatment of rare diseases. By March 2017, 599 drug approvals have been designated orphan drug status.11 According to the National Institute of Health estimates about 50% of people affected by rare diseases are children. About 30% of children suffering from rare diseases die before their fifth birthday and 35% of deaths caused by the rare diseases occur within the first year of life.8 During CY 2012 to 2018, there were 43% of the novel drug approvals for the rare or orphan diseases. From 2005 through 2011, there were only 40 novel drug approvals with orphan drug designation while there were 121 novel drug approvals with orphan drug designation between 2012 and 2018. Thus, a higher number of treatment alternatives became available for patients suffering from rare diseases.
New drug development is a lengthy and costly process. The cost of discovering and developing a new drug is estimated to be around $1.2 billion while according to some estimates its cost is up to $5 billion. Out of 10,000 chemical compounds considered as promising at initial screening assays, fewer than ten make it to the clinical phase, and eventually; approval is achieved by only two. Among novel drug approvals, there were 236 (84%) first cycle approvals, as a marker of high access. First cycle approvals may be viewed as a proxy for either for quality of the submitted FDA new drug applications, the willingness of the FDA to approve new drugs or both. There has been sustained improvement in the number of first-cycle approvals from CY 2008 to 2018.
Novel drug approval in the US before other countries is another measure of access. Although there are wide differences in the regulatory processes of the FDA and those of regulatory agencies in other countries, a comparison of approval to other countries offers another measure of approval efficiency. There were 69% novel drug approvals in the US before other countries during CY 2012 to 2018. These innovative treatment options became available in the US before any other country in the world.
Priority reviews are a mode for allocating staff and resources for promoting access for innovativeness. FDA is responsible for taking decisions on the review designation for every application.12 Priority review designation leads to a decreased duration of 6 months to review application instead of 10 months duration for standard review. This had encouraged earlier access to newer innovative drug treatment without compromising with approval standards. The various expedited review programs act as key regulatory levers. These programs act in response to the mounting need for fast access to new drug approvals.
All expedited review programs have their criteria, It is not clear if these differences in criteria would result in a drug approved under one program is associated with larger QALY gains than drug approved under a different program. For encouraging innovation to fulfill unmet health needs is a priority for health policymakers. Alleviating the path toward innovation is a notable goal, but the key question stands at how the initiatives will improve health outcomes. The advantage of expedited review programs is that it hastens the delivery of promising and highly needed treatments to patients and also provides incentives for pharmaceutical innovation. 12
Drug approvals subjected to shorter reviews carry more chances to be withdrawn for safety reasons and bear subsequent black-box warnings. For drug approvals in the accelerated approval, the FDA has had little success to ensure the timely performance of the mandated post-approval trials to validate the findings from surrogate endpoints.
The main objective of PDUFA is to allocate additional resources for ensuring safe and effective medicine availability promptly. By ensuring adequate staffing and resource availability, PDUFA implementation has improved the consistency, predictability, and efficiency of FDA reviews. As per PDUFA, FDA can hire more reviewers to facilitate more reviews and meetings. PDUFA V has mandated the frequent communications between FDA and the sponsor. This can be one of the promoters for the consistently high first cycle approvals and the ability to meet PDUFA target dates.13 There were 98% novel drug approvals that were able to meet their target date which indicates high predictability.
Thus, authors can implicate various factors for the quantitative as well as qualitative improvement of novel drug approvals.
Orphan drug act 1992 under which various incentives are provided to the pharmaceutical companies contributing to the orphan drug discovery and development. 14
Assigning the designation of priority reviews and decreasing their review time from ten months to six months.
PDUFA-this act is renewed every five years and it makes changes appropriate to facilitate the drug approval process without compromising with quality standards. With time, PDUFA has mandated the frequent communications of FDA with the applicant pharmaceutical companies of drug approval. 13 This has progenerated into higher access of applicants to FDA and henceforth, a higher number of first-cycle approvals.
More flexible drug review process of the FDA than any other country without compromising approval standards has played a pivotal role in the approval of innovative drugs in the US before other countries.
Conclusion
There has been a high impact, good access, and high predictability of novel drug approvals during CY 2012- 2018. During the period of CY 2012 to 2018, there was a significantly high percentage of novel drug approvals which were first in class (50%) and for rare diseases (43%) signifying their positive impact and unique contributions to quality care and public health. There was a high percentage of first cycle approvals (84%) and approvals in the U.S. before other countries (69%), higher priority reviews (58%) as compared to standard drug reviews signifying sustained good access for FDA novel drug approvals. More than 95% (97%) of novel drug approvals were able to meet the PDUFA goal dates for the application review year reaching signifying consistently high predictability. In this study, we analyzed the quality of novel drug approvals by using parameters impact, predictability, and access for a span of the last five years only. This improvement is encouraging but it is early to anticipate that it reflects long term trends. We can plan further studies of longer span to look out for the trends in impact, predictability, and access to FDA novel drug approvals.
Conflict of interest
There are no conflict of interest.
Funding Sourse
There are no funding sourse
References
- Vahle JL, Hutto DL, Postema M. Drug Discovery and Preclinical Development. In: Golan DE, Armstrong EJ, Armstrong AW, editors. Principles of Pharmacology. 4th ed. Philadelphia: Wolters Kluwer Health; 2017. 919-32.
- Pignatti, F.; Gravanis, I.; Herold, R.; Vamvakas, S.; Jonsson, B.; Marty, M. The European Medicines Agency: An overview of its mission, responsibilities, and recent initiatives in cancer drug regulation. Clin. Cancer Res.2011, 17, 5220–5225.
CrossRef - PMDA Website. Organization. Available online: https://www.pmda.go.jp/english/about-pmda/outline/0003.html (accessed on 3 May 2020).
- Drugs@FDA: FDA-Approved Drugs. https://www.accessdata.fda.gov/scripts/cder/daf/. Accessed April 27, 2020.
- Rivera SM, Alfred Goodman Gilman AG.Drug Invention and the Pharmaceutical Industry.In: Brunton LB, Hilal-Dandan R, Knollman BC, eds. Goodman and Gilman’s The Pharmacological Basis of Therapeutics.13th ed. New York, NY: Mcgraw-Hill;2018:3-11.
- Rare Diseases-A Report on orphan Drugs in the pipeline. 2013. Available at: http://phrma- docs.phrma.org/sites/default/files/pdf/Rare_Diseases_ 2013.pdf.
- EMA Website. Guideline on the Scientific Application and the Practical Arrangements Necessary to Implement the Procedure for Accelerated Assessment Under Article 14(9) of Regulation (EC) No 726/2004. Available online: https://www.ema.europa.eu/en/documents/scientific-guideline/guideline-scientific-applicationpractical-arrangements-necessary-implement-procedure-accelerated/2004_en.pdf (accessed on 1 May 2020).
- Nagai, S.; Ozawa, K. Regulatory approval pathways for anticancer drugs in Japan, the EU, and the US. Int. J.Hematol. 2016, 104, 73–84.
CrossRef - New Drugs at FDA: CDER’s New Molecular Entities and New Therapeutic Biological Products https://www.fda.gov/drugs/new-drugs-fda-cders-new-molecular-entities-and-new-therapeutic-biological-products/novel-drug-approvals.
- Drugs@FDA: FDA Approved Drug Products. 2018, Available at: https://www.accessdata.fda.gov/scripts/cder/daf/inde x.cfm. Accessed 02 March 2020
- Novel Drug Approvals. 2017. Available at: https://www.fda.gov/downloads/Drugs/Development/ApprovalProcess/DrugInnovation/UCM536693.pdf.
- Priority Review. 2018. Available at: https://www.fda.gov/forpatients/approvals/fast/ucm4 05405.htm. Accessed 10 March 2020
- PDUFA Reauthorization Performance Goals and Procedures Fiscal Years 2013 Through 2017. Available at: https://www.fda.gov/downloads/ForIndustry/UserFees/PrescriptionDrugUserFee/UCM270412.pdf. Accessed 04 March 2020
- Enrique Seoane-Vazquez, Rosa Rodriguez-Monguio, Sheryl L Szeinbach, and Jay Visaria. Incentives for orphan drug research and development in the United States. Orphanet Journal of Rare Diseases 2008, 3:33
CrossRef

