
Manuscript accepted on :31-Oct-2020
Published online on: 05-11-2020
Plagiarism Check: Yes
Reviewed by: PP Mohanty
Second Review by: Jes Rejoice
Final Approval by: Dr. Francesca Gorini
V. Santhosh , G. Gurulakshmi, A. Khadeja, Suganya and M. Gomathi
Karpaga Vinayaga Institute of Medical Sciences, Madhuranthagam, Chengalpet, Kanchipuram, Tamil Nadu
Corresponding Author E-mail : gurulax23@gmail.com
DOI : https://dx.doi.org/10.13005/bpj/2047
Abstract
Free thyroxin hormones FT4 and FT3 are unbounded thyroid hormone are biologically active and involves in regulation of metabolism. Measuring the concentrations of free thyroid hormones is of great diagnostic value. A cross sectional study was carried out during the March 2019 to September 2019 in patients between 18 years to 60 years. A total of 60 samples were collected from 30 patients attending Karpaga Vinayaga Institute of Medical Sciences at morning (6am-8am) and 2nd sampling at night (8pm-9pm). FT4, FT3 and TSH were measured by Enzyme linked immunosorbent assay, using Avantor kit.In our study 36.67% participants were males, 63.3% participants were females. The mean FT3, FT4 and TSH in day are 2.43±0.56, 1.14±0.44 and 2.74±3.16 respectively. The mean night FT3, FT4 and TSH are 2.66±0.55, 1.3±0.61 and 3.21±3.18 respectively. The one sample t test shows difference of FT3, t 4.489 and p value 0.000, FT4, t value 3.092 and p value 0.004 and TSH t value 3.394 and p value 0.002. The time of blood sampling has an important role in the interpretation of TSH levels. However fluctuations in diurnal variations in thyroid hormone levels are less. In our study although statistically significant, all the values are within the normal biological reference interval Further studies in larger cohorts is essential to desire important conclusions.
Keywords
Diurnal variation; FT3; FT4; TSH
Download this article as:| Copy the following to cite this article: Santhosh V, Gurulakshmi G, Khadeja A, Suganya, Gomathi M. The Diurnal Variation of Thyroid Hormones in Individuals Attending Tertiary Care Hospital, Kanchipuram District. Biomed Pharmacol J 2020;13(4). |
| Copy the following to cite this URL: Santhosh V, Gurulakshmi G, Khadeja A, Suganya, Gomathi M. The Diurnal Variation of Thyroid Hormones in Individuals Attending Tertiary Care Hospital, Kanchipuram District. Biomed Pharmacol J 2020;13(4). Available from: https://bit.ly/2I3i3oT |
Introduction
The Thyroid hormones, thyroxine T4 and triiodo thyronine T3 are produced by the thyroid gland and are pivotal for regulation of metabolism. Thyroxine T4 and triiodo thyronine T3 are derived from tyrosine. Free forms of thyroid hormones, free thyroxine FT4 and free triiodo thyronine Ft3 are also important for the regulation of metabolism. The thyroid hormones are essential for proper development and differentiation of all cells of the human body (1). Large amounts of the thyroid hormones which are circulating in the blood are bound to transport protein. The free (unbound) thyroid hormones constitute a very small fraction and are set to be biologically active, which makes estimation of free thyroid hormones of greater diagnostic value. Thyroxine-binding globulin (TBG) is a high affinity binding protein in low concentration that binds approximately 80% of T3 and 75% of T4 (2).
The anterior pituitary gland secrets thyroid stimulating hormones (TSH). TSH is a glycoprotein with a dimeric structure (α and β). TSH is said to show a diurnal variation with a peak after midnight and nadir in the late afternoon. The variation in TSH is such that the peak value can be double the value at the nadir (3). The values of TSH can vary to 20 % in between measurements without any changes in the thyroid status (4).
It is observed that all the circulating T4 is secreted by the thyroid gland while only 20% of T3 is derived from it. The rest 80% is said to be derived from the peripheral conversion of T4 to T3. There is a difference in the kinetics of T3 and T4 metabolism due to the lower affinity of T3 for thyroid binding globulin (5). The difference of affinity is said to be 10-15 fold lower than T4(5).
Thyroid illness is very common worldwide, it is a significant burden to the health care system of India. Recent studies which are based on thyroid illness have estimated 4.2 crore people to have thyroid illness in India(6). Subclinical hypothyroidism is said to be linked with many pathological abnormalities from infertility, complications during pregnancy, psychiatric illness, neuromuscular symptoms, cardiac dysfunction and mortality (7, 8).
Pituitary disease, certain drugs can cause Non- Thyroidal Illness (NTI) and produce disturbance in TSH and thyroid hormone levels. Glucocorticoids, dopamine and octreotide are known to suppress TSH secretion. Drugs like amiodarone are said to affect thyroid hormone level by inhibiting their peripheral metabolism. Hence estimation of free thyroid hormones are important in those who are on amiodarone treatment (9).
Recent evidences have documented the levels of free thyroid hormones in the blood are accurate when compared to the analysis of total thyroid hormones, thus free thyroxine FT4 hormone evaluation is practised as an routine procedure to know the thyroid status of the patients.
Recent hypothesis on free thyroid hormones is that the bound thyroid hormones are not available for use on demand and only the free thyroid hormones are available for cellular uptake (10). As studies have proven that TT4 has a very poor affinity for the thyroid hormone nuclear receptor. While T3 is avidly bound to the latter and responsible for the clinical effects, indicating that T4 is the pre hormone and needs to be converted to the active hormone T3 (11,12).
In many physiologic and disease states, there is an alteration in serum binding protein which can affect the Immunoassays of thyroid hormone (13). The assay of thyrotropin is useful in detecting thyroid related disorders (14). Recent evidences have proven that the excess variation in the free thyroid hormone values is observed due to the different methods of immunoassays that are performed (15-19). Enzyme linked immunosorbent assay has been proved to be a useful test for the detection of FT3, FT4 and TSH status of an individual (3).
Materials and Methodology
The study was conducted from March 2019 to September 2019. The study was a cross sectional study. Patients aged above 18 years to 60 years were selected. Convenient sampling method was followed. The study included 60 samples collected from 30 patients from attending the outpatient, Department of General medicine, Karpaga Vinayaga Institute of Medical Sciences and Research Centre. The samples were collected from 6AM-8AM in the morning and the second sample was collected in the night from 8.00PM to 9.00PM and informed consent was obtained from all the participants. The institutional ethical committee had approved the study. FreeT3 (FT3),FreeT4(FT4) and Thyroid Stimulating Hormone (TSH) were measured by Enzyme linked immunosorbent assay, using Avantor kit (9).
Inclusion criteria
Patients above 18 years- 60years of age were selected for the study.
Exclusion criteria
People with known history of thyroid disorder (with or without treatment), Diabetes mellitus, Hypertension, Chronic renal failure.
Patients not willing to take part in the study.
Patients who are fulfilling inclusion & exclusion criteria, after obtaining written informed consent will be subjected to complete history taking, physical examination, serum FT3, FT4 & TSH level estimation at two time intervals.
Serum FreeT3 (FT3),FreeT4(FT4), Thyroid Stimulating Hormone(TSH) levels were measured using Enzyme linked immunosorbent assay (ELISA). Appropriate statistical methods were used to analyse the study.
Biological Reference Interval (20)
FreeT3 (FT3): 1.4-4.2 pg/mL
FreeT4 (FT4): 0.8-2.0 ng/dL
TSH: 0.39-6.16 µIU/mL
Statistics
Descriptive analysis was carried out by mean and standard deviation for quantitative variables, frequency and proportion for categorical variables. Non normally distributed quantitative variables was summarized by median and interquartile range (IQR). Data was also represented using appropriate diagrams like bar diagram, pie diagram and box plots.
All Quantitative variables were checked for normal distribution within each category of explanatory variable by using visual inspection of histograms and normality Q-Q plots. Shapiro- wilk test was also conducted to assess normal distribution. Shapiro wilk test p value of >0.05 was considered as normal distribution.
For normally distributed Quantitative parameters the mean values were compared between study groups using Independent sample t-test (2 groups). Correlation between the manual and FT3, FT4 and TSH (day and night) were assessed by Pearson correlation coefficient. Data was presented in scatter plots.
Bland-Altmann plots were computed to assess the level of agreement between various manual methods and FT3, FT4 and TSH to assess at different time periods (day and night)
Pearson’s value (p) < 0.05 was considered statistically significant. IBM SPSS version 22 was used for statistical analysis (21).
Results
A total of 30 subjects were included in the analysis.
Table 1: Descriptive analysis of age in study population (N=30)
| Parameter | Mean ± SD | Median | Minimum | Maximum | 95% C.I | |
| Lower | Upper | |||||
| Age | 35.03 ± 13.01 | 37.00 | 18.00 | 60.00 | 30.18 | 39.89 |
In the study population, the mean of age was 35.03 ± 13.01 with the minimum age was 18 years and maximum age of 60 years. ( Table 1).
Table 2: Gender analysis of the study population (N=30) – descriptive
| Gender | Frequency | Percentages |
| Male | 11 | 36.67% |
| Female | 19 | 63.33% |
Eleven (36.67%) participants were males and the remaining 19 (63.33%) participants were female. (Table 2 & Figure 1)
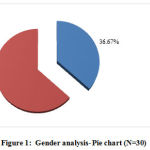 |
Figure 1: Gender analysis- Pie chart (N=30) |
Table 3: Descriptive analysis of thyroid profile day and night (N=30)
| Parameter | Mean ± SD | Median | Minimum | Maximum | 95% C.I | |
| Lower | Upper | |||||
| Day FT3 (pg/mL) | 2.43 ± 0.56 | 2.36 | 1.24 | 3.95 | 2.22 | 2.64 |
| Day FT4 (ng/dL) | 1.14 ± 0.44 | 1.01 | 0.46 | 2.14 | 0.98 | 1.31 |
| Day TSH (µIU/mL) | 2.74 ± 3.16 | 1.76 | 0.98 | 8.57 | 1.55 | 3.92 |
| Night FT3 (pg/mL) | 2.66 ± 0.55 | 2.57 | 1.62 | 4.01 | 2.46 | 2.87 |
| Night FT4 (ng/dL) | 1.3 ± 0.61 | 1.06 | 0.63 | 2.80 | 1.08 | 1.53 |
| Night TSH (µIU/mL) | 3.21 ± 3.18 | 2.30 | 1.02 | 8.58 | 2.03 | 4.40 |
The mean of Day FT3 was 2.43 ± 0.56 pg/mL, minimum was 1.24 and maximum was 3.95 (95% CI 2.22 to 2.64). The mean of Day FT4 was 1.14 ± 0.44 ng/dL, minimum was 0.46 and maximum was 2.14 (95% CI 0.98 to 1.31). The mean of Day TSH was 2.74 ± 3.16 µIU/mL, minimum was 0.98 and maximum was 8.57 (95% CI 1.55 to 3.92). The mean of Night FT3 was 2.66 ± 0.55 pg/mL, minimum was 1.62 and maximum was 4.01 (95% CI 2.46 to 2.87). The mean of Night FT4 was 1.3 ± 0.61 ng/dL, minimum was 0.63 and maximum was 2.8 (95% CI 1.08 to 1.53). The mean of Night TSH was 3.21 ± 3.18 µIU/mL, minimum was 1.02 and maximum was 8.58 (95% CI 2.03 to 4.4) (Table 3).
Table 4: Agreement between day and night values of TFT parameters
| TFT parameters | Intra class correlation | 95% CI | P value | |
| Lower | Upper | |||
| FT3 | 0.863 | 0.732 | 0.932 | <0.001 |
| FT4 | 0.858 | 0.723 | 0.930 | <0.001 |
| TSH | 0.971 | 0.939 | 0.986 | <0.001 |
There is a positive correlation between day and night TFT values (p<0.001) (Table 4).
Table 5: One sample t test to assess the significance
| Parameter | Number | Mean | Std. Deviation | t | Df | Sig. (2-tailed) |
| Difference of FT3 | 30 | 0.2370 | .28917 | 4.489 | 29 | .000 |
| Difference of FT4 | 30 | 0.1603 | .28403 | 3.092 | 29 | .004 |
| Difference of TSH | 30 | 0.4770 | .76972 | 3.394 | 29 | .002 |
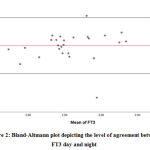 |
Figure 2: Bland-Altmann plot depicting the level of agreement between FT3 day and night |
Bland-Altman analysis showed the average difference between night, day values of FT3 was 0.23 pg/mL with a 95% confidence interval of -0.329 to 0.903. There was also a high risk of proportion bias (P value<0.001). (Figure 2)
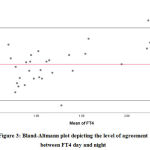 |
Figure 3: Bland-Altmann plot depicting the level of agreement between FT4 day and night |
Bland-Altman analysis showed the average difference between night day values of FT4 was 0.16 ng/dL with a 95% confidence interval of -0.396 to 0.716. There was also a high risk of proportion bias (P value<0.001). (Figure 3)
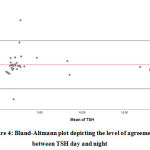 |
Figure 4: Bland-Altmann plot depicting the level of agreement between TSH day and night |
Bland-Altman analysis showed the average difference between night day values of TSH was 0.47 mIU/mL with a 95% confidence interval of -1.030 to 1.984. There was also a high risk of proportion bias (P value<0.001). (Figure 4)
Discussion
The diurnal rhythmicity of TSH is demonstrated with peaks from 8 PM to 2 AM and a nadir from 7 AM to 2 PM. Superimposed on the diurnal rhythm, multiple short lived fluctuations are observed (22).
All these studies point out the importance of establishing age specific reference interval for thyroid (23). The age group of participants in our study was 35.03 ± 13.01 years, the minimum age was 18 years and maximum was 60 years. There were 36.67% males and 63.3% female participants.
The mean FT3 values in day are 2.43±0.56 pg/mL with minimum 1.24 and maximum 3.95 with 95% CI. The mean FT4 values in day are 1.14±0.44 ng/dL with minimum 0.46 and maximum 2.14 with 95% CI. The mean TSH in day was 2.74±3.16 µIU/mL, minimum was 0.98 and maximum 8.57. The mean night FT3 is 2.66±0.55 pg/mL with minimum 1.62 and maximum 4.01. The mean FT4 in night was 1.3±0.61 ng/dL, minimum 0.63 and maximum 2.8. The mean night TSH was 3.21±3.18 µIU/mL, minimum 1.62 and maximum 8.58. The interclass correlation of FT3 is 0.0863, FT4 is 0.858 and TSH is 0.971 with p value < 0.001.
Liyanage YSH in his study has observed that paired t test between Log TSH am – log TSH pm is 2.616 with p value 0.013. paired t test between log FT4 am – log FT4 pm is 4.118 with p value 0.000 (24). In our study the one sample t test showed a difference of FT3 with t 4.489 (p value 0.000), the difference of FT4 with t value 3.092 (p value 0.004). The difference of TSH with t value 3.394 (p value 0.002).
Liyanage YSH in his study has observed a statistically significant difference between morning and afternoon samples for TSH, p=0.013 and FT4 p<0.001 (24). In our study the p value for morning and afternoon samples of FT3, FT4, TSH were 0.000, 0.004 and 0.002 respectively.
Sviridonova A.M et al in his study stated that the morning median TSH value in patients with subclinical hypothyroidism was 5.83 µIU/mL, in afternoon it was 3.79 µIU/mL (25). In our study the day TSH median value is 1.76 µIU/mL, in night it was 3.30 µIU/mL.
Thus in our study, the difference between day and night samples of FT3, FT4 and TSH were 0.23 pg/mL,0.16 ng/dL and 0.47 µIU/mL with p value < 0.001. This shows statistical significance.
Conclusion
In our study 36.67% (n=11) participants were males. 63.3% (n=19) participants were females. The mean FT3 in day was 2.43±0.56 pg/mL, FT4 in day was 1.14±0.44 ng/dL and TSH in day was 2.74±3.16 µIU/mL. The mean night FT3 was 2.66±0.55 pg/mL, night FT4 was 1.3±0.61 ng/dL and night TSH was 3.21±3.18 µIU/mL. The one sample t test shows difference of FT3 with t 4.489 and p value 0.000, FT4 with t value 3.092 and p value 0.004 and TSH with t value 3.394 and p value 0.002. Interpretation of TSH levels does also rely on the time of sampling. However fluctuations in diurnal variations in thyroid hormone levels are less. In our study although statistically significant, all the values are within the normal biological reference interval implying that diurnal variation in Thyroid function test has no relevance in routine testing. Further studies in larger cohort are essential to desire important conclusions.
Conflict of Interest
There is no conflict of interest.
References
- M, Alauddin .M, Islam.M.S, Mannan.A, Bhuiya.R.H, Nasrin.F. Determination of free Thyroxine (FT4) Levels in Different Thyroidal Conditions of the Patients of Chittagong City, International Journal of Contemporary Research and Review, Vol. 2 Issue 9[2011] 1-7.
- Schussler GC. The thyroxine-binding proteins. Thyroid. 2000; 10:141–149. [PubMed: 10718550].
CrossRef - J, Gundersen.H.J.G. Circadian and 30 minutes variations in serum TSH and thyroid hormones in normal subjects. Articlein Acta endocrinologica 89(4):659-72 · January 1979. DOI: Reads 10.1530/acta.0.0890659.
CrossRef - National Academy of Clinical Biochemistry. Laboratory support for the diagnosis and monitoring of thyroid disease. Washington, DC: AACC Press, 2003.
- W, Harrison R.F, Smith.N, Darzy.K, Shalet.S, Weetman A.P, and Ross R.J: Free Triiodothyronine Has a Distinct Circadian Rhythm That Is Delayed but Parallels Thyrotropin Levels. J Clin Endocrinol Metab. June 2008, 93(6):2300–2306.
CrossRef - Ambika G.U, Usha.V.M. Thyroid disorders in India: An epidemiological perspective. Indian J.Endocrinol Metab.2011 Jul;15(Suppl2):S78-S81 doi:10.4103/2230-8210.83329.
CrossRef - Fatourechi V. Subclinical hypothyroidism: an update for primary care physicians. Mayo Clin Proc. 2009; 84:65–71. [PubMed: 19121255].
CrossRef - Rhee CM, Brent GA, Kovesdy CP, Soldin OP, Nguyen D, Budoff MJ, Brunelli SM, Kalantar-Zadeh K. Thyroid functional disease: an under-recognized cardiovascular risk factor in kidney disease patients. Nephrol Dial Transplant. 2015; 30:724–737. [PubMed: 24574542].
CrossRef - Lervasi G, Clerico A, Bonini R, Manfredi C, Berti S, Ravani M, Palmieri C, Carpi A, Biagini A, Chopra IJ. Acute effects of amiodarone administration on thyroid function in patients with cardiac arrhythmia. J Clin Endocrinol Metab. 1997; 82:275–280. [PubMed: 8989273].
CrossRef - Ekins R. The free hormone hypothesis and measurement of free hormones. Clin Chem. 1992; 38:1289–1293. [PubMed: 1307685].
CrossRef - Abdalla SM, Bianco AC. Defending plasma T3 is a biological priority. Clin Endocrinol (Oxf). 2014; 81:633–641. [PubMed: 25040645].
CrossRef - Van Deventer HE, Soldin SJ. The expanding role of tandem mass spectrometry in optimizing diagnosis and treatment of thyroid disease. Adv Clin Chem. 2013; 61:127–152. [PubMed: 24015601].
CrossRef - K.J, Soldin.S.J. How reliable are free thyroid and total T3 hormone Assays? Eur J Endocrinol. 2016 December ; 175(6): R255–R263. doi:10.1530/EJE-16-0193.
CrossRef - K, Poonguzhali.G, Shanthi.K.M, Divya.M. Analytical sensitivity of TSH assays by ELISA and ELFA, National Journal of Basic Medical Sciences | Volume 6 | Issue 4 | 2016.
- D’Herbomez M, Forzy G, Gasser F, Massart C, Beaudonnet A, Sapin R. Clinical evaluation of nine free thyroxine assays: persistent problems in particular populations. Clin Chem Lab Med. 2003; 41:942–947. [PubMed: 12940522].
CrossRef - Monneret D, Guergour D, Vergnaud S, Laporte F, Faure P, Gauchez AS. Evaluation of LOCI technology-based thyroid blood tests on the Dimension Vista analyzer. Clin Biochem. 2013; 46:1290–1297. [PubMed: 23195135].
CrossRef - Roberts RF, La’ulu SL, Roberts WL. Performance characteristics of seven automated thyroxine and T-uptake methods. Clin Chim Acta. 2007; 377:248–255. [PubMed: 17126310].
CrossRef - Sapin R, d’Herbomez M. Free thyroxine measured by equilibrium dialysis and nine immunoassays in sera with various serum thyroxine-binding capacities. Clin Chem. 2003; 49:1531–1535. [PubMed: 12928239].
CrossRef - Zucchelli GC, Pilo A, Chiesa MR, Masini S. Systematic differences between commercial immunoassays for free thyroxine and free triiodothyronine in an external quality assessment program. Clin Chem. 1994; 40:1956–1961. [PubMed: 7923779].
CrossRef - AVANTOR , BenesphereTM Microwell ELISA.
- IBM Corp. Released 2013. IBM SPSS Statistics for Windows, Version 22.0. Armonk, NY: IBM Corp.
- C, Hehrmann.R, Mayerbasch. K, Mühlen.A. Studies on circadian variations of plasma TSH, thyroxine and triiodothyronine in man Articlein Acta endocrinologica86(1):81-8 · October 1977with51 DOI: Reads 10.1530/acta.0.0860081.
CrossRef - Kahapola-Arachchige KM, Hadlow N, Wardrop R, Lim EM, Walsh JP. Age-specific TSH reference ranges have minimal impact on the diagnosis of thyroid dysfunction. Clin Endocrinol (Oxf). 2012;77(5):773-779.
CrossRef - YSH , Siriwardhana. ID, Dissanayake.M , Dayanath.BKPT. Study on diurnal variation in TSH and freeT4 levels of healthy adults. Srilanka journal of diabetes, endocrinology and metabolism 2018/vol 8/issue 01.
CrossRef - Sviridonova A.M, Valentine.V, Sych. Y.P, Melnichenko.G.A clinical significance of TSH circadian variability in patients with hypothyroidism, Endocr Res.2013; 38(1):24-31.doi:10.3109/07435800.2012.7.
CrossRef

