
Manuscript accepted on :14-Dec-2020
Published online on: 30-12-2020
Plagiarism Check: Yes
Reviewed by: Dr. Jes Rejoice
Second Review by: Dr. Ankur Singh Bist
Final Approval by: Dr. Fai Poon
Nicolas Padilla-Raygoza1* , Cuauhtémoc Sandoval Salazar2, Xóchitl Sofía Ramírez-Gómez3 , Efraín Navarro-Olivos4 , María de Jesus Gallardo-Luna4. Francisco J. Magos-Vazquez4 and Daniel Alberto Diaz-Martinez4
1Departmentl of Medicine, University of Celaya, Celaya México.
2Department of Nursing and Obstetrics, Division of Health Sciences and Engineering, Campus Celaya-Salvatierra, University of Guanajuato, Celaya, Mexico.
3Department of Clinical Nursing, Division of Health Sciences and Engineering, Campus Celaya-Salvatierra, University of Guanajuato, Celaya, Mexico.
4Institute of Public Health from Guanajuato State, Guanajuato, Mexico.
Corresponding Author E-mail: padillawarm@gmail.com
DOI : https://dx.doi.org/10.13005/bpj/2053
Abstract
Introduction.Mexico has high number of new cases of Coronavirus Infectious Disease-19 and high rates of diabetes, hypertension, obesity, smoking, that can increase the mortality. The aim was to analyze the evolution of the disease until June 30th, 2020; to know the Cause-SpecificMortality Rate by each state from Mexico and the effect of co-morbidities on mortality for Coronavirus Infectious Disease-19. Methods. An ecological study was designed with public data of National Epidemiological Surveillance System to compare the hospital infrastructure (beds) and Cause-Specific Mortality Rate in each state from Mexico and analyze the effect of co-morbidities in mortality by Coronavirus Infectious Disease.19. It was used t-Student test, Z for two proportions, P-values, and OR, CI95%, and logistic regression .Results. From 509,539 registries, 226,089 (44.37%) were confirmed cases and 27,769 deaths were reported (12.28%). The states with higher mortality were Morelos, Baja California, Chihuahua, Guerrero. There was a lineal relationship between number of beds and cause-specific mortality rate (P<,05). Diabetes, chronic obstructive pulmonary disease, immunosuppression, hypertension, cardiovascular disease, chronic kidney disease and obesity shown a stronger effect on mortality by coronavirus disease (OR higher than 2). Asthma shown a protective effect on mortality from coronavirus disease in Mexican population. Conclusion.The spread on coronavirus disease is active in Mexico. The comorbidities had a stronger effect on mortality of Coronavirus disease.
Keywords
COVID-19; Diabetes; Hypertension; Mortality; Obesity; Smoking; SARS-CoV-2
Download this article as:| Copy the following to cite this article: Raygoza N. P, Salazar C. S, Ramírez-Gómez X. S, Navarro-Olivos E, Gallardo-Luna M. D. J, Magos-Vazquez J. F, Diaz-Martinez D. A. Status of Novel Coronavirus Disease and Analysis of Mortality in Mexico, Until June 30th, 2020: An Ecological Study. Biomed Pharmacol J 2020;13(4). |
| Copy the following to cite this URL: Raygoza N. P, Salazar C. S, Ramírez-Gómez X. S, Navarro-Olivos E, Gallardo-Luna M. D. J, Magos-Vazquez J. F, Diaz-Martinez D. A. Status of Novel Coronavirus Disease and Analysis of Mortality in Mexico, Until June 30th, 2020: An Ecological Study. Biomed Pharmacol J 2020;13(4). Available from: https://bit.ly/2WSw6Bx |
Introduction
The World Health Organization (WHO) reported an outbreak of coronavirus disease (COVID-19) in Wuhan, China on December 31, 20191. Corona viruses belong to the Coronaviridae family in the Nidovirales order2. In nature, four corona virus subfamilies have been identified: alpha, beta, gamma, and delta. Alpha and beta corona viruses apparently develop in mammals, specifically bats; while gamma and delta have been found in pigs and poultry3. Corona represents crown-like spikes on the outer surface of the virus; thus, it was named as a coronavirus, which is small (65–125 nm in diameter) and contain a genome (RNA) that varies between 26 kb and 32 kb2.
The new corona virus Stress Acute Respiratory Syndrome (SARS-CoV-2) produces mild and moderate infections, called Corona virus Infectious Disease-19 (COVID-19) and pneumonia. The virus was identified and characterized by Zhu et al., and also, confirmed that SARS-CoV-2, uses the same cell entry receptor, Angiotensin-Converting Enzyme 2 (ACE2), as SARS-CoV, which is highly expressed in airway epithelial cells4. The permanence of the virus was longer in men and in those over 60 years of age; in feces from 17 to 31 days, in the respiratory tract from 13 to 29 days in plasma from 11 to 21 days5.
SARS-CoV-2 enters mucous membranes mainly nose and larynx and up to the lungs; the initial symptoms are fever and cough6, it passes into the circulation, causing viremia; it attacks target organs that express ACE2, such as the lungs, kidney, heart, and gastrointestinal tract7,8. It is speculated that B lymphocytes could decrease by affecting the production of antibodies9, and the inflammation factors, mainly Interleukin-6, increase contributing to the worsening of the disease, 7 – 14 days after the attack10 and the phase clinic is divided into three stages: viremia, acute and recovery phases; if the patient is older or has immuno compromise and is accompanied by other diseases such as diabetes, hypertension, the immune system does not control the virus in the acute phase and becomes a critical patient10.
Mexico suffers the presence of COVID-19 and the hospital infrastructure that Mexico has to confront the pandemic is very important; the Informatics, Geographics, and Statistics National Institute (INEGI)11, indicates that 82.2% of the Mexican population benefits from the public health system;the public sector includes social security institutions: Mexican Institute of Social Security (MISS), Institute of Security and Social Services of State Workers (ISSSSW), Petroleos Mexicanos (PEMEX), Secretary of National Defense (SEDENA), Secretary of the Navy (SEMAR) and others, such as private hospitals.
Thus, in the public institutions of Mexico, there are 100,292 critical care beds (census beds), in which observations, diagnoses, care, and treatments are made. There are also 42,293 non-census beds for provisional care, temporary care, and without generating hospital discharges. Of the census beds in the entire country, the states with the largest number of these are Mexico City 16,720, Mexico state 9,947, Jalisco 7,121, Veracruz 5,554, Nuevo León 4,784 and Puebla 4,859; while, the states with the least amount are the states of Nayarit 802, Colima 689, Tlaxcala 868, Baja California Sur 883, Campeche 890 and Aguascalientes 94612.
Therefore, for Mexico, there are 24,207 health units for primary care and hospitalization. For this, the SS recommendation for a general hospital is to have 85% of critical care beds in use and to leave 15% of the capacity in unused beds. Thus, to deal with the SARS-CoV2 pandemic, Mexico will need a greater number of beds for critical care; as well as non-census beds. Finally, it is important to mention that throughout the national territory, both public and private hospitals have an estimated 5,000 artificial respirators and at least 45,000 are needed to attend the pandemic12. This indicates that according to the infrastructure of each state it will be supported and according to this, the mortality rates are so different throughout the Mexican territory.
The aim was to analyze the Cause-Specific Mortality Rate (CSMR) for COVID-19, for each Mexican State and the effect of comorbidities on deaths by COVID-19.
Methods
An ecological analytical study is designed, using the open database of the National Epidemiological Surveillance System / General Directorate of Epidemiology (NESS / GDE) of the Secretary of Health in Mexico, on June 30, 202013. The protocol was approved by the Bioethics Committee of the Celaya-Salvatierra Campus of the University of Guanajuato, with an expedited review, since it would only work with records and not with human beings, and without collecting personal identification data, with the CBCCS- 05130042020 registry.
All records reported by the Ministry of Health of the government of Mexico were included.
The variables collected were: age and gender. With age, the age group was generated, from 0 to 5, 6 to 11, 12 to 19, 20 to 49, 50 to 64 and 65 to 120 years.
In addition, the date of start of clinical data and death were included if it occurred.
A confirmed case is a patient with clinical data, mainly fever, myoarthralgia, cough and dyspnea, who has had contact with a confirmed case or has traveled to a country affected by the pandemic and with positive Real Time-Polymerase Chain Reaction test (RT-PCR).
A discarded case is that patient with clinical data, mainly fever, myoarthralgia, cough and dyspnea, who has had contact with a confirmed case or has traveled to a country affected by the pandemic and with negative RT-PCR.
It was also included if they had been in the Intensive Care Unit, intubated, and / or had developed pneumonia. In the case of women, if they were pregnant. Co-morbidities included diabetes, Chronic Obstructive Pulmonary Disease (COPD), asthma, immunosuppression, hypertension, cardiovascular disease, obesity, chronic kidney disease, smoking. For the analysis of comorbidities, the records that did not have this information were eliminated.
Statistical Analysis
Descriptive statistics were used for all variables. t Student test and P value were calculated for the average age between confirmed and discarded cases; Z for two proportions of male gender between both groups of cases.A bar graph was used for the start date of clinical data and deaths, for confirmed cases. The CSMR was calculated for each state with the number of deaths from COVID-19 among the total number of confirmed cases.To check differences in male gender proportions between confirmed cases who died or not, Z and P value were calculated.To analyze the effect of conditions such as being in the ICU, having been intubated, developing pneumonia and co-morbidities on mortality, Odds Ratio (RM) and 95% Confidence Intervals (95% CI) were calculated. Logistic regression models were generated between co-morbidities and mortality, including age group and gender as potential confounders.In all cases the value of α = 0.05. Statistical analysis was performed on STATA 13.0 ® (Stata Corp., College Station, TX, USA).
Results
The registries included were 509,539, reported in the open database of the NESS / GDE13 of June 30, 2020. Of these, 226,089 (44.37%) were confirmed cases and 27,769 deaths were reported (12.28%).NESS/GDE [13].
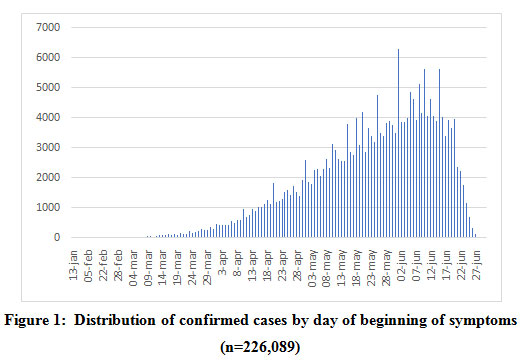 |
Figure 1: Distribution of confirmed cases by day of beginning of symptoms (n=226,089) |
Figure 1 shows the distribution of confirmed cases by day of symptom onset, and it is reported that June 1, 2020 was the day with the highest number of confirmed cases (6,305). Source:
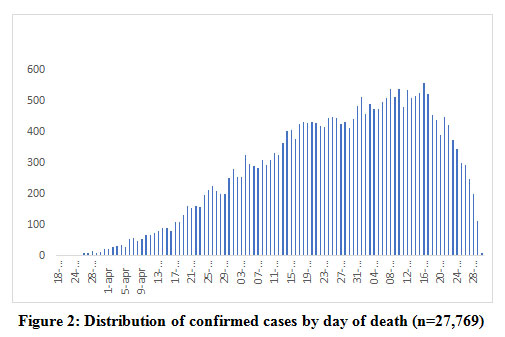 |
Figure 2: Distribution of confirmed cases by day of death (n=27,769). |
Figure 2 shows the distribution of confirmed cases by day of death. June 16, 2020 was reported to be the day with the most reported deaths (559).NESS/GDE [13].
Among the confirmed cases, men predominated (54.68%) vs 47.40% among those discarded; aged between 20 and 40 years (58.03%) among the confirmed and 66.85%, among the discarded; and 12.28% among those confirmed and 2.53% among those discarded died.
Table 1: Distribution of confirmed and discarded cases by gender, age and deaths (n=509,539)
| Confirmed cases
(n= 226,089) N % |
Discarded cases (n=283,450)
N % |
||
| Gender
Male Female |
123,616 54.68 102,473 45.32 |
134,359 47.40 149,091 52.60 |
Z=51.64 P=.00001 |
| Age (years)
Range Mean ± S |
0 to 120 45.65 ±16.32 |
0 to 120 40.06 ± 16.47 |
t=120.85 df 509537 P=.0001 |
| Age group (years)
0 – 5 6 – 11 12 – 19 20 – 49 50 – 64 65 – 120 |
1,533 0.68 1,358 0.60 4,149 1.84 131,199 58.03 57,111 25.26 30,739 13.60 |
6,669 2.34 4,382 1,55 9,499 3.35 189,498 66.85 51,405 18.14 22,037 7.77 |
Z= -46.87 P.00001 Z= – 31.90 P=.00001 Z= – 22.16 P=.00001 Z= – 74.66 P= .00001 Z= 61.67 P=.00001 Z=57.32 P=.00001 |
| Death
Yes No |
27,769 12.28 198,320 87.72 |
7,158 2.53 276,292 97.47 |
Z=136.83 P=.00001
|
Source: NESS/GDE [13]
Table 2 shows the distribution of confirmed cases, deaths and CSMR for all of Mexico and by states that make up the country. The highest CSMR was for the state of Morelos with 22.95%, and Baja California and Chihuahua, reported CSMR greater than 20%; the lowest, in Baja California Sur with 4.64%, also only Guanajuato and San Luis Potosí reported CSMR less than 5%.
Table 2: Distribution of cause-specific mortality rate by Mexican sates.
| State | Confirmed cases
n |
Deaths
n |
Cause-specificmortalityrate (%) | Numberofhospital beds [14] |
| AllMexico | 226,089 | 27,769 | 12.28 | 89,562 |
| Morelos | 2,898 | 665 | 22.95 | 1,047 |
| Baja California | 8,923 | 1,880 | 21.09 | 2,153 |
| Chihuahua | 3,062 | 641 | 20.93 | 2,915 |
| Guerrero | 5,313 | 891 | 16.46 | 2,075 |
| Hidalgo | 3,866 | 636 | 16.45 | 1,367 |
| StateofMexico | 34,253 | 5,486 | 16.02 | 8,356 |
| Quintana Roo | 3,619 | 577 | 15.94 | 1,030 |
| Sinaloa | 8,296 | 1,292 | 15.57 | 2,382 |
| Veracruz | 10,173 | 1,578 | 15.51 | 4,999 |
| Tlaxcala | 2,503 | 348 | 13.90 | 714 |
| Queretaro | 1,963 | 259 | 13.16 | 881 |
| Chiapas | 4,489 | 568 | 12.65 | 2,260 |
| Puebla | 10,530 | 1,246 | 11.83 | 4,012 |
| Colima | 551 | 64 | 11.62 | 649 |
| Nayarit | 1,723 | 200 | 11.61 | 714 |
| Mexico City | 48,014 | 5,417 | 11.28 | 15,632 |
| Oaxaca | 5,347 | 593 | 11.09 | 2,352 |
| Zacatecas | 908 | 98 | 10.79 | 999 |
| Jalisco | 6,684 | 685 | 10.25 | 6,460 |
| Sonora | 7,587 | 773 | 10.19 | 2,894 |
| Campeche | 1,916 | 191 | 9.97 | 790 |
| Tabasco | 10,673 | 1,035 | 9.70 | 1,583 |
| Yucatán | 4,394 | 408 | 9.29 | 1,800 |
| Michoacán | 5.665 | 460 | 8.12 | 2,648 |
| Durango | 1,899 | 144 | 7.58 | 1,542 |
| Aguascalientes | 2,340 | 140 | 5.98 | 966 |
| Tamaulipas | 5,918 | 346 | 5.85 | 2,977 |
| Nuevo Leon | 5,931 | 334 | 5.63 | 4,077 |
| Coahuila | 4,573 | 231 | 5.05 | 2,915 |
| San Luis Potosi | 3,113 | 153 | 4.91 | 2,021 |
| Guanajuato | 7,336 | 359 | 4.89 | 3,657 |
| Baja California Sur | 1,529 | 71 | 4.64 | 695 |
Source: NESS/GDE [13,14]
Figure 3 shows an excellent correlation between the number of hospital beds and the number of deaths from COVID-19 by the states of Mexico, and there is a strong linear relationship between the variables (P = .0001).
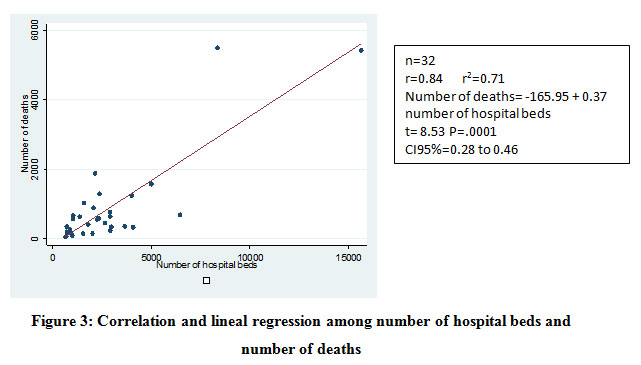 |
Figure 3: Correlation and lineal regression among number of hospital beds and number of deaths |
Among the confirmed patients who were women and of reproductive age, there were 101,775 women, of whom 1,471 were pregnant, and of them 35 (0.37%) died and of the 92, 318 non-pregnant women, 9,422 (1.56%) died (OR = 0.24 , CI95% 0.17 to 0.33 and age group acts as a confounder with adjusted OR of 0.74 CI95% 0.53 to 1.04 (LRT = 719.48, P .00001).
The table shows that among those who died from COVID-19, 12.34% required admission to the ICU compared to 6.49% of those who did not die and there is an effect of admission to the ICU on mortality and despite the age group and gender, have a confounding effect, the effect is still significant. Regarding the need for intubation of patients, 18.55% required it among the deceased compared to 4.75% among those who did not die, and a significant effect is also shown between the need for intubation and death. Regarding the development of pneumonia, it was reported in 76.24% of those who died against 16.48% of those who did not die. The effect of pneumonia on mortality is demonstrated with OR greater than 18, showing a strong effect of pathology on mortality.
For age group, significant differences were found between those who died from COVID-19 and those who were not deceased, and people aged 65 or older predominated among those who died. Regarding gender, men predominated among those who died from COVID-19 (Table 3).
Table 3: Distribution by some conditions and death by COVID-19 (n=226,089)
| Condición | Cases confirmed | Logisticregression | |||
| Deaths
(n=27,769) n % |
Non-deaths
(n=198,320) n % |
OR Crude
(CI95%) |
OR adjusted by age group
(CI95%) |
OR adjusted by gender
(CI95%) |
|
| UCI
Yes No |
3,060 12.34 21,744 87.66 |
2,901 6.49 41,797 93.51 |
2.03
(1.92 to 2.14) |
2.17
(2.05 to 2.29) |
2.01
(1.91 to 2.12) |
| Intubado
Yes No |
4,601 18.55 20,203 81.45 |
2,124 4.75 42,575 95.25 |
4,56
(4.32 to 4.82) |
4.75
(4.49 to 5.02) |
4.53
(4.29 to 4.78) |
| Neumonía
Yes No |
21,170 76.24 6,599 23.76 |
32,691 16.48 165,626 83.52 |
16.25
(15.77 to 16.75) |
11.07
(10.73 to 11.43) |
15.83
(15.36 to 16.31) |
| Variable | Z | P-value | |||
| Age group (years)
0 – 5 6 – 11 12 – 19 20 – 49 50 – 64 65 – 120 |
56 0.20 13 0.05 34 0.12 5,499 19.93 10,399 37.70 11,585 42.00 |
1,472 0.74 1,343 0.68 4,104 2.08 125,277 63.39 46,454 23.50 18,992 9.61 |
– 10.30 – 12.70 – 22.77 – 1002 51.02 147.53 |
.00001 .00001 .00001 ,00001 .00001 ,00001 |
|
| Gender
Male Female |
18,159 65.83 9,427 34.17 |
104,910 53.08 92,732 46.92 |
48.47 |
.00001 |
|
(Table 4) shows the number of records deleted due to the lack of information on these conditions.
Table 4: Distribution of registries eliminated by missing information.
| Co-morbidties | Deaths (n=27,769)
N % |
Non-deaths (n=197,640)
N % |
| Diabetes | 183 0.66 | 678 0.34 |
| COPD | 183 0.66 | 590 0.30 |
| Asthma | 152 0.55 | 604 0.30 |
| Immunosupression | 193 0.70 | 693 0.35 |
| Hypertensión | 176 0.63 | 632 0.32 |
| Cardiovascular disease | 202 0.73 | 630 0.32 |
| Obesity | 213 0.77 | 612 0.31 |
| Chronickidneydisease | 188 0.68 | 617 0.31 |
| Smoking | 192 0.69 | 680 0.34 |
Table 5 shows the distribution of co-morbidities and their effect on mortality from COVID-19, as well as the crude ORs adjusted for age group and gender. Virtually all comorbidities showed an effect on mortality from COVID-19 with ORs greater than 1, except in asthma, where a preventive effect of death was found. In all cases, age group and gender, they acted as confounders with the Significant Possibilities Ratio Test (P <.05).
Table 5: Distribution of co-morbidities by deaths and logistic regression.
| Co-morbidities | Cases confirmed (n=226,089) | Logisticregression | |||
| Deaths
n % |
Non-deaths
n % |
OR Crude
(CI95%) |
OR adjusted by age group
(CI95%) |
OR adjusted by gender
(CI95%) |
|
| Diabetes
Yes No |
10,242 37.13 17,344 62.87 |
26,768 13.54 170,874 86.46 |
3.77 (3.67 to 3.88) | 2.03 (1.97 to 2.09) | 3.80 (3.70 to 3.91) |
| COPD
Yes No |
1,367 4.96 26,219 95.04 |
2,565 1.30 195,165 98.70 |
3.97 (3.71 to 4.24) | 1.52 (1.41 to 1.63) | 4.06 (3.79 to 4.34) |
| Asthma
Yes No |
596 2.06 27,021 97.94 |
5,631 2.85 192,085 97.15 |
0.72 (0.66 to 0.78) | 0.84 (0.77 to 0.92) | 0.78 (0.71 to 0.85) |
| Immunosupresion
Yes No |
796 2.89 26,780 97.11) |
2,288 1.16 195,339 98.84 |
2.54 (2.34 to 2.75) | 2.03 (1.85 to 2.24) | 2.64 (2.43 to 2.86) |
| Hypertension
Yes No |
11,693 42.38 15,90057.62 |
33,596 16.99 164,092 83.01 |
3.59
(3.50 to 3.69) |
1.69
(1.64 to 1.74) |
3.65
(3.56 to 3.75) |
| Cardiovascular disease
Yes No |
1,490 5.41 26,077 94.59 |
3,776 1.91 193,914 98.09 |
2.93
(2.76 to 3.12) |
1.37
(1.29 to 1.47) |
2.93
(2.75 to 3.12) |
| Obesity
Yes No |
6,928 25.14 20,62874.86 |
37,21918.83 160,489 81.17 |
1.45
(1.41 to 1.49) |
1.49
(1.44 to 1.54) |
1.48
(1.43 to 1.52) |
| Chronic kidney disease
Yes No |
1,872 6.79 25,709 93.21 |
3,036 1.54 194,667 80.46 |
4.67 (4.40 to 4.95) | 3.15 (2.95 to 3.37) | 4.65 (4.38 to 4.94) |
| Smoking
Yes No |
2,423 8.79 25,154 91.21 |
15,072 7.63 182,568 92.37 |
1.17 (1.12 to 1.22) | 1.16 (1.11 to 1.22) | 1.06 (1.02 to 1.11) |
Discusion
The records used is the report of the states of Mexico to the federal health authority. Being a public database of the Ministry of Health, the quality of the data depends on who has collected the information.
The curve of confirmed cases is increasing and has not been flattened as expected in May 2020. The Mexican government launched the campaign of social isolation and closure of public places and closure of educational institutions at all levels to mitigate the spread of SARS -CoV-2, since March 2020, but many people have not respected quarantine or social isolation, which favors the spread of the virus.
Another important factor is the fact that the system implemented for the detection of cases is only with symptomatic cases, those that undergo the RT-PCR test. And asymptomatic carriers remain undetected and are a risk factor for the spread of infection.
Another factor in continuing to increase the number of cases is the reluctance of many people to use face masks, as recommended by the WHO, which represents a potential increase in the risk of transmitting the infection15.
The specific mortality rate of 12.28%, as of June 30, 2020 in Mexico (Table 2), is much higher than the global CSMR of 4.9%, to that of Africa with 2.0%, in America of 4.8%, Eastern Mediterranean of 2.3 %, Europe 7.3%, South-East Asia 2.8% and Western Pacific 3.5%, as reported by WHO for June 30, 202016.
These results are mainly due to differences in the availability of tests, that the infected go to the primary health care centers in a timely manner and to the hospital and general health infrastructure of the countries.
The lineal regression shows that to more hospital beds,more number of deaths in the Mexican states (Figure 3). This is because many hospitals are from reference to patients from Primary Health Care Units.
In Mexico, of those who died, they shown an aggravation of their condition, requiring admission to the Intensive Care Unit in 12.34%, while those who did not die only entered the ICU in 6.49% (Table 3). And of those who died, 18.55% required intubation, while only 4.75% of those who did not die required it (Table 3).
By age group, those who died, 42% were 65 years or older (Table 3), which confirms what has been reported in the literature, that the older, the greater risk of dying from COVID-19, where 60 years of age or older and with comorbidities represent severe cases that may present coinfections and risk to death17,
There is report that mortality rates are higher in men than in women, as indicated by the Italian Institute of Health, where of 23,188 deaths, approximately 70% of these were men, as well as in China and South Korea18.
In the United States, the National Center for Health Statistics, until June 26th, 2020 reports that patients with comorbidities of all ages are 49,770; stratifying each comorbidity and reporting a specific mortality of 14.97% in people with diabetes, 8.26% for kidney failure, 41.67% for pneumonia, 36.24% for cardiovascular disease, 8.29% for COPD, 2.80% for obesity and 21.37% for hypertension19.In Mexico, among the confirmed cases of COVID.19, diabetes mortality was 37.13%; 42.38% among those with hypertension, 76.24% in those with pneumonia, 25.14% in those with obesity, 8.79% among smokers, 5.41% among those with cardiovascular disease, 6.39% among those who reported chronic kidney disease, 4.96% among those with COPD,2.89% among those with some type of immuno suppression and 2.06% among those with asthma (Table 5). In general, the specific death rate from co-morbidities was higher than that reported in the USA.
The preventive effect on mortality from COVID-10 of asthma in the Mexican population should be noted, since asthma is mentioned by the CDC as a risk factor for dying from COVID-1919.
Given the spread of the SARS-CoV-2 infection causing COVID-19, it is imperative that the population implement protective measures: healthy distance between people 1.5 to 2 m, frequent hand washing, leaving the house only for something essential, use of face masks. And in the workplace implement similar measures.
As there is no vaccine available, we must reinforce all the measures already described in homes and in the workplace.
Conclusion
The spread of COVID-19 in Mexico continues to occur with more confirmed cases.
Mortality increases and many high-frequency diseases in Mexico, such as diabetes, hypertension, COPD, obesity, smoking, among others, are a risk factor for dying from COVID-19.
Asthma seems to act as a preventive factor for COVID-19 mortality in the Mexican population.
References
- World Health Organization. Coronavirus disease (COVID-19) Situation Report – 140. 2020. Accesed June 13, 2020. Available in:https://www.who.int/docs/default-source/coronaviruse/situation-reports/20200608-covid-19-sitrep-140.pdf?sfvrsn=2f310900_2
- Shereen MA, Khan S, Kazmi A, Bashir N, Siddiquea R. COVID-19 infection: Origin, transmission, and characteristics of human coronaviruses. J Adv Res. 2020; 24: 91–98. Doi:https://doi.org/10.1016/j.jare.2020.03.005
CrossRef - VelavanTP, Meyer CG. The COVID‐19 epidemic. Tropical Medicine and International Health. 2020; 25(3):278-280. Doi:https://doi.org/10.1111/tmi.13383
CrossRef - Zhu N, Zhang D, Wang W, Li X, Yang B, Song J, et al A novel coronavirus from patients with pneumonia in China, 2019 [published online ahead of print January 24, 2020]. N Engl J Med.https://doi.org/10.1056/NEJMoa2001017
CrossRef - Zheng S, Fan J, Yu F, Feng B, Lou B, Zou Q, et al Viral load dynamics and disease severity in patients infected with SARS-CoV-2 in Zhejiang province, China, January-March 2020: retrospective cohort study. BMJ 2020; 369:m1443 doi: https://doi.org/10.1136/bmj.m1443
CrossRef - Guan WJ, Ni ZY, Hu Y, Liang W, Ou C, He J et al Clinical characteristics of 2019 novel coronavirus infection in China. N Engl J Med. 2020; 382: 1708-1720. Doi: https://doi.org/10.1056/NEJMoa2002032
CrossRef - Harmer D, Gilbert M, Borman R, Clark KL. Quantitative mRNA Expression Profiling of ACE 2, a Novel Homologue of Angiotensin Converting Enzyme. FEBS Lett. 2002; 532(1-2): 107-110.Doi:https://doi.org/10.1016/s0014-5793(02)03640-2
CrossRef - Letko M, Marzi A, Munster V. Functional assessment of cell entry and receptor usage for SARS-CoV-2 and other lineage B betacoronaviruses. Nat Microbiol. 2020; 5: 562-569 Doi:https://doi.org/10.1038/s41564-020-0688-y
CrossRef - Lin L, Lu L, Cao W, Li T. Hypothesis for potential pathogenesis of SARS-CoV-2 infection–a review of immune changes in patients with viral pneumonia. Emerg Microbes Infect. 2020; 9(1): 727–732. Doi:https://doi.org/10.1080/22221751.2020.1746199
CrossRef - Wan SX, Yi QJ, Fan SB, Lv J, Zhang X, Gui L, et al Characteristics of lymphocyte subsets and cytokines in peripheral blood of 123 hospitalized patients with 2019 novel coronavirus pneumonia (NCP). medRxiv. 2020; Doi: https://doi.org/10.1101/2020.02.10.20021832
CrossRef - Informatics, Geographics, and Statistics National Institute. Salud. 2020. Accessed July 4, 2020. Available in:https://www.inegi.org.mx/datos/
- Martínez E. The National Public Healthcare System in México Facing the SARS- COV2 Pandemic. INEFAM:MEX ® / INEFAM:LATAM ®. 2020. Available in: https://www.researchgate.net/publication/340754455_INEFAMMEX_R_INEFAMLATAM_R_The_National_Public_Healthcare_System_in_Mexico_Facing_the_SARS-_COV2_Pandemic
- Sistema de información de la Secretaría de Salud. Recursos físicos en salud. 2018. Available in:http://sinaiscap.salud.gob.mx:8080/DGIS/
- WHO. Recomendaciones sobre el uso de mascarillasen el contexto de la COVID-19. Recomendaciones provisionales. 5 de junio 2020. AccessedJuly 2, 2020, Available in: https://apps.who.int/ iris/bitstream/ handle/10665/332657/WHO-2019-nCov-IPC_Masks-2020.4-spa.pdf.
- WHO. Coronavirus disease (COVID-19). Situation Report – 162. 30 junio 2020. AccessedJuly 4, 2020.
Available in:https://www.who.int/docs/default-source/coronaviruse/20200630-covid-19-sitrep-162.pdf?sfvrsn=e00a5466_2 - Harapan H, Itoh N, Yufka A, Winardi W, Keam S, Te H, et al. Coronavirus disease 2019 (COVID-19): A literature review. Journal of Infection and Public Health. 2020;13(2020): 1-9. Doi:https://doi.org/10.1016/j.jiph.2020.03.019
CrossRef - Spagnolo PA, Manson JE, Joffe H. Sex and gender differences in health: What the COVID-19 pandemic can teach us. Annals of Internal Medicine. 2020. Doi:https://doi.org/10.7326/M20-1941
CrossRef - National Center for Health Statistics. Centers for Disease Control and Prevention. 2020. Available from: https://www.cdc.gov/nchs/nvss/vsrr/covid_weekly/#Comorbidities.

