
Manuscript accepted on :7-Dec-2020
Published online on: --
Plagiarism Check: Yes
Reviewed by: Dr. Asim Faraz
Second Review by: Dr. Manon Mani
Final Approval by: Dr Anton R Kiselev
Said Benlakhdar1*, Mohammed Rziza1 and Rachid Oulad Haj Thami2
1LRIT URAC 29, Faculty of Sciences, Mohammed V University in Rabat, Morocco.
2RIITM, ENSIAS, Mohammed V University in Rabat, Morocco.
Corresponding Author E-mail: said-benlakhdar@um5s.net.ma
DOI : https://dx.doi.org/10.13005/bpj/2041
Abstract
The texture analysis of medical images is a powerful calculation tool for the discrimination between pathological and healthy tissue in different organs in medical images. Our paper proposes a novel approach named, GGD-GMM, based on statistical modeling in wavelet domain to describe texture images. Firstly, we propose a robust algorithm based on the combination of the wavelet transform and Scale Invariant Feature Transform (SIFT). Secondly, we implement the aforementioned algorithm and fit the result by using the finite Gamma Mixture Model (GMM). The results, obtained for two benchmark datasets, show that our proposed algorithm has a good relevance as it provides higher classification accuracy compared to some other well known models. Moreover, it displays others advantages relied to Noise-resistant and rotation invariant. Our algorithm could be useful for the analysis of several medical issues.
Keywords
Classification; Gamma Mixture Model; Statistical image modeling; SIFT; Uniform Discrete Curvelet Transform
Download this article as:| Copy the following to cite this article: Benlakhdar S, Rziza M, Thami R. O. H. A Robust Model using SIFT and Gamma Mixture Model for Texture Images Classification: Perspectives for Medical Applications. Biomed Pharmacol J 2020;13(4). |
| Copy the following to cite this URL: Benlakhdar S, Rziza M, Thami R. O. H. A Robust Model using SIFT and Gamma Mixture Model for Texture Images Classification: Perspectives for Medical Applications. Biomed Pharmacol J 2020;13(4). Available from: https://bit.ly/3heperH |
Introduction
During the recent years, the texture analysis becomes a useful tool to discriminate between pathological and healthy tissue in different organs in medical images (see Julesz, 1983). In the texture analysis, the statistical tools such as classification techniques play a more and more important role in the analysis of the medical images. In fact, many medical issues, such as the distinction between normal and abnormal tissue, involve the use of automatic algorithm to classify and extract image attributes. The techniques of classification allow capturing morphological properties, properties related to color, texture of images, etc. For example, Sutton and Hall (1972) lead texture analysis of X-ray images by using the classification technique of pulmonary diseases. Chen et al. (1989) employ fractal texture analysis to classify ultrasound images of the liver. As for the diagnosis of bone diseases, particularly osteoporosis, some authors lead texture analysis on bone radiographs to discriminate between osteoporotic patients and controls (see Benhamou et al).
Most of earliest image processing analyses focus only on the magnitude of the wavelet describing the image (the real part of the complex representation). Nevertheless, several recent studies analyze, in addition to the magnitude of the wavelet, the phase that contains more information about the features of the image. Oppenheim and Lim. (1981) is considered as one of the earliest works that begins to include the phase in their analysis.
Various approaches are recently developed for the image processing analysis, particularly for analyzing the phase in the wavelet decomposition of the image (e.g. Sutton & Hall, 1972) such as the Generalized Gaussian Density (GGD) (see Chen et al, 1981; Oppenheim & Lim, 1981). The phase’s estimation and its fitting involve the use of the standard circular distributions, where wrapped Cauchy (WC) and Vonn are considered two most popular ones (see Mallat et al, 1998). Regarding the wrapped Cauchy distribution, it is more accurate while it is not good for relative phase pdfs with Gaussian shapes (e.g Moulin et al, 1999). In addition, the Vonn distribution fits well with behaviors of relative phases from various real images including texture images.
Most current research is based on the assumption that certain invariant characteristics are common to an entire class of objects. Most classification methods characterize objects by their global appearance, usually of the entire image. These methods are not robust to occlusion or variations such as rotation or scale.
Moreover, these methods are only applicable to rigid objects. Local invariant features have become very popular to give solution to the limitations of these methods in object detection, recognition and classification.
Scale Invariant Feature Transform (SIFT) is an algorithm that allows to abstract automatically the corner points with subpixel resolution. When a set of images seem to be similar, for example with regard to scale, orientation, etc., simple corner detectors are found to be useful (see vo et al, 2011). However, the later techniques become less preferment when the images look different regarding scales and/or orientation. In this situation, SIFT algorithm appear more performant for the image processing analysis. In fact, this algorithm well locates the points of the image in the spatial and frequency domains, and preserve a relative stability of the abstracted point’s features concerning the visual angle, noise, affine transformation and some other distinctive characteristics.
In this work, we demonstrate how SIFT algorithm provide better accuracy, when they are fitted by Gamma Mixture Model, at the image description level. We show also how this algorithm can describe the characteristics of a typical image through a small number of parameters. This allows to speed up the processing analysis of the studied image by the algorithm. Moreover, we examine the accuracy of the classification related to our approach and compare it to the accuracy of GGD-Vonn and GGD-WC presented in (see vo & Oriaintara, 2010; vo et al, 2011).
The remainder of the paper is organized as follows. Section 2 presents the theoretical background of our methodology. Section 3 presents and discusses the experimental results. Finally, Section 4 provides the conclusion and implications of our paper.
Computational Detail
Basic theory of SIFT algorithm, calculation of points of interest and descriptors
Developed by David Lowe in 2004, the scale-invariant feature transform (SIFT) is a method to transform an image into a set of feature vectors that are invariant by Usual geometrical transformations (rotation, homothety) (see Lowe, 2004). It is used for extracting distinctive invariant feature from images to serve reliable matching between different views of a scene or an object.
Two main steps are required to implementation of the Lowe method. Firstly, it is necessary to extract the characteristics of an object and to calculate its descriptors. In other words it is detects the characteristics that are most likely to represent this object, to define and to discriminate it by comparing it with others. Secondly, it is necessary to set up a matching procedure. This is the eventual goal of the method.
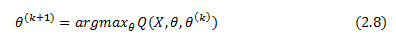
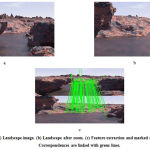 |
Figure 1: (a) Landscape image. (b) Landscape after zoom. (c) Feature extraction and marked matching results. Correspondences are linked with green lines. |
We will see the following main steps to transform an image into a set of descriptor vectors. Scale-space extrema detection: Using a Gaussian difference function, we start with a search on all scales and image locations to identify the potential points of interest that are invariant to scale and orientation. In oder words, we can be obtained the candidate keypoints by locate the extrma from Difference of Gaussian (DoG) pyramid.
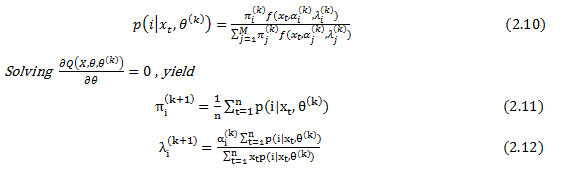
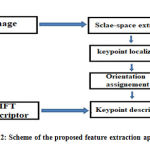 |
Figure 2: Scheme of the proposed feature extraction approach. |
Keypoint localization: In the interest to obtain stable keypoints; three processes are applied in this step: By using the 3rd order Taylor polynomial, the first process is done to find the accurate location of keypoints. The second process is focused on elimination the keypoints with low contrast. In the last process, the keypoints which are in the edge will be eliminated by using the principal curvature.
Orientation assignment: to each keypoint location, based on local image gradient directions, one or more orientations are assigned, see Fig 3.
![Figure 3: Construction of SIFT descriptor [9] (a) Image pyramid. (b) Extrema detection for DOG pyramid. (c) Creation of keypoint descriptor.](https://biomedpharmajournal.org/wp-content/uploads/2020/12/Vol13No4_Rob_Sai_fig3-150x150.jpg) |
Figure 3: Construction of SIFT descriptor [9] (a) Image pyramid. (b) Extrema detection for DOG pyramid. (c) Creation of keypoint descriptor. |
The orientation assignment to points of interest: The calculation of the orientation histograms according to the neighborhood is used to justify the invariance of the descriptors with respect to the rotation.
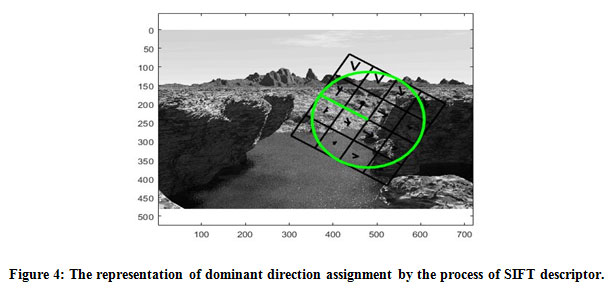 |
Figure 4: The representation of dominant direction assignment by the process of SIFT descriptor. |
Calculation of the descriptors: The Generation of the descriptor vectors associated with each point of interest requires the calculation of the Keypoint descriptor at each point in the window, orientation and gradient magnitude. For each sub region based on gradient magnitude an orientation histogram which represents eight cardinal directions are calculated.
Four sample sub-images, the Bark, Bubbles, Wood and lathear are from Brodatz databases as in Fig. 5.
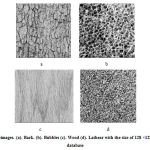 |
Figure 5: Four subimages. (a). Bark. (b). Bubbles (c). Wood (d). Lathear with the size of 128 ×128 from the Brodatz database. |
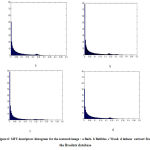 |
Figure 6: SIFT descriptors histogram for the textured image : (a) Bark. (b) Bubbles. (c) Wood. (d) lathear extract from the Brodatz database. |
Figure 6 shows the histogram of Invariant scale feature transform descriptors ( SIFT) offor four different images extract from the Brodatz database. As can be seen, this distribution has a particular shape, and can be interpreted through a statistical model. Since this distribution exhibits a mixture Gamma distribution and used to describe SIFT descriptor features.
Gamma Model
The gamma distribution is a continuous distribution whose support is the set of strictly positive reels. With the classical parameterization, this distribution denoted (α ,β ) admits for measurement,
Note that this law is sometimes parameterized not by the parameter, but according to its inverse. In this paper, the classical parameterization will always correspond to the parameterization by the pair introduced in equation (1.1) above. When the parameter β is a parametric set, the families are a natural exponential family.
Gamma Mixture Model
In this section a probabilistic formalization is proposed to resolve the problem based on a special case of mixed model.
Let Χ = { Xj }, j = 1,……, be a set of samples, the density function for the finite mixture gamma distributions takes the following form
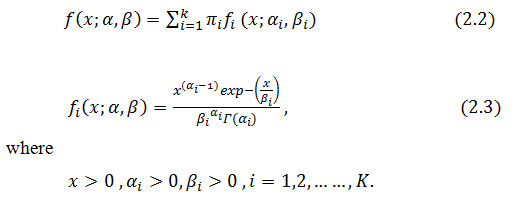
Here, k denotes the number of components in the mixture. π1 , π2, ………..,πK are the proportions that satisfy the conditions
![]()
denote the shape of the i-th component of the mixture distribution and β1 their scale parameters. Where r (ai) is the Euler gamma function defined as
![]()
The EM (Expectation-Maximization) Algorithm will allow us to find the parameters of this mixture Gamma distribution, starting from random values and adjusting them progressively until the likelihood of this model is maximum.
EM Algorithm
The algorithm Expectation-Maximization (EM) is a general method for finding the estimated maximum likelihood of a given set of parameters of a distribution from a sample. Using the general representation of log-likelihood function given in McLachlan and Peel, the finite mixture gamma model is given as follows
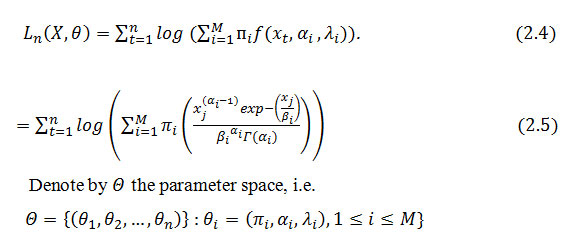
The EM algorithm is used to estimate the gamma mixture parameters in the following manner. Let St , t ≥ 1 be a sequence of i.i.d random variables with distribution P( St = i) = πi . We can associate( X1, X2,….., Xn) with ( S1, S2,….., Sn) as follows: Conditioned on St = i , xt has gamma distribution with parameters ( ai , λi ) We call ( X1, r1 , X2,……. Xn, Sn) the augmented data, its likelihood is given by
![]()
Insted of finding the optimal likelihood estimate, the EM algorithm optimizes the conditional logarithmic likelihood
![]()
That is
The computation gives
![]()
where
Next, we proceed to update α. Note that
has no closed-form expression, we do not have the optimal updating scheme for α aviable. So, we can update ai in its gradient direction

Where is a step size that will be specified later and
Uniform Discrete Curvelet Transform
For many applications in image communication such as coding (see Vo & Oraintara, 2010), quality measures (e.g Nguyen & Chauris, 2008) image retrieval, denoising (see Mikolajczyk & Schmid, 2005; Luo et al, 2007) and motion estimation (see Cover & Hart, 1967), the complex wavelet transform has main advantages compared with the discrete wavelet transform (DWT) as the good directional selectivity and the shift invariant property (e.g Meeker et al, 1998; Selesnick et al,2005 ).
The transform is named the uniform discrete curvelet transform (UDCT) (see Nguyen & Oraintara, 2008), this is due to the positioning on a uniform lattice at each resolution the centers of the curvelet functions. At each resolution, the UDCT basis functions are located on a uniform integer grid. The decomposition has four directional scales, with N= 6 at each scale. In general, the UDCT can have 3×2n directional subbands where . Compared with the existing transforms, the new discrete transform has several advantages, such as ease of implementation, hierarchical data structure and lower redundancy ratio. Therefore, the reader is referred to Nguyen and Chauris (2008) for more information of the detailed construction of the UDCT.
Wrapped Cauchy Distribution
The wrapped Cauchy is a unimodal and symmetric distribution, obtained from wrapping of the Cauchy distribution with density around the unit circle. The distribution (WC) closely resembles a Von Mises distribution for many values of (see Mardia & Jupp, 2000; Jammal amadaka & Sen Gupta, 2001) and it has the probability density function defined by .

where ρ = e ¯σ , -π ≤ ≤ π is the location parameter and Ο ≤ P ≤ 1 is the scale parameter. When, ρ → Ο, the wrapped Cauchy distribution tends towards the uniform distribution.
Vonn Distribution
Vonn distribution of relative phases at a spatial location (i,j) is defined as the difference of phase of two adjacent complex wavelet coefficients [11], e.g.,
![]()
Where z(i,j) is the coefficient at position (i,j). It is noted that to treat the circularity of the phases for complex coefficient z, Lz it is necessary to returns the angle of phase in radians. The angles lie between ±π.
The Vonn density distribution of relative phase θ is defined by

where c =λ cos (θ – μ + π) , -π ≤ θ, μ ≤ π and 0≤ λ ≤ 1.
The Vonn distribution is unimodal and is symmetrical about θ = μ ( is the mean direction and λ is the correlation parameter). The Vonn distribution parameters can be estimate by using the maximum-likelihood estimator (ML).
Let θ1 ,θ2 ,……,θn be a set of observations from a Vonn distribution and (μ , λ ) are the two parameters, with θ1 ,θ2 ,……,θn are i.i.d .This likelihood function is given by
![]()
Where μ and λ are parameters to be estimated as follows
![]()
Differentiating log (L) and equating to zero, we obtain the likelihood equations
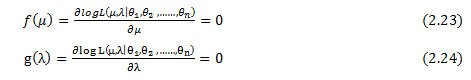
we can be solved numerically These equations to find the parameters μ and λ . nevertheless, μ can be also estimed by the mean direction
To oversimplify the estimation problem, we propound to estimate μ using mean direction and the Newton Raphson iterative method to find solution of the equation g( λ ) =0 with μ = û.
Substitute û into 19, the Newton iteration can be stated as.

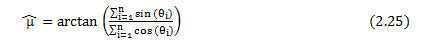
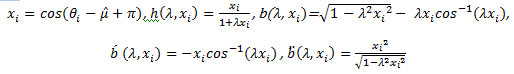
We derive g(λ ) and g( λ ) [ 22]. They are given by
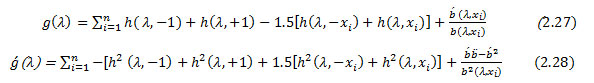
Where
We propose using the correlation coefficient as a good initial value for the root of g(λ) as follows :
With the initial value as in(27),our ML estimator converges with a few number of iterations.
The search scheme of our method and the state of art feature is summarized in Fig. 7.
 |
Figure 7: Scheme of the proposed feature extraction approach (extracted characteristic) |
Experimental Results and Discussion
To validate the performance of our proposed GGD-GMM method, we conduct the experiment on two set of texture images, the Brodatz and Vistex Database and we select 40 image textures from the Vistex databases used in (e.g Do & Vetterli, 2002a; Do & Vetterli, 2002 b) for our experiments. Each of these 512×512 images is divided into sixteen 128×128 non-overlapping sub-images, thus creating a database of 640 texture samples. To expand the Brodatz database, each image was divided into sixteen 128 × 128 non-overlapping sub-images, there by forming 1248 texture samples. For each image in the database, the UDCT curvelet transform is applied with four scales and six orientations angles per scale (0°, 30°, 60°, 90°, 120° and 150°). This database preserves a rich textural and possesses a wide variety content. Hence, it becomes relevant for the evaluation of texture based content-based image retrieval (CBIR) algorithms.
The experimental process began with testing how well Mixture Gamma model fit phase features derived from the SIFT transform. The dataset available through the Brodatz and Vistex Database was used for evaluation of accuracy and precision of the proposed approach. We compare our proposed Method with GGD-Vonn and GGD-WC feature using the UDCT curvelet transform.
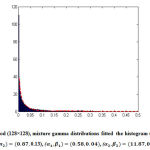 |
Figure 8: Wood (128×128), mixture gamma distributions fitted the histogram (using 256 bins)( π1 , π2)=(0.87, 0.13), α_1,β_1)=(0.58,0.04)(α_2,β_2)=(11.87,0.02) |
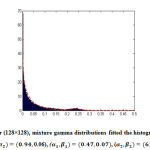 |
Figure 9: Lathear (128×128), mixture gamma distributions fitted the histogram (using 256 bins)( π1 , π2)=(0.94, 0.06), (α_1,β_1)=(0.47,0.07)( α_2,β_2)=(61.62,0.004). |
The Fig.8 and Fig.9 show the histograms of Invariant scale feature transform descriptors for two different images. The tested images are Wood and Lather. Clearly, the proposed mixture gamma model fit well the data. In addition, the estimated parameters are different for both images. This suggests the use of these parameters for discriminating the different database images.
The GGD parameters of the real coefficients in each subband will be estimated by Do and Vetterli (2002). A feature based on a real part model using the GGD as well as an imaginary part using the (WC) for fitted the relative phase model is named GGD-WC. For GGD-Vonn, the image is analyzed using the same decomposition, except that the finest scale is fitted here to the Vonn distribution. In this new approach, the standard vector is based on GGD and the Scale invariant feature transform fitted with Gamma mixture distribution that we will call GGD-GMM.
The goal of this study was twofold: first, to assess the ability of parametric models to provide interesting features texture analysis, secondly to select the most appropriate model to describe texture images.fig 10.
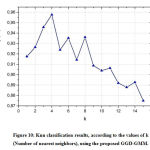 |
Figure 10: Knn classification results, according to the values of k(Number of nearest neighbors), using the proposed GGD-GMM. |
The Fig.10 shows that the best classification accuracy for the k-nearest neighbors classification algorithm is giving by the value k=4. We compare our approach with two well-known classifiers, i.e., KNN and SVM. One can see from Table 1 that the proposed approach GGD-GMM outperforms the state-of-the-art methods in both databases, Brodatz and Vistex. Besides, in the experiments, the proposed features GGD-GMM increase significantly the overall accuracy rate up to 96.03%. On the other hand GGD-WC and GGD-Vonn achieve respectively an accuracy rate of 88.07% and 91.15% for the SVM classification algorithm.
Table 1: Classification accuracy achieved with state of art feature and ours.
| SVM(Rate of Accurately) | KNN(Rate of Accurately) | |||
|
|
SVM-CrossVal
|
KNN-KFold |
||
| Bodatz database | Vistex database | Bodatz database | Vistex database | |
| GGD-WC | 88.07 | 85.64 | 87.12 | 85.03 |
| GGD-Vonn | 91.15 | 85.82 | 89.85 | 86.19 |
| GGD-GMM | 96.03 | 93.16 | 95.83 | 94.47 |
Conclusion and Implications
In this study, we introduced a SIFT algorithm fitted by the GMM (GGD-GMM) to describe the characteristics of texture image by only a small number of parameters. This allow to speed up the processing image analysis. By using Brodatz and Vistex dataset, our experiments showed that our algorithm provide more accurate classification results than GGD-Vonn and GGD-WC methods. In fact the accuracy rate of GGD-GMM
Our contribution concerns the establishment of a complete system of classification of images making it possible to classify in a satisfactory manner, in the light of medical experts, the images of healthy and pathological patients. These images being difficult to analyze, we above all sought to set up a generic approach so as not to be dependent on the content of the image. This system is based on local extraction and rich characterization of image information and a classification approach by one of the methods SVM, CNN.
References
- Cover, T., & Hart, P. (1967). Nearest neighbor pattern classification. IEEE Transactions on Information Theory 13(1), 21-27.
CrossRef - Chen, C.C., DaPonte, J.S., Fox, M.D.(1989). Fractal feature analysis and classification in medical imaging. Medical Imaging, IEEE Transactions on 8(1), 133-142.
CrossRef - Do, M.N., & Vetterli, M. (2002). Wavelet-based texture retrieval using generalized Gaussian density and Kullback–Leibler distance, IEEE Transactions on Image Processing 11 (2), 146–158.
CrossRef - Do, M.N., & Vetterli, M. (2002). Rotation invariant texture characterization and retrieval using steerable wavelet-domain hidden Markov models, IEEE Transactions on Multimedia 4 (4), 517–527.
CrossRef - Jammalamadaka, S., & SenGupta, A. (2001). Topics in Circular Statistics. World Scientific, Singapore.
CrossRef - Julesz,B., & Bergen, J.R.(1983). Textons, the Fundamental Elements in Preattentive Vision and Perception of Textures. Bell System Technical Journal 62(1), 1619-1645.
CrossRef - Krishnamoorthi, R. (2018). Score level based latent fingerprint enhancement and matching using SIFT feature. Multimed Tools Appl, 1–21.
- Lowe, D,. (2004). Distinctive image features form scale-invariant keypoints. International Journal of Computer Vision 60(2), 91-110.
CrossRef - Luo,J.,& Ma, Y., Takikawa, E., Lao, S., Kawade, M., Lu, B. (2007). Person-specific SIFT features for face recognition. in IEEE Conference on Acoustics, Speech and Signal Processing.
CrossRef - Mallat, S. (1998). A Wavelet tour of Signal Processing. Academic Press, San Diego.
CrossRef - Manickam, A., Devarasan, E., Manogaran, G., Priyan, M.K., Varatharajan, R., Hsu, CH., Moulin, P., Liu, J. (1999).Analysis of multiresolution image denoising schemes using generalized Gaussian and complexity priors. IEEE Transactions on Information Theory 45(3), 909–919.
CrossRef - Mardia, K.V., & Jupp, P.E. (2000). Directional Statistics, Wiley, New York.
CrossRef - Meeker, W.Q., & Escobar, L.A. (1998). Statistical Methods for Reliability Data,Wiley.
CrossRef - Nguyen, T.T., & Chauris, H.(2008). Uniform discrete curvelet transform for seismic processing. EAGE Conference and Exhibition (EAGE’08), 5495–5498.
CrossRef - Nguyen, T.T., & Oraintara.S. (2008). The shiftable complex directional pyramid Part 1: theoretical aspects. IEEE Transactions on Signal Processing 56 (10), 4651–4660.
CrossRef - Oppenheim, A.V., & Lim, J.S.(1981). The importance of phase in signals. Proceedings of the IEEE 69(1), 529–541.
CrossRef - Selesnick, I.W., Baraniuk, R.G., Kingsbury, N.C. (2005). The dual-tree complex wavelet transform. IEEE Signal Processing Magazine 22 (6), 123–151.
CrossRef - Sutton, R.N., & Hall, E.L.(1972).Texture Measures for Automatic Classification of Pulmonary Disease. Computers, IEEE Transactions on, vol.21(c), 667-676.
CrossRef - Vo, A., & Oriaintara, S. (2010). A study of relative phase in complex wavelet domain: property, statistics and applications in texture image retrieval and segmentation. Signal Processing Image Communication 25, 28-46.
CrossRef - Vo, A., & Oriaintara, S. (2011). Nguyen N, Vonn distribution of relative phase for statistical image modeling in complex wavelet domain. Signal Process 91(1), 114-125.
CrossRef

