
Manuscript accepted on :23-03-2020
Published online on: 20-07-2020
Plagiarism Check: Yes
Reviewed by: Georgekutty Kochuchakkalackal
Second Review by: Christos Tsagkaris
Final Approval by: Prof. Juei-Tang Cheng
Revati Shriram* and Nivedita Daimiwal
Cummins College of Engineering for Women, Pune, India
Corresponding Author E-mail : revatishriram@yahoo.com
DOI : https://dx.doi.org/10.13005/bpj/1987
Abstract
Background: Time frequency analysis is used to study the time varying properties of neurophysiological signals. When subject is reading, thinking or watching; various parts of brain gets stimulated. That creates electrical signals known as electroencephalogram. Based on frequency range there are five major brain waves such as alpha, delta, theta, beta and gamma. Objective: The purpose of the study was to explore the phase & magnitude synchrony, power spectral density, cross-correlation related changes during different cognitive activities in various frequency bands of EEG. Methods: The present study explored bivariate connectivity analysis of EEG signal. EEG was acquired for 7 healthy right handed multilingual subjects during the two cognitive activities such as analytical and syntax-morphology based activity. Linear and non-linear measures of synchronization were applied on the acquired data. Results: Changes in magnitude and phase coherence were noted in frontal, occipital and temporal lobe during the activity. Activity related changes were more prominent in alpha and theta frequency band and less prominent in beta, delta band. During the syntax-morphology increased gamma band activity was observed in coherence. Conclusion: It show the importance of connectivity analysis in the simultaneously acquired electrical brain signals. Such analysis can provide diagnostic value in various neuronal disorders.
Keywords
Connectivity Analysis; Electroencephalogram; Emotion Analysis; Magnitude Coherence; Phase Coherence.
Download this article as:| Copy the following to cite this article: Shriram R, Daimiwal N. Study of Electrical Brain Signal during Verbal Cognitive Assignment. Biomed Pharmacol J 2020;13(3). |
| Copy the following to cite this URL: Shriram R, Daimiwal N. Study of Electrical Brain Signal during Verbal Cognitive Assignment. Biomed Pharmacol J 2020;13(3). Available from: https://bit.ly/3eNGQaQ |
Introduction
How our brain is employed in performing various tasks is gaining a wide popularity. The main reasons behind it are: 1) the analysis can reveal how the multiple parts of our brain interact with each other and 2) to understand how our brain affects our behaviour and impacts our perception on the surrounding.1, 2 Such analysis is important in studies related to the brain dysfunction and personal mental health. The electrical currents generated by synchronously active neurons within the local region of brain are the part of neural dynamics.3, 4 The spectral contents or the frequency of the signal reveals important information and are used to evaluate functional state of the nervous system.5 Coherence analysis is widely applied in studying neuronal correlate in nervous system. In the recent years the study related to the correlation and synchronization between the various signals has shown increased interest. The time-frequency coherence analysis gives the result in both the domains; time and frequency. Synchronous activities in brain are studied with neuronal correlates, but mostly in a single frequency band; most of the time gamma.
Materials and Methods
Human brain has more developed cerebral cortex than any other animal. Cerebral cortex is divided into four lobes such as; frontal, parietal, occipital and temporal lobe. Functions of the various brain lobes are; parietal lobe: spatial cognition, language, hearing and attention. The functions of frontal lobe are: abstract thinking, behaviour, to control attention, physical reactions and problem solving tasks. Smallest lobe is the occipital lobe and its functions are: visual-spatial processing, colour recognition, movement and visual reception. The temporal lobe functions are: language, hearing and speech, audio and visual memories.1, 6, 7 Based on the functions of various brain lobes, the set of channels for cognitive and non-cognitive task were finalized. Figure 1 shows the set of electrodes used to capture EEG during different cognitive tasks.
Decomposition using Bior3.7 Wavelet
Purely for the mathematical reasons wavelet related methods are based on biorthogonality or orthogonality principles. This property imposes the restriction that decomposition yields a series of components in various frequency bands which are not correlated with each other.8 Bior3.7 is a biorthogonal wavelet used during the study for the six levels of decomposition of an EEG signal. Sampling frequency of EEG was 250 Hz.9, 10 Figure 1 shows the placement of EEG electrodes on left/right/frontal region of head.
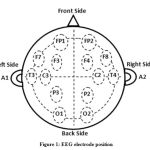 |
Figure 1: EEG electrode position |
Cross Covariance Analysis
It is the function which gives the covariance of one signal with the other at a given point. Covariance of two signals is the tendency to co-vary or move together. It is useful in identifying the lag of signal ‘x’ that might be useful in prediction of signal ‘y’. It is the most commonly used tool in the analysis of multiple time series. Cross covariance is given by:
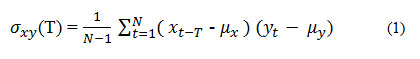
Where xt and yt are the two signals and xt is delayed by T samples. μx and μy are the means of two signals with N samples in each. Cross correlation is the normalized version of cross-covariance as follows:
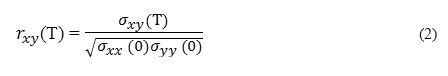
Where σxx (0) = σ2x and σyy (0) = σ2y are the variances of each signal. If larger value of signal ‘x’ are associated with the larger values of signal ‘y’ then covariance is positive. If larger values of ‘x’ are associated with smaller values of ‘y’ and vice a versa then covariance is negative.11
Cross Correlation Analysis
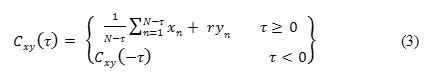
Linear cross-correlation is the most widely used and simplest measure of synchronization. Cross-correlation compares the two signals by shifting one of them relative to the other. It is the generalization of standard linear correlation analysis. In the time domain, it is given by the function of time lag τ :
τ = -(N-1),..,0,…(N-1)
Is derived from normalized signals Xn and Yn of length ‘N’ with zero mean and unit variance as:11
Correlation is sometimes used as coherence and is given by:
Square of correlation coefficient is like the coherence and to the coefficient of determination.12
Power Spectral Density (PSD)
PSD shows the strength of energy variations as a function of frequency. It is the Fourier transform of auto covariance function. The unit of PSD is the energy/frequency (width). It is the powerful tool to identify the oscillatory (non-stationary) signals in the time series.13 It provides the important information about the frequency range in which the power variations are strong; this information can be used for further analysis. PSD is given by the following equations.14
Cross Power Spectral Density (CPSD)
CPSD is the Fourier transform of cross-covariance function. When X = Y then CPSD reduces to the PSD. For real signals Y*(w) = Y(-w); where ‘*’ denotes the complex conjugate. Then CPSD is given by:
The cross covariance is asymmetric so CPSD is complex value. The auto-covariance is symmetric so PSD is real value.14,15,16
Coherence
Spatial analysis of EEG means the joint observation of time series of data channels. Coherence is a linear correlation coefficient that gives the phase synchronization between the data channels. Coherence depends on two parameters: relative phase at each frequency between the two channels and the relative amplitude of the two signals.18,19,20
Magnitude Coherence Function
Where Pxx and Pyy are power spectra of signals ‘x’ and ‘y’. Pxy is the cross-power spectra of signals ‘x’ and ‘y’.
Where x ̅ and y ̅ are the complex conjugates of ‘x’ and ‘y’. 21, 22
Phase Coherence Function
Phase coherence is denoted by Ø(w) and is given by:
The degree of synchronization between the EEG signals is characterized by magnitude and phase coherence. Another method is to find the wavelet coherence. It gives the information not only about the frequencies but the time at which they appeared.21,22
Zscore

Zscore is computed using mean and stand deviation of a signal. Where ‘X’ is the signal, ‘μ’ is the mean and ‘σ’ is the standard deviation. In this paper authors have computed zscore for various EEG sub-bands between channels F4-C4 and FP2-F8 during mathematical problem solving task and sub-bands of channels T3-T5 and O2-T6 during personal interview task.
Subjects and Data Acquisition Procedure
EEG data was simultaneously recorded for 6 minutes for seven healthy volunteer subjects (3 males and 4 females, aged from 19 to 41 years). All the subjects were multilingual (languages spoken/read/written by the subjects are – English, Hindi & Marathi). None of the subject had English as a first language. Subjects were in the seated position. Data acquisition was carried-out by using a NeuroWin EEG machine with the sampling frequency of 250Hz. During data acquisition EEG electrodes were placed according to standard 10-20 placement in the bipolar configuration F3-C3, FP1-F7, F4-C4, P3-O1, F7-T3, T3-T5, O2-T6 and T5-O1. Cognitive task planned by the authors was based on mathematical problem solving (Analytical) and personal interview (Syntax-Morphology). Mathematical problems with medium level of difficulty based on four commonly used mathematical functions (addition, subtraction, multiplication and division) were solved by all the subjects. In the second cognitive task; subject specific general questions were asked (personal interview). Such as age, highest qualification, city in which subject is living etc. All these questions were in English language and displayed on the computer screen with a white background and font size of 18 and type is Times New Roman. Time between the two questions was 30 sec. Subject was expected to read questions silently (without moving any articulate muscle) and was expected to answer the question silently as well. EEG was captured continuously for 6 minutes/subject for total seven right handed subjects during performance of two cognitive tasks.
Results
Results related to the sub-band decomposition of EEG signal, PSD estimation, cross-correlation, cross-covariance, magnitude squared coherence, phase coherence are shown in the 1st section. 2nd Section of the results cover the time series plot and zscore plot of various EEG sub-bands during both the cognitive activities. It also includes the magnitude and phase plot of the analytic signal for various EEG sub-bands during the two activities. Figure 2 shows the decomposed EEG signal into its sub-bands and PSD estimation and coherence between the two EEG channels. Figure 4 shows the phase coherence for EEG and sub-bands. While figure 5 shows the zscore plot for various sub-bands. Figure 6 shows the magnitude and phase plot of analytic signal.
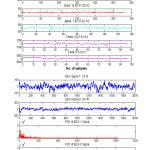 |
Figure 2: EEG sub-band decomposition using bior3.7 wavelet, PSD and coherence between the two channels |
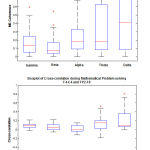 |
Figure 3: Statistical plot for MS coherence and Cross-correlation during cognitive activities. |
Figure 3 shows the Figure 3 shows the statistical plot of MS coherence and cross correlation during both the cognitive activities in various EEG bands such as Gamma, Beta, Alpha, Theta and Delta. It can be seen that the MS Coherence and Cross Correlation in Delta and Theta band is bit higher than that of the other EEG bands.
In Figure 4, Green plot shows the phase coherence between channels F4-C4 & FP2-F8 during mathematical problem solving assignment. Blue line shows the phase coherence between the channels T3-T5 & O2-T6 during personal interview assignment. X-axis shows the no. of samples and Y axis shows the phase coherence in degrees.
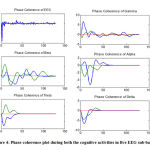 |
Figure 4: Phase coherence plot during both the cognitive activities in five EEG sub-bands. |
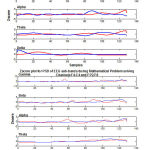 |
Figure 5: Plot (1) Zscore plot for EEG sub-bands between the channel F4-C4 and FP2-F8 during mathematical problem solving |
Figure 5 shows the Z score in EEG sub-bands such as Gamma, Beta, Alpha, Theta and Delta. It can be seen that the Z Score is bit higher in Gamma band as compared to other EEG bands during Mathematical Problem solving. Whereas almost same value of Z Score was observed in all the EEG sub-bands during Personal Interview.
Bivariate analysis is carried out by the authors to study the various connectivity measures. Channels studied during the mathematical problem solving task are F4-C4 and FP2-F8, and while personal interview task T3-T5 and O2-T6 channels are used for the analysis purpose. It was observed that in most of measures; both the cognitive activities showed more prominent changes in alpha and theta band of frequencies. Whereas such changes are less prominent in beta and delta band. Coherence related changes were almost negligible in gamma and delta band. Cross-correlation based changes were prominent in theta band. Overall cross-covariance during mathematical problem solving task is higher as compared to personal interview task; sub-band related comparison is not significant. It can be seen from the phase coherence plot that the nature of the phase coherence plot for the mathematical problem solving task and personal interview are exactly opposite in alpha and theta band. Phase coherence in the gamma band is higher during the personal interview, while changes in the beta and delta band are less prominent during both the activities.
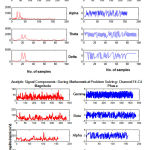 |
Figure 6: Magnitude and phase plot of analytic signal of channel T3-T5 and F4-C4 |
Table 1: Statistical analysis of EEG sub-bands for various parameters (PSD: Power Spectral Density; MSC: Magnitude Square Coherence; CCR: Cross-correlation; CCV: Cross-covariance; and PC: Coherence Phase)
| Task | Parameters /channel | Sub-bands: (Mean)±SD |
| Mathematical Problem Solving | PSD | γ: (291.91) ± 57.59 |
| F4-C4 | β: (1.44E+03) ± 925.23 | |
| α: (4.97E+03) ± 8341.26 | ||
| θ: (8.55E+03) ± 9164.61 | ||
| δ: (6.17E+04) ± 89165.31 | ||
| PSD | γ: (511.04) ± 20721.8 | |
| FP2-F8 | β: (2.32E+03) ± 705.32 | |
| α: (7.14E+03) ± 2294.22 | ||
| θ: (2.73E+04) ± 12192.23 | ||
| δ: (1.25E+05) ± 65682.6 | ||
| MSC | γ: (0.2347) ± 0.069 | |
| F4-C4 & FP2-F8 | β: (0.2571) ± 0.10 | |
| α: (0.2673) ± 0.11 | ||
| θ: (0.4966) ± 0.18 | ||
| δ: (0.4750) ± 0.17 | ||
| CCR | γ: (0.0716) ± 0.0293 | |
| F4-C4 & FP2-F8 | β: (0.1737) ± 0.0494 | |
| α: (0.0986) ± 0.044 | ||
| θ: (0.1240) ± 0.129 | ||
| δ: (0.163) ± 0.159 | ||
| CCV | γ: (-4.63E-11) ± 1.8E-10 | |
| F4-C4 & FP2-F8 | β: (-2.52E-09) ± 7.34E-09 | |
| α: (5.02E-10) ± 1.5E-08 | ||
| θ: (-2.1E-07) ± 3.65E-07 | ||
| δ: (9.58E-06) ± 1.9E-05 | ||
| PC | γ: (0.048) ± 0.2 | |
| F4-C4 & FP2-F8 | β: (-0.242) ± 0.5 | |
| α: (-2.00E-02) ± 0.48 | ||
| θ: (0.004) ± 0.58 | ||
| δ: (-0.22) ± 0.3 | ||
| Personal Interview | PSD | γ: (863.49) ± 353.11 |
| T3-T5 | β: (2.48E+03) ± 164.19 | |
| α: (8.75E+03) ± 11629.5 | ||
| θ: (2.93E+04) ± 48782.5 | ||
| δ: (1.26E+05) ± 193954.8 | ||
| PSD | γ: (665.4) ± 263.4 | |
| O2-T6 | β: (2.63E+03) ± 715.1 | |
| α: (5.40E+03) ± 4611.4 | ||
| θ: (1.18E+04) ± 17875.4 | ||
| δ: (3.16E+04) ± 26576 | ||
| MSC | γ: (0.2285) ± 0.0658 | |
| T3-T5 & O2-T6 | β: (0.2636) ± 0.0433 | |
| α: (0.3680) ± 0.1187 | ||
| θ: (0.4134) ± 0.1304 | ||
| δ: (0.4181) ± 0.1341 | ||
| CCR | γ: (0.0538) ± 0.0415 | |
| T3-T5 & O2-T6 | β: (0.2220) ± 0.0203 | |
| α: (0.1510) ± 0.0416 | ||
| θ: (0.2336) ± 0.0796 | ||
| δ: (0.2075) ± 0.1614 | ||
| CCV | γ: (3.79E-10) ± 8.39E-10 | |
| T3-T5 & O2-T6 | β: (-9.53E-10) ± 1.23E-08 | |
| α: (4.01E-08) ± 6.73E-08 | ||
| θ: (-4.07E-07) ± 6.51E-07 | ||
| δ: (-2.08E-07) ± 5.01E-06 | ||
| PC | γ: (-0.0802) ± 0.27 | |
| T3-T5 & O2-T6 | β: (-0.1428) ± 0.4799 | |
| α: (0.01745) ± 0.2982 | ||
| θ: (-0.2062) ± 0.4775 | ||
| δ: (-0.0569) ± 0.3259 |
Discussion
The deeper understanding of cortical coupling is possible by studying the maturation of EEG coherence and phase difference. Coherence function is mainly used in neurology and cardiology. It is the frequency domain function used to find the common frequencies in the two EEG signals and to evaluate the similarity between them. EEG coherence is a statistical measure of the consistency of phase differences and is a measure of phase synchrony/stability.23 When the phase difference is constant or zero then the coherence is equal to one. When phase differences are random then the coherence becomes zero. Estimation of coherence will be more reliable if both magnitude and phase are considered. One of the limitation of the study is small set of electrodes (8 electrodes) are considered and smaller data set (7 subjects) is studied. Work can be carried out on all the 16 electrodes, irrespective of the type of cognitive activity. Table 1 show the statistical analysis carried out on four electrode pairs for both the activities. The choice of reference electrode can affect the amount of coherence. If scalp potential coherence is zero then it can be concluded that it is due to only volume conduction. Volume conduction related problems can be solved by using surface Laplacian.24 It can also be seen in the table 1 that the MS Coherence in all the EEG is bands is almost same (weak) between the electrodes placed on frontal lobe. The values of Coherence were almost same in all the bands and during both the cognitive activities. Work can be used as a guide while deciding upon which connectivity parameters for various cognitive tasks should be studied.25 It was clearly shown that various cognitive tasks do not get well reflected in all the connectivity measures and in all the EEG sub-bands.26,27
Limitations
The study of neuronal correlates was carried out on electrical brain signal with limited number of electrodes. This makes a study conducted with limited spatial and temporal resolution. So, the cognitive assignments based predictions of various connectivity measures are having limits. Such a kind of study can be carried out on multilingual subjects; while performing cognitive/non-cognitive assignments in various languages they are known to. While carrying out such a study, to increase spatial and temporal resolution more number of EEG electrodes can be used. For better understanding of neural correlated, similar kind of study can be carried out on fMRI images and or NIRS based brain signal.
Conclusion
Cognitive performance during the various tasks continues to develop and mature over the time. This is an effort by the authors to study linear and non-linear measures of synchronizations. Magnitude square coherence, cross-correlation, cross-covariance are the linear measures while time series, phase synchrony and phase coherence are the non-linear measures of synchronization. The study was carried out on complete EEG signal as well as on the EEG sub-bands such as Alpha, Beta, Delta, Gamma and Theta. Connectivity measures like MS coherence and cross-covariance was not very useful during this study as these two parameters do not show much change on the lower frequency sub-bands with respect to a specific cognitive activity. Coherent neural activity in the high frequency range (>30Hz) is mostly due to the information processing in visual cortex. The increased phase coherence was observed in the high-frequency band (gamma) during personal interview task. During the formation of answer for the question starting from who/when/what, linking between words is done, were syntax-morphology is used. It was seen that during this activity more changes are observed in the zscore of beta, alpha, theta and delta band. These variations were lesser during the analytical task. Increased cross-correlation in the theta band was observed during the language based task as compared to the analytical task. For rest of the EEG sub-bands cross-correlation based changes were almost same during both the tasks. MS Coherence based changes were not prominently different in all the sub -bands during both the cognitive activities. This shows that generally MS Coherence should not be used as a deciding parameter in cognitive studies as it do not reflect much change in value with respect to the change in activity. For multilingual subjects, such test can be carried out in more than one language and can be studied in detail to find out the effect of change in language on brain processing
References
- Shriram R, Sundhararajan M and Daimiwal N 2013 EEG Based Cognitive Workload Assessment for Maximum Efficiency, IOSR Journal of Electronics and Communication Engineering (IOSR-JECE) ISSN: 2278-2834, ISBN: 2278-8735, PP: 34-38.
- Pereda E, Quiroga R Q, Bhattacharya J 2005 Nonlinear Multivariate Analysis of Neurophysiological Signals, Neurobiology 77 1-37.
CrossRef - Mirowski P, Madhavan D, LeCun Y and Kuzniecky R 2008 Classification of Patterns of EEG Synchronization for Seizure Prediction, American Epilepsy Society annual meeting and at the IEEE Workshop on Machine Learning for Signal Processing.
- Liu T, Shi J, Zhao D & Yang J 2008 The relationship between EEG band power, cognitive processing & intelligence in school-age children, Psychology Science Quarterly, Volume 50(2) 259-268.
- Näpflin M, Wildi M, Sarnthein J 2008 Test–retest reliability of EEG spectra during a working memory task, NeuroImage 43 687–693.
CrossRef - Shriram R, Baskar V, Martin B, Sumdhararajan M and Daimiwal D, 2019 Regression Analysis of Coherence between Concurrent EEG-EEG & EEG-CPPG Signals from Prefrontal Cortex During Music Evoked Emotions, Journal of Information Science and Engineering (JISE), Vol-35, No-3, ISSN: 1016 – 2364.
- Shriram R, Baskar V, Martin B, Sumdhararajan M and Daimiwal D 2018 Connectivity Analysis of Brain Signals during Colour Word Reading Interference”, Biomedicine, Vol-38, No-2, pp: 229-243, ISSN: 0970 – 2067
- Pockett S, Bold G E J and Freeman W J 2009 EEG synchrony during a perceptual-cognitive task: Widespread phase synchrony at all frequencies, Clinical Neurophysiology 120 695–708.
CrossRef - Papana A D 2009 Nonlinear Statistical Analysis of Biological Time Series, PhD Thesis, Aristotle University of Thessaloniki Department of Mathematics, Physics and Computational Sciences Faculty of Technology.
- Shriram R and Sundhararajan M 2015 Coherence analysis of pressure pulse and photoplethysmogram at various sites”, International Journal of Applied Engineering Research (IJAER), Vol – 10, No-7, pp: 14959-14968, ISSN: 0973 – 4562
- Paola M D, Pinnola F P 2012 Cross-Power Spectral Density and Cross-Correlation Representation by Using Fractional Spectral Moments, Meccanica dei materiali e delle Strutture 3, 2, 9-16.
- Ngoc H T, Nguyen T H and Ngo C 2013 Average Partial Power Spectrum Density Approach to Feature Extraction for EEG-based Motor Imagery Classification, American Journal of Biomedical Engineering, 3(6) 208-219.
- Chai R, Tran Y, Craig A, Ling S H and Nguyen H T 2014 Enhancing Accuracy of Mental Fatigue Classification using Advanced Computational Intelligence in an Electroencephalography System, 978-1-4244-7929-0/14/ IEEE.
- Pfurtscheller G and Lopes da Silva F H 1999 Event-related EEG/MEG synchronization and desynchronization: basic principles, Clinical Neurophysiology, 110 1842 -1857.
CrossRef - Lachaux J P, Rodriguez E, Martinerie J and Varela F J 1999 Measuring Phase Synchrony in Brain Signals, Human Brain Mapping 8:194–208.
CrossRef - Kreuz T 2011 Measures of neuronal signal synchrony, Scholarpedia, 6 (12) 11922.
CrossRef - Sadaghiani S, Scheeringa R, Lehongre K, Morillon B, Giraud A, D’Esposito M, and Kleinschmidt A 2012 Alpha-Band Phase Synchrony Is Related to Activity in the Fronto-Parietal Adaptive Control Network, The Journal of Neuroscience, 32 (41):14305–14310.
CrossRef - Singh G, Gupta V and Singh D 2010 Coherence Analysis between ECG Signal and EEG Signal, IJECT Vol. 1, Issue 1, ISSN: 2230-7109 (Online).
- Ombao H and Bellegem S V 2008 Evolutionary Coherence of Nonstationary Signals, IEEE Transactions on Signal Processing, Vol. 56, No. 6.
CrossRef - Scharf L 2014 Coherence as an Organising Principle in Statistical Signal Processing IEEE Workshop on Statistical Signal Processing (SSP), Gold Cost, Australia.
- Zhan Y, Halliday D, Liu X and Feng J 2006 Detecting the time-dependent coherence between non-stationary electrophysiological signals –A combined statistical and time-frequency approach, University of York, YO10 5DD, UK.
- Natarajan K, Acharya R U, Alias F, Tiboleng T and Puthusserypady S K 2004 Nonlinear analysis of EEG signals at different mental states, BioMedical Engineering OnLine, 3:7.
CrossRef - Cona F, Zavaglia M, Astolfi L, Babiloni F and Ursino M 2009 Changes in EEG Power Spectral Density and Cortical Connectivity in Healthy and Tetraplegic Patients during a Motor Imagery Task, Hindawi Publishing Corporation Computational Intelligence and Neuroscience, Article ID 279515.
CrossRef - Martínez-Rodrigo A, Fernández-Sotos A, Latorre J M, Moncho-Bogani J and Fernández-Caballero A 2017 Neural Correlates of Phrase Rhythm: An EEG Study of Bipartite vs. Rondo Sonata Form. Frontiers in Neuroinformatics, 11, 29.
CrossRef - Haufe S 2012 Towards EEG source connectivity analysis,
CrossRef - Stoica P and Moses R 2004 Spectral Analysis of Signals, Prentice Hall, Upper Saddle River, New Jersey 07458. ISBN 0-13-113956-8.
- Shriram R, Sundhararajan M, Shete S and Daimiwal N 2017 Statistical Features based comparison of Analysis and Synthesis of Normal and Epileptic Electroencephalogram for various Wavelets, Turkish Journal of Electrical Engineering and Computer Science, May 2017, Vol-25, No-3, pp: 1795 – 1806, ISSN: 1300 – 0632
CrossRef

