
Manuscript accepted on :29-07-2020
Published online on: 24-08-2020
Plagiarism Check: Yes
Reviewed by: Pavani Laxmi
Second Review by: Hind Shakir
Final Approval by: Dr. H Fai Poon
G.Vaira Suganthi1* , J. Sutha2, M.Parvathy1 and C.Durga Devi3
1Sethu Institute of Technology, Virudhunagar District, India.
2AAA College of Engineering and Technology, Virudhunagar District, India.
3Madurai Medical College, Madurai, India.
Corresponding Author E-mail : vairasuganthi@gmail.com
DOI : https://dx.doi.org/10.13005/bpj/2005
Abstract
Pectoral Muscle Segmentation is an essential pre-processing technique used for subsequent processing of finding abnormalities in mammograms. The aim of this paper is to segment pectoral muscle region from the Mediolateral Oblique view of mammograms. The proposed algorithm uses the active contour and intensity based thresholding approach to identify the boundary existing between the pectoral muscle region and the rest of the breast area. The algorithm works in two stage; Contrast enhancement and contour identification in the pre-processing stage and thresholding approach in the second stage. The algorithm is experimented with the 322 mammogram images available in the Mammographic Image Analysis Society (MIAS) database. The proposed algorithm successfully segmented 298 images and thus produced an accuracy of 92.55%. The algorithm is compared with the existing methodologies and shown promising results.
Keywords
Contour; Intensity; Mammograms; Pectoral Muscle; Pre-processing; Thresholding
Download this article as:| Copy the following to cite this article: Suganthi G. V, Sutha J, Parvathy M, Devi C. D. Pectoral Muscle Segmentation in Mammograms. Biomed Pharmacol J 2020;13(3). |
| Copy the following to cite this URL: Suganthi G. V, Sutha J, Parvathy M, Devi C. D. Pectoral Muscle Segmentation in Mammograms. Biomed Pharmacol J 2020;13(3). Available from: https://bit.ly/3aRp2vt |
Introduction
Breast cancer is a type of disease mainly affects most of the women all over the world. The disease remains a major health issue.1 Although there are many techniques available for the detection of breast cancer, mammography is the most important modality chosen by many people. It is the standard and simple modality preferred by many radiologists. Mammography uses low dose X-rays to produce images of both the breasts.2 These images are known as mammograms. For each breast two views of pictures are taken from different angles: Cranio-Caudal (CC) view and Mediolateral oblique (MLO) view. Radiologists analyse both the views for the interpretation of the presence of breast tumor. Breast cancer mostly has no symptoms at its earliest stages. Thus, an early detection should be done through screening from experts which can give greater success.3
About thirty years many researchers paid their attention over the screening mammograms, since medical image processing is the everlasting field. This field attracted many young scientists.4 There exist several challenges with mammogram screening. They are, breast masses classification, micro-calcifications, architectural distortions and bilateral asymmetry. Computer Aided Detection (CAD) system provides algorithms which are used for diagnosing the presence of breast cancer. CAD helps the radiologists as a diagnosis tool.5
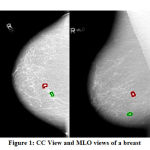 |
Figure 1: CC View and MLO views of a breast |
Generally, the Radiologists prefer the MLO view for diagnosis. This is because the MLO view allows imaging of more of the breast in the upper-outer quadrant, and also the axilla. Figure 1 gives an example for both CC and MLO views of a breast. Comparing the views, it is apparently seen at the top right corner of the MLO view, there exists pectoral muscle. Usually, the pectoral muscle region has more brightness over the rest of the breast area. The difference in intensity between pectoral muscle portion and breast area, approximately triangular in shape, and spills from top to bottom are important structural features of the pectoral muscle.6
The presence of the pectoral muscle may cause difficulty in analysing abnormality in mammograms. It may interfere with the results by producing a bias in breast abnormality detection. While interpreting the textural features of Region of Interest (ROI) in a mammogram, the existence of pectoral muscle may sometimes lead false positives in the detection of suspicious masses. The pectoral muscle exclusion has been considered as an imperative pre-processing practise in many mammographic mass detecting techniques.7
In this paper, a simple active contour and intensity based thresholding method is proposed for the segmentation of pectoral muscle in mammograms to enhance the mammogram images effectively. The method uses an intensity based thresholding technique which segments the pectoral muscle from the rest of the breast area in a mammogram image.
The outline of the paper is arranged as follows. Section 2 gives a literature survey on pectoral muscle segmentation algorithms developed in the recent years. Section 3 explains the methods used in the proposed algorithm. Section 4 produces the experimental results and discussion. Section 5 concludes the paper.
Related works
Rongbo Shen et al. (2018) 6 proposed an automatic segmentation algorithm combining genetic algorithm and morphological selection algorithm. Genetic algorithm used wavelet transform for finding multilevel thresholds for pectoral region segmentation. The morphological selection algorithm efficiently selected an optimal contour.
Andrik Rampun et al. (2017)7 extracted the pectoral region boundary using thresholding and active contour model. The boundary is refined as a post processing process caused by the artifacts. The algorithm produced 97.8% as classification accuracy with MIAS dataset. Since it relied only on canny edge algorithm if it failed to detect the edge, the algorithm wrongly assumed that the muscle is not present. The active model used is slow due to the need to periodically reinitialize the model to change the level set function.
Saied Asgari et al. (2017)8 introduced a new method that combined geometric rules with a region growing algorithm to support the segmentation of all types of pectoral muscles. The method automatically found the starting point of the pectoral muscle and also found the maximum inscribed circle in the breast contour. The method is applied for all types of breast images including dense breasts. The difficulty in the method is the inclusion of segmentation based feature extraction.
Vikhe et al. (2016)9 proposed an algorithm using intensity based approach for the detection of pectoral region boundary in mammograms. A new filter has been designed for the enhancement of boundary points. The pectoral boundary points were identified using a threshold technique. Finally, the boundary points were connected to get an edge between pectoral muscle and breast region. The algorithm worked on MIAS database and produced an accuracy of 96.56%. The algorithm failed to give accurate result in case if the entire mammogram has same grey level intensity.
Khamsa Djaroudib et al. (2015)10 presented an algorithm to segment the pectoral muscle using textural descriptors. The authors used the anisotropic filter diffusion SRAD (Speckle Reducing Anisotropic Diffusion) and Contrast Limited Adaptive Histogram Equalization (CLAHE) to enhance the image. The textural features are extracted from the images using GLCM according to the parameters; direction, the distance, a neighborhood size, the texture descriptor of Haralick. The method produced an accuracy of 90.1%. The method used limited number of images only.
Yanfeng Li et al. (2013)11 proposed an algorithm which used two anatomical features, homogeneous texture and high intensity deviation of mammogram images as a first stage in pectoral region segmentation. Then a Kalman filter was applied for fine refinement of edges. The algorithm produced a classification accuracy of 90.06% on MIAS dataset.
Mario Mustra et al. (2012)12 used the combination of contrast enhancement method and adaptive histogram equalization technique for enhancing the mammogram before segmentation. The region of interest was estimated by polynomial curvature estimation method. For artefact removal, Hough transform was applied followed by k-means thresholding. The authors applied the algorithm on MIAS dataset and obtained an accuracy of 91.6%.
Ines Domingues et al. (2010)13 presented a method which used a shortest path technique to construct a contour of a pectoral muscle based on the determination of endpoints with a supervised learning regression algorithm. Initially the end points are identified using the grey level intensity variation. Using the Dijkstra’s algorithm the shortest path is found. The algorithm learnt the endpoints, based on a SVR model, receiving the information from a thumbnail of the mammogram. The method used the information from a thumbnail of the mammogram. This may reduce the accuracy when the image is scaled up.
Zhili Chen et al. (2010)14 proposed a fully automated breast area segmentation method based on histogram thresholding, edge detection in scale space, contour growing and polynomial fitting. Then, pectoral muscle was removed using region growing algorithm. The segmentation of pectoral removal algorithm, was tested over 240 mammographic images from the EPIC database and produced a result of 62.5% accuracy.
David Raba et al. (2005)15 presented an algorithm which worked in two stages. After applying an adaptive histogram equalization technique, a selective region growing algorithm was used. The classification accuracy was 86%. The authors reviewed on pectoral muscle segmentation algorithms developed from 1980 onwards. The algorithm were proposed under several categories. The various approaches used were classified as histogram based, gradient based, active contour based, polynomial modelling and classifiers.
Kwok at al. (2001)16 proposed an algorithm which worked in two stages. In the first stage, the straight line is estimated using Hough transform with iterative thresholding and a gradient test for edge detection. For smooth line fitting cliff detection is used. Cliff detection is used to detect only intensity drop but to ignore intensity rise. The algorithm produced an accuracy of 94%. The algorithm produced uncertainty in edge detection while considering the lower half of the pectoral muscle.
Pectoral Muscle Segmentation Method
Accurate identification of the pectoral muscle in mammogram is very useful for its removal, so that the successive analysis of breast tumour without the bias produced by the pectoral muscle can be developed. It is very difficult to measure the volume of the pectoral muscle by ordinary eyes. It will be better if there exists a Computer Aided Detection (CAD) system for the effective identification and removal of pectoral muscle.17 In this paper, an algorithm for the pectoral muscle segmentation using active contour and intensity based approach is proposed.
For experimental evaluation, mammogram images from MIAS database are used. The proposed algorithm is tested over 322 images including the three categories; Malignant, Benign and Normal.
Breast Orientation
Pectoral muscle can be seen in the MLO view of a breast clearly.17 For a patient the images are taken from two breasts. It would be easier to apply the algorithm if the pectoral muscle is present at the top left corner. Breast orientation is found and appropriate steps are executed to make a common orientation for all the images.
Step 1: To identify whether view of the image is left oriented or right oriented, the contour of the image is constructed. Figure 2 gives an example for extracting the contour from the image mdb028.jpg from MIAS data base.
Step 2: The coordinates of the contour are stored in two different vectors. The coordinates belong to the left side of the contour are stored in a vector P1 and the right side coordinates are stored in another vector P2. The vectors are tested to check which one has the coordinates for a straight line.
Step 3: If P1 has a straight line then the image is kept as it is. Otherwise, the image is flipped and the mirror image is considered for further processing.
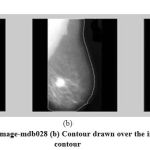 |
Figure 2: (a) Original image-mdb028 (b) Contour drawn over the image (c) Extracted contour |
Figure 3 depicts the process of producing the mirror image of a mammogram image if it is right oriented.
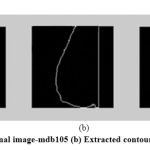 |
Figure 3: (a) Original image-mdb105 (b) Extracted contour (c) Mirror Image |
Contrast Enhancement
Contrast enhancement technique is applied on the image to find the distinct variation in the brightness over the image. Contrast enhancement technique improves the visibility of suspected regions in the mammogram image by enhancing the brightness difference between region and the background. The procedure involved in contrast enhancement technique is a contrast stretch followed by a tonal enhancement. A contrast stretch increases the differences in brightness uniformly across the image, whereas tonal enhancement increases the differences in brightness in the dark, greys or bright regions.18
g(f)=af+b (1)
[s1 s2]=>[t1 t2] (2)![]()
![]()
The above set of equations is used to linearly stretch the grey values to a specific range, where t1, t2 and s1, s2 represent the target range of grey values and source range of grey values respectively.18
After applying contrast stretching method, the breast area is extracted by removing the unwanted columns from the image. Figure 4 explains the process of extracting breast area from the contrast enhanced image.
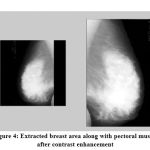 |
Figure 4: Extracted breast area along with pectoral muscle after contrast enhancement |
Pectoral Muscle Boundary Detection
After enhancing the image, the artifacts are removed from the image using top hat morphological operation. To identify the boundary of the pectoral region the following procedure is used. In general, an edge in an image is defined as the intensity variation between bright and dark regions. [9] Initially, in the image matrix, the maximum grey value in the first row is found and it is considered as the threshold for the first row. It is compared with each pixel in all the columns and a pixel which has an intensity value less than the threshold value is identified and the coordinates of the pixel are stored in an array.
The above step is repeated for all the rows in the image. The coordinates stored in the array are connected to form an edge. The connected identified pectoral region and segmented from the enhanced image. The overall process is explained with the flow diagram in figure 5.
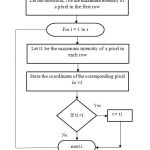 |
Figure 5: Pectoral muscle boundary Identification |
Figure 6 represents the process involved in the pectoral muscle segmentation for a sample image mdb105.jpg.
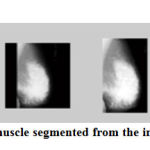 |
Figure 6: Pectoral muscle segmented from the image mdb105 |
Measuring the Quality of the Segmented Image
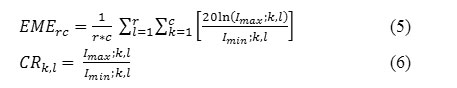
Measure the quality of the segmented images with the parameters EME (Measure of Enhancement) and Entropy. Let A(m,n) be an image which is divided into r*c blocks, with m*n being the size of the image. Let each block be represented as Bk,l(i,j) where i,j refer to ith row and jth column respectively inside each block. Let Imax ;k,l and Imin ;k,l be the maximum and minimum intensity in an image block Bk,l(ij).19
EME is defined as,
Entropy is calculated over entire image from the histogram of that image. It is a measure of randomness used to characterize the texture of the image.
![]()
Where p is the histogram count for a segment of image. Since entropy is calculated over entire image, if the contrast in one portion of an image is increased and decreased in the rest of the portion the entropy will be similar.
Results and Discussion
Experiments have been conducted with the mammogram images of MIAS database. The algorithm has been tested on 322 images including all the three cases: malignant, benign and normal. The following images illustrate the process of pectoral region segmentation.
 |
Figure 7: Segmented Malignant Image – mdb075 |
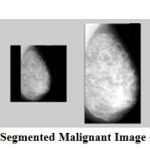 |
Figure 8: Segmented Malignant Image – mdb130 |
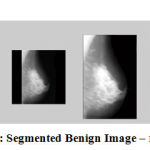 |
Figure 9: Segmented Benign Image – mdb121 |
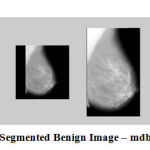 |
Figure 10: Segmented Benign Image – mdb160 |
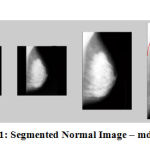 |
Figure 11: Segmented Normal Image – mdb003 |
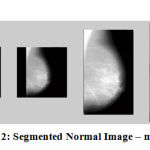 |
Figure 12: Segmented Normal Image – mdb014 |
The results show that the proposed algorithm efficiently segmented the pectoral muscle region from the rest of the breast region. Figures 7 and 8 illustrate the application of the proposed algorithm over two malignant cases. Figures 9 and 10 demonstrate the output for two benign cases. Figures 11 and 12 give the results for two normal cases. The proposed algorithm has been tested with 322 mammogram images taken from MIAS dataset. The enhanced images are evaluated by the parameters, measure of enhancement and entropy. The following table 1 depicts the values of the parameters before and after applying the algorithm.
Table 1: Parameter Evaluation
| Image Id | EME | Entropy | ||
| Original | Enhanced | Original | Enhanced | |
| mdb105 | 4.6493 | 4.7739 | 5.0594 | 6.4253 |
| mdb023 | 4.1102 | 5.2013 | 5.1452 | 6.0981 |
| mdb028 | 4.1907 | 4.8486 | 5.6128 | 6.2081 |
| mdb058 | 4.0228 | 4.1359 | 4.2955 | 5.3875 |
| mdb075 | 4.4574 | 5.6619 | 4.2235 | 5.0629 |
| mdb001 | 4.3245 | 5.7664 | 4.0797 | 6.4552 |
| mdb010 | 3.9705 | 4.2286 | 3.9574 | 5.7427 |
| mdb063 | 3.8367 | 4.3542 | 4.1903 | 5.7905 |
| mdb097 | 3.2235 | 3.7231 | 4.3838 | 5.9867 |
| mdb160 | 4.0808 | 4.4317 | 4.6357 | 5.6594 |
| mdb008 | 4.7336 | 4.9163 | 5.0700 | 5.8255 |
| mdb014 | 4.1456 | 4.3839 | 4.6280 | 5.6900 |
| mdb016 | 3.9169 | 4.5976 | 3.7852 | 6.4998 |
| mdb024 | 4.5932 | 5.8246 | 5.0359 | 5.7463 |
From the table it is observed that for the segmented sample images both the parameters EME and Entropy are improved. The proposed algorithm segmented 298 images successfully among 322 images. The accuracy obtained is 92.55%. The following table 2 gives the comparative analysis of the existing methodologies with the proposed algorithm.
Table 2: Comparative Analysis
| Authors Name | Methodology Used | Accuracy |
| Khamsa Djaroudib et al. | SRAD and CLAHE | 90.1 % |
| David Raba et al. | AHE and Region Growing Algorithm | 86% |
| Yenkeng Li et al. | Homogeneous Texture and High Intensity Deviation | 90.06% |
| Zhili Chen et al. | Histogram Thresholding and Region Growing Algorithm | 62.5% |
| Mario Mustra et al. | Contrast Enhancement and Adaptive Histogram Equalization | 91.6% |
| Proposed Method | Contrast Enhancement and Intensity based Thresholding | 92.55% |
Conclusion
The presence of pectoral muscle is an unwanted portion in a mammogram image. Exclusion of the region will enhance the image and can be used for subsequent processing of finding anomalies in the image. The proposed algorithm first enhances the image using Contrast Enhancement technique and the contour of the breast is identified. Then the enhanced image is undergone an iterative intensity based thresholding technique to find the boundary between the pectoral muscle and the breast region. The algorithm is experimented with a total of 322 images taken from a publicly available MIAS database and segmented 298 images accurately thus produced an accuracy of 92.55%. This algorithm can be considered as a pre-processing technique and can be further used for segmentation and classification tasks.
Conflict of Interest
The authors have no conflict of interest to report.
Ethical Approval
Since the model developed in this work uses publicly available databases that can be used only for research purposes, no ethical approval is needed.
Informed Consent
None declared
References
- Sivaranjani, K, Vaira Suganthi and G, Sutha, J. Breast cancer diagnosis in mammography images using 2D-DWT and LESH feature extraction technique. International Journal of Engineering Science and Computing, 2016; 6 (6): 7508-7512.
- Vaira Suganthi, G, Sutha, J and Parvathy, M. A Survey on Machine Learning Algorithms for the Diagnosis of Breast Masses with Mammograms. Current Medical Imaging, 2020; 16(6): 639-652.
- Amira Jouirou, Abir Baâzaoui and Walid Barhoumi. Multi-view information fusion in mammograms: A comprehensive overview, Information Fusion, 2019; 52(1): 308–321.
- Vaira Suganthi, G, Sutha, J. Classification of breast masses in mammograms using support vector machine, International Journal of Computer Applications, 2012; 1-6.
- Diniz, J. O. B., Diniz, P. H. B., Valente, T. L. A., Silva, A. C., de Paiva, A. C., and Gattass, M. Detection of mass regions in mammograms by bilateral analysis adapted to breast density using similarity indexes and convolutional neural networks, Computer methods and programs in biomedicine, 2018; 156(1): 191-207.
- Rongbo Shen, Kezhou Yan, Fen Xiao, Jia Chang, Cheng Jiang and Ke Zhou. Automatic Pectoral Muscle Region Segmentation in Mammograms Using Genetic Algorithm and Morphological Selection. Journal of Digital Imaging, 2018; 31(5): 680–691.
- Andrik Rampun, Philip J.Morrow, Bryan W.Scotney and John Winder. Fully automated breast boundary and pectoral muscle segmentation in mammograms. Artificial Intelligence in Medicine, 2017; 79: 28-41.
- Saied Asgari Taghanaki, Yonghuai Liu, Brandon Miles and Ghassan Hamarneh. Geometry based pectoral muscle segmentation from MLO mammogram views. IEEE Transactions on Biomedical Engineering, 2017; 64(11): 2662- 2671.
- Vikhe, P.S and Thool, V.R. Intensity based Automatic Boundary Identification of Pectoral Muscle in Mammograms. Proceedings of 7th International Conference on Communication, Computing and Virtualization, 2016: 262 – 269.
- Khamsa Djaroudib, Pascal Lorenz, Abdelmalik Taleb Ahmed and Abdelmadjid Zidani. Pectoral and Breast Segmentation Technique Based on Texture Information. Springer International Publishing, 2015: 219 – 228.
- Yanfeng Li, Houjin Chen, Yongyi Yang and Na Yang, Pectoral muscle segmentation in mammograms based on homogenous texture and intensity deviation. Pattern Recognition, 2013; 46(3): 681-691.
- Mario Mustra and Mislov Grgic. Robust Automatic Breast and Pectoral Muscle Segmentation from Scanned Mammograms. Signal Processing, Elsevier, 2012; 93(10), 2817-2827.
- Ines Domingues, Jaime S. Cardoso, Igor Amaral, Ines Moreira, Pedro Passarinho, Joao Santa Comba, Ricardo Correia and Maria J. Cardoso. Pectoral muscle detection in mammograms based on the shortest path with endpoints learnt by SVMs. Proceeding of International Conference of the IEEE EMBS Buenos Aires, 2010: 3158-3163.
- Zhili Chen and Reyer Zwiggelaar. Segmentation of the Breast Region with Pectoral Muscle Removal in Mammograms. International Journal of computer Applications, 2010; 1(6): 1-5.
- David Raba, Arnau Oliver, Joan Mart, Marta Peracaula, Joan Espunya, Breast Segmentation with Pectoral Muscle Suppression on Digital Mammograms, Springer-Verlag, (2005) 471–478.
- Kwok,S.M, Chandrasekhar,R and Attikiouzel, Y. Automatic pectoral muscle segmentation on mammograms by straight line estimation and cliff detection. Proceedings of Seventh Australian and New Zealand Intelligent Information Systems, 2001: 67-72.
- Santle Camilus, K, Govindan, V.K, Sathidevi, P.S. Computer-Aided Identification of the Pectoral Muscle in Digitized Mammograms. Journal of Digital Imaging, 2010; 23(5): 562–580.
- Suneet Gupta and Rabins Porwal. Appropriate Contrast Enhancement Measures for Brain and Breast Cancer Images. International Journal of Biomedical Imaging, 2016: 1-8.
- Anand, S, and Gayathri, S. Mammogram image enhancement by two-stage adaptive histogram equalization. Optik-International Journal for Light and Electron Optics, 2015; 126(21): 3150–3152.

