
Manuscript accepted on :30-Sep-2020
Published online on: --
Plagiarism Check: Yes
Reviewed by: Ali Fredrick
Second Review by: Abhishek Raj
Tilak Ram Chandrakar1 , Ajit Pratap Singh2, Bikas Chandra Sarkhel2 and Suvendra Nath Bagchi1*
1Department of Biological Science, Rani Durgavati University, Jabalpur 482001, Madhya Pradesh, India.
2Animal Biotechnology Center, Nanaji Deshmukh Veterinary Science University, Jabalpur 482001, Madhya Pradesh, India.
Corresponding Author E-mail: snbagchi_in@yahoo.com
DOI : https://dx.doi.org/10.13005/bpj/1983
Abstract
Pesticides constitute a different class of chemicals, basically designed for the protection of agricultural crops by controlling a variety of insects, pests, weeds harmful for the agricultural plants. Pesticides are considered as potential chemical mutagens. Experimental data have shown that various agrochemicals have lethal effects, including mutational properties such as chromosomal changes, DNA damage, micronuclei formation or cytotoxicity in the cellular level. This study was designed to examine the cytotoxic and genotoxic effects of carbofuran and malathion pesticides on cat (Felis catus) fibroblast cells. The deterrent effects were assessed based on cell viability, chromosomal changes and DNA damage on fibroblast cells in approx. 1×10⁵ cells. The cells were exposed to 0.045 mM - 1.08 mM of carbofuran for 24 h, and 5 mM – 45 mM of malathion for 48 h. The effects were evaluated in terms of DNA damage as changes in comet tail length, comet scores, chromosomal aberrations and micronucleus formation. Lethal doses were determined by using MTT assay whereas crystal violet staining was carried out to assess cytotoxic effects. The LC50 concentrations of carbofuran and malathion were estimated to be 0.42 mM and 20 mM, respectively. The maximum DNA damage was attained at 1.08 mM of carbofuran and 45 mM of malathion. The genotoxic and cytotoxic effects of the two chemically different pesticides in F. catus fibroblast cells was evident. While carbofuran was more toxic in terms of lethal doses and exposure time, malathion seemingly promoted genomic instability, albeit at unusually high concentrations.
Keywords
Carbofuran; Cytotoxicity; Felis Catus; Fibroblast Cell Line; Genotoxicity; Malathion
Download this article as:| Copy the following to cite this article: Chandrakar T. R, Singh A. P, Sarkhe B. C, Bagchi S. N. In Vitro Cytotoxicity and Genotoxicity Assessments of Carbofuran and Malathion Pesticides on Cat (Felis catus) Fibroblast Cells. Biomed Pharmacol J 2020;13(3). |
| Copy the following to cite this URL: Chandrakar T. R, Singh A. P, Sarkhe B. C, Bagchi S. N. In Vitro Cytotoxicity and Genotoxicity Assessments of Carbofuran and Malathion Pesticides on Cat (Felis catus) Fibroblast Cells. Biomed Pharmacol J 2020;13(3). Available from: https://bit.ly/3dI0mHf |
Introduction
Pesticides are the chemical compounds that are used to kill pests, including insects, rodents, fungi and weeds1. The active ingredients of these compounds are mainly organophosphorus (OP), carbamates, chlorinated hydrocarbons, and carbamide derivatives2. Carbofuran (2,3-dihydro-2,2-dimethyl-7-benzofuranyl methylcarbamate) and malathion (diethyl, 2-[(dimethoxyphosphinothioyl] butanedioate) have short half-life in the environment 3,4 and these anthropogenic compounds bring about substantial hazard to the public, environment and animals5-7. Carbofuran and malathion poisoning shows various symptoms such as, dizziness, blurred vision, excessive perspiration, salivation, vomiting, diarrhea, aching muscles and a general feeling of severe malaise8,9.
Organophosphorus and carbamate toxicants share a common mode of action, i.e., both inhibit acetylcholinesterase and butyrylcholinesterase in vitro and in vivo, and consequently prevent acetylcholine hydrolysis10,11. Accumulation of acetylcholine impairs the nervous system and respiratory muscles, and increase the nerve impulse transmission to cause respiratory paralysis12. Carbamate is one of the most toxic pesticides and known to exert high toxicity to mammalian systems, and also produce an adverse health problem for humans, animals and wildlife3. Malathion, on the other hand, is a commonly applied agrochemical formulation which produces low to moderate toxicity13. The epidemiological studies provide evidence that long-term exposure leads to neurological and cardiac dysfunction, retinal degeneration and gastrointestinal problems5,14.
Chronic and acute exposure of OP compounds can be differentiated by determining their concentrations in blood and urine. Concentrations in a range 10-100 μg/ml in human tissue reflect their acute, accidental or intentional exposure, whereas lower concentrations (0.01-1 μg/ml) represent the chronic environmental exposure15. There are also evidences suggesting that upon exposure to profennofos, endosulfan and chlorpyrifos pesticides, the isolated human lymphocytes display extensive chromosomal aberration and DNA damage16. Moreover, another study using carbofuran revealed that in human blood cells, the extent of DNA damage reflected in comet assay was directly dependent on the concentration of the test OP pesticide17. Carbofuran also induced micronuclei formation in Chinese hamster ovary (CHOK1) cells, an attribute demonstrating genotoxicity18. Overall, the effects of pesticides have been mostly examined on human, and rat lymphocytes and human liver carcinoma (HepG2) cell lines15-19.
Reactive seizures have been detected as a common neurological disorder in cats intoxicated with OP insecticides20. These insecticides are used in pets for treating tick- and lice-infestation of skin. For chronic level intoxication and early diagnosis, genotoxic assays are better option compared to acertylcholiesterase-inhibition assays, which is used in acute cases. To best of our understanding, the genotoxic and cytotoxic assessment of insecticides has not been carried out in a feline model cell lines. Moreover, skin fibroblast cells, the primary target of pesticide exposure, is rarely tested for toxicological analyses.
The present study reports on the deterrent effect of carbofuran and malathion pesticides on viability of cat (F. catus) fibroblast cells. Further, the effects were also examined on chromosomal aberrations and DNA damage using comet assays.
Materials and Methods
Chemicals
The following chemicals were purchased at their purest grades: carbofuran (Sigma 426008), malathion (Sigma 36143), fetal bovine serum (Hyclonesh 30070.70), Dulbecco’s Modified Eagle Medium (DMEM; Sigma D 6170), Dulbecco’s Phosphate Buffer Saline (DPBS; Sigma D 4031), Typsin-EDTA (Sigma T 4049), L-glutamine (Sigma 8540), gentamicin sulphate (Dsuchefa Biochemical k 0124), giemsa stain solution (Himedia TCL 083), colchicine (Sigma C3915), dimethylsulfoxide (DMSO; Merck C6164), ethidium bromide (EtBr) solution (Promega), cyclophosphamide (Merck BP094), 3-(4,5-dimethylthiazol-2-yl)-2,5-diphenyltetrazolium bromide (MTT) (Sigma 88417), Tris base, Triton-X 100, normal melting agarose (Lonza 50004) and low melting agarose (Himedia RM861).
Establishment of a fibroblast cell line from cat tissue and stock preparation of pesticides
F. catus ear tissue samples were collected from injured 10-month old healthy female cat brought to the Department of Surgery, Nanaji Deshmukh Veterinary Science University, Jabalpur, India, for the treatment. Tissue samples were collected by the veterinary surgeon with the owner’s permission at the size of 0.5 × 0.5 cm from the wounded area of the skin. A tissue sample was processed as per the standard protocol of animal cell culture technique21. Tissue chopped in approx. 0.1 cm small pieces under biosafety cabinet (Esco standard II) was transferred into T-25cm2 cell culture flasks with addition of small drop of fetal bovine serum (FBS), and left for 3-4 h for tissue attachment on flask surface. After the tissue attachment, cell nutrient medium, e.g. DMEM with 15% FBS, was filled into the flask. It was found that cells started to sprout at 12 d from the tissue explant and propagated for increasing cell density into the flask. When cells reached in 70-80% confluency, they were detached by adding 1 ml of 0.25% warm trypsin enzyme. After the complete growth, cells were passaged and transferred into the new culture flask for making a pure cell line. Meanwhile, a stock concentration of carbofuran was prepared in a 1% DMSO solution22. Malathion was diluted from commercial stock. After growth of the cells, they were exposed to the increasing concentration of carbofuran (0.045 mM to 1.08 mM) and malathion (5 mM to 45 mM). Experiments were performed in triplicates for all in vitro assays along with controls containing equivalent volume of the solvent run in parallel.
Cell viability and cytotoxicity of fibroblast cells by crystal violet staining and MTT Assay
To carry out these experiments, 1 × 10⁴ numbers of cells were seeded into the 96-well cell culture flask for cell proliferation in CO2 incubator (Thermo Fisher) at 370C, 98% humidity and 5% CO2. When cells reached around 70-80% confluency, these were exposed to increasing concentrations of carbofuran and malathion and incubated for 24 h and 48 h respectively, along with control cells without added pesticides. After that cells were subjected to viability determination by adding 0.5% crystal violet solution and measured the optical density (OD) at 570 nm using plate reader for percentage cytotoxicity evaluation6,15,23. On another 96 well plate having same conditions, a ten µl of 5 mg/ml MTT prepared in PBS was added into the carbofuran and malathion treated cells. The plate was further incubated for 3 h for the formation of formazan crystal. After the incubation time, MTT was removed and the formazan crystal was dissolved by adding 100 µl DMSO into the treated and control wells. The OD value was measured at 570 nm using Thermo lab systems Multiskan EX model no. 355 microplate reading spectrofluorimeter. Viability was determined by comparing the OD values of controls with the treated cells. Three parallel experiments were carried out and for each experiment triplicate analysis was done.
Chromosomal aberration assay
Cultured fibroblast cells when reached at the density of 1×10⁵ were treated with different concentrations of carbofuran (0.045 mM to 1.08 mM) and malathion (5 mM to 45 mM) for toxicity screening along with controls. Chromosomes were arrested during cell division at metaphase stage by adding 1 µl/ml of colchicine prepared in ethanol at a stock concentration of 10 mg/ml. After 45 min of incubation at 370C the entire culture medium was pipetted out. Cells were detached by adding 1 ml of 0.25% warm trypsin for 2 min followed by hypotonic treatment at 370C with 0.56% warm KCl for another 30 min. Cells were found swollen after this treatment. Swollen cells were re-suspended in chilled 5 ml of methanol: acetic acid (3:1 vol/vol) and centrifuged at 1,200 × g for 10 min. The process was repeated twice to recover chromosome material as pellet, which was finally suspended in 50 µl methanol-acetic acid mix and dropped on to the clean glass slide24. The chromosomes were stained by using giemsa stain solution for 20 min, and thereafter slides were dried and observed under compound microscope (Leica DM 3000) at 100X objective for observing any chromosomal aberration.
Micronuclei (MNi) analysis
The method of Soloneski et al.18 was modified as follows: at least 500 metaphase-arrested cells were scored at 20X magnification. MNi were counted in untreated controls (solvent alone) and pesticide-treated cells according to the OECD Test Guideline #473 at concentrations which resulted 55±5% cytotoxicity in the above MTT assay. The criteria employed in identifying MNi were: approximate diameter smaller than the main nuclei, same staining intensity as or lighter than that of the main nuclei, and MNi boundary distinguishable from main nuclei boundary.
Single cell gel electrophoresis (Comet assay)
DNA damage caused by the pesticides, carbofuran and malathion, was observed using Single Cell Gel Electrophoresis (SCGE) as described by Dhawan et al.25 with slight modification. For this experiment, cat fibroblast cells (CFC) were incubated for 24 h and 48 h with various concentrations of the two pesticides. Positive controls consisted of cells treated with 1 µM concentration of cyclophosphamide16. Negative controls were set up by incubating fibroblasts with the solvent DMSO at a final concentration of 1%. All the 24 wells having fibroblast cells treated with pesticides along with control samples were mixed with 20 µl of 0.5% low melting agarose (LMA), and layered on the surface of clean glass slides which was previously coated by 1% normal melting agarose (NMA). Cover slip was put on the glass surface and placed on the ice packs for fixation. After that the slides having cells were equilibrated for 2 h at 40C into the cold cell lysis buffer comprising of 2.5 M NaCl, 100 mM Na-EDTA and 10 mM Tris base, pH 10.0. After this, the slides were left into the alkaline electrophoresis solution buffer (1 mM Na-EDTA and 300 mM NaOH, pH ≥13) and electrophoresed for 20 min at 24 volts (~0.74 v/cm) and current 300 mA. The slide was removed off the tank and drop-wise coated with neutralization buffer (0.4 M Tris-HCl pH 7.5) and allowed to stand for at least 5 min. After draining the liquid, the process was repeated two more times and finally absolute methanol was poured for dehydration. Slides were than air-dried by placing them into the hot air oven at 500C for 30 min and stored in a dry area. As per the requirements, slides were rehydrated by adding chilled distilled water for 30 min and were stained up to 5 min with 0.5 ml of 1× EtBr (10 mg/ml). The whole process of comet assay was performed under yellow/ dimmed light to prevent any DNA damage owing to fluorescent white light. The analysis was performed under 100X objective by using fluorescent compound microscope (Leica DM 3000). At least 100 cells were screened per slide, and per treatment at least three slides were visualized. In the first set of analysis comet tail length was measured using micrometer fitted with the microscope.
In the other set, image analysis was carried out according to Collin’s method modified by Driessens et al.26. Briefly, DNA damage was categorized into four classes (refer, Supplementary Fig. 1): class 1 (no tail or halo around the nucleus), and class 2-4 (corresponding to gradual increase in DNA damage). At least 100 randomly cells per slide and three slides per treatment were measured. The scores were expressed per 100 comets in arbitrary units in a range of 100 (all comets in class 1) and 400 (all in class 4).
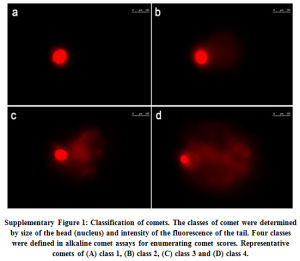 |
Supplementary Figure 1: Classification of comets. The classes of comet were determined by size of the head (nucleus) and intensity of the fluorescence of the tail. Four classes were defined in alkaline comet assays for enumerating comet scores. Representative comets of (A) class 1, (B) class 2, (C) class 3 and (D) class 4. |
Statistical Analysis
Statistical significance between control and pesticide treated cells were calculated by One way Anova with post hoc Tukey HSD test.16 The concentration required to reduce the cell viability by 50% was determined by Graph pad Prism Software v. 527,28. Data on statistical analysis were presented as mean ± standard deviations (SDs). p<0.05 values were considered as being statistically significant.
Results
The cytotoxicity percentage graph based on MTT test is presented in Fig. 1. Cell viability percent decreased with the increase in the concentrations of both carbofuran and malathion. The LC50 values for carbofuran and malathion in CFC were calculated to be 0.42 mM and 20 mM respectively, which caused 50% cytotoxicity calculated by Graph pad Prism Software v. 5. The cytotoxicity test as against increasing doses of the pesticides was also performed using crystal violet staining. This experiment shows a clear dose-dependent cytotoxic effect of the pesticides on CFC as shown in Fig. 2; Table 1.
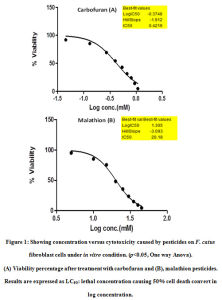 |
Figure 1: Showing concentration versus cytotoxicity caused by pesticides on F. catus fibroblast cells under in vitro condition. (p˂0.05, One way Anova). |
 |
Figure 2: Showing crystal violet stained cells of carbofuran and malathion treated F. catus fibroblast cells. |
Table 1: Estimation of percentage viability by crystal violet stain in cat fibroblast cells after exposure to carbofuran and malathion pesticides.
|
Carbofuran Conc. (mM) |
Treatments (24 h) | ||||||
|
Control (Untreated) (A) |
0.42 (LC50) (B) |
1.08 (>LC50) (C) |
|||||
| Mean OD±SE | %Viability | Mean OD±SE | %Viability | Mean OD±SE | %Viability | ||
| 0.96±0.020 | 100% | 0.45±0.030 | 49% | 0.01±0.010 | 1% | ||
|
Malathion Conc. (mM)
|
Treatments (48h) | ||||||
|
Control (untreated) (D) |
20 (LC50) (E) |
45 (>LC50) (F) |
|||||
| Mean OD±SE | %Viability | Mean OD±SE | %Viability | Mean OD±SE | %Viability | ||
| 0.91±0.031 | 100% | 0.50±0.020 | 55% | 0.10±0.010 | 10% | ||
For cytogenic analysis, the metaphase-arrested cells were screened to check the frequency of chromosomal aberration. The data presented in Table 2 clearly indicates that the frequency kept on increasing with concentration of the pesticides. Metaphase plates with chromosomal aberrations are presented in Fig. 3 a–f. At LC50 concentrations (0.42 mM carbofuran and 20 mM malathion) the mean percentage of satellite associations, and mean percentage of breaks, gaps and fragments were found to be 1.2-1.5-fold higher upon treatment with carbofuran than malathion. At higher concentrations (1.08 mM carbofuran and 45 mM malathion) too, the trend was almost the same.
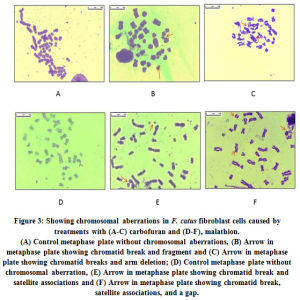 |
Figure 3: Showing chromosomal aberrations in F. catus fibroblast cells caused by treatments with (A-C) carbofuran and (D-F), malathion. |
Table 2: The frequency of chromosomal aberrations in CFC treated with increasing concentrations of carbofuran and malathion pesticides.
| Used chemicals | No. of cell scored | Breaks | Gaps | Satellite association | Fragments | ||
| Carbofuran* | |||||||
| Control untreated | 100 | ND | 1±0.020 | 3±0.023 | ND | ||
| 0.045 mM conc. | 100 | 4±0.012 | 3±0.012 | 6±0.011 | 1±0.010 | ||
| 0.42 mM conc. | 100 | 7±0.023 | 5±0.018 | 12±0.020 | 3±0.018 | ||
| 1.08 mM conc. | 100 | 12±0.020 | 9±0.022 | 16±0.022 | 5±0.022 | ||
| Malathion* | |||||||
| Control untreated | 100 | ND | 1±0.010 | 1±0.010 | ND | ||
| 5 mM conc. | 100 | 2±0.018 | 2±0.015 | 4±0.020 | 1±0.018 | ||
| 20 mM conc. | 100 | 5±0.020 | 4±0.022 | 8±0.023 | 2±0.020 | ||
| 45 mM conc. | 100 | 8±0.022 | 8±0.020 | 12±0.022 | 4±0.022 | ||
*p<0.05 (ANOVA) found significant when compared to the control for all experiments
ND: Not detectable.
Each experiment was carried out in triplicate manner for checking the chromosomal aberrations, and 100 metaphases were screened for each set. Chromosomal aberration found to be dose dependent with increasing breaks, gaps, satellite association, fragments and micronuclei formation as compared with untreated (control).
Our next objective was to observe, to what extent the chromosomes micronucleated at aberration stages. As per the OECD guideline the doses chosen were slightly higher than the LC50 (≈ LC55). Fig. 4 a-c shows the presence of MNi under different treatments. Upon enumeration, significant increase in micronucleated cells under malathion treatment (55.0±2/500 versus 5.0±1/500 in DMSO control, p<0.01; ANOVA) was found in CFC. There was marginal yet significant increase in MNi recorded under carbofuran (12.0±2/500 versus 6.5±1/500 in solvent control, p<0.05). The MNi were quite discrete from the main nuclei in the carbofuran treated cells whereas they were closely attached in case of malathion.
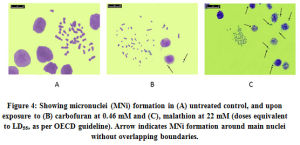 |
Figure 4: Showing micronuclei (MNi) formation in (A) untreated control, and upon exposure to (B) carbofuran at 0.46 mM and (C), malathion at 22 mM (doses equivalent to LD55, as per OECD guideline). Arrow indicates MNi formation around main nuclei without overlapping boundaries. |
The extent of DNA damage was monitored in the comet assays by treating the CFC with both the pesticides keeping individual control sets. The images are presented in Fig. 5 a-f. The values of average tail length and comet scores are tabulated in Table 3. It can be seen that in control sets there was no apparent DNA damage as intact nuclei were visualized both without any treatment and with DMSO solvent (controls). At LC50 concentrations, 0.32±0.015 and 0.22±0.010 µm length of comet tails was recorded respectively with carbofuran and malathion. At these strengths, the comet scores were only marginally higher than respective controls (115%). At higher concentrations (1.08 mM for carbofuran and 45 mM for malathion) much lengthier comet tails were recorded which accounted for 0.88±0.020 µm and 0.70±0.022 µm. Accordingly, the comet scores also went up (1.32- to 1.52 fold) relative to solvent controls. The maximum comet scores and tail lengths were in a range of values corresponding to those of the positive controls.
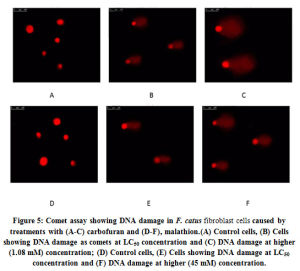 |
Figure 5: Comet assay showing DNA damage in F. catus fibroblast cells caused by treatments with (A-C) carbofuran and (D-F), malathion.(A) Control cells, (B) Cells showing DNA damage as comets at LC50 concentration and (C) DNA damage at higher (1.08 mM) concentration; (D) Control cells, (E) Cells showing DNA damage at LC50 concentration and (F) DNA damage at higher (45 mM) concentration. |
Table 3: Comet assay assessment of DNA damage (mean ± SD) of comet tail length (in µm) and visual examination of DNA damage classes (1-4) in CFC treated with carbofuran and malathion pesticides respectively for 24 h and 48 h.
|
Treatments (mM) |
Average tail length in
µm (Mean ± SD) |
Number of nuclei per comet class† and total scores (Mean ± SD) | ||||||||||||
|
Carbofuran |
Score |
Malathion |
Score |
|||||||||||
| Carbofuran | Malathion | Carbofuran | Malathion | 1† | 2 | 3 | 4 | 1† | 2 | 3 | 4 | |||
| Control (Untreated) | 0.01±0.010 | 0.01±0.010 | 63 | 37 | 0 | 0 | 137±2.50 | 64 | 36 | 0 | 0 | 136±2.50 | ||
| 0.045 | 5 | 0.05±0.020 | 0.02±0.020 | 62 | 37 | 1 | 0 | 139±5.03 | 60 | 39 | 1 | 0 | 141±2.51 | |
| 0.13 | 10 | 0.12±0.010* | 0.08±0.018* | 55 | 42 | 2 | 1 | 144±4.50 | 57 | 37 | 3 | 1 | 143±4.04 | |
| 0.27 | 15 | 0.20±0.015* | 0.10±0.022* | 52 | 45 | 2 | 1 | 152±2.51 | 55 | 40 | 3 | 1 | 148±3.60 | |
| 0.42 | 20 | 0.32±0.015* | 0.22±0.010* | 44 | 49 | 4 | 3 | 166±3.05# | 50 | 41 | 3 | 6 | 165±4.58# | |
| 0.54 | 25 | 0.45±0.015* | 0.28±0.010* | 46 | 41 | 8 | 5 | 172±5.77# | 48 | 42 | 5 | 5 | 167±3.05# | |
| 0.67 | 30 | 0.54±0.017* | 0.39±0.015* | 41 | 43 | 10 | 5 | 176±2.10# | 44 | 43 | 8 | 5 | 174±5.56# | |
| 0.81 | 35 | 0.66±0.019* | 0.47±0.028* | 40 | 44 | 6 | 9 | 188±5.29# | 40 | 46 | 7 | 6 | 177±3.21# | |
| 0.94 | 40 | 0.78±0.020* | 0.58±0.025* | 34 | 46 | 7 | 13 | 199±5.00# | 36 | 51 | 6 | 7 | 184±4.93# | |
| 1.08 | 45 | 0.88±0.020* | 0.70±0.022* | 31 | 37 | 16 | 17 | 221±3.51# | 41 | 36 | 15 | 8 | 190±5.50# | |
|
1 µM cyclophosphamide (positive control) |
0.98±0.010** |
24 |
33
|
23
|
20
|
236±2.00# |
||||||||
| 1% DMSO (negative control) | 0.02±0.020 | 58 | 40 | 2 | 0 | 144±4.61 | ||||||||
*p˂0.01, significant comet length difference when compared with the control (untreated) and negative control (cells treated with 1% DMSO)
**p˃0.05, non-significant difference when compared to pesticide-treated samples at higher concentrations
Values were highly significant compared to untreated control and negative control (1% DMSO) whereas the positive control showed a non-significant result when compared to samples treated with higher concentrations of both the pesticides.
† Refer Material and Methods and Supplementary Fig. 1 for description of the comet classes
# p˂0.01, significant difference in comet scores when compared with control (untreated) and negative control (cells treated with 1% DMSO)
Discussion
The present study was undertaken to evaluate the in vitro cytotoxicity and genotoxicity in cat fibroblasts. It was found that exposure of carbofuran and malathion, in a concentration-dependent manner, significantly reduced the viability of fibroblast cells (p <0.05). The calculated LC50 values of carbofuran and malathion were 0.42 mM and 20 mM, respectively. Previous studies on malathion in human liver carcinoma cells revealed an estimated LC50 of 15 mM6. More recently it was shown that genotoxic effects, e.g. comet tail, of malathion-treated human lymphocytes began to appear at concentrations much below the putative LC50 values19. Therefore, though the lethal doses of malathion for feline and human model cells are analogous, perhaps at chronic doses human cells are more prone to be adversely affected than CFC. There are also cell-specific differences with regard to carbofuran exposure. Our LC50 value with CFC was found to be ca. 20-times higher than human lymphocytes, which was recorded to be ≤18 µM.29 This vast difference in cell-specific cytotoxicity clearly indicates that, feline fibroblast cells seemingly are highly resistant to carbofuran. Therefore, use of lab based mammalian cell lines may not give accurate data that is applicable to feline species.
Genotoxicity assessment of carbofuran and malathion at the tested concentrations revealed that these pesticides could cause significant chromosomal aberrations in CFC in vitro. The extent of chromosome aberration increased upon increasing the doses of carbofuran and malathion. The mean values of both the toxicants clearly indicate that malathion exerted lesser degree of aberrations compare to carbofuran. Micronuclei frequency was much greater under malathion, though. At the moment the micronucleation seems to be the consequence of clastogenic effect of malathion and nucleation of broken chromosome, as also could be found with other OP compounds30. The LC50 concentrations of both the pesticides were able to cause significantly higher DNA damage relative to the untreated cells. As also could be inferred from alkaline comet images, there was double stranded DNA breaks which trailed as tails. Most of the investigations pointed out excess reactive oxygen species as the main cause of oxidative damage of DNA31.
Past investigation on the genotoxic and/or mutagenic and carcinogenic manifestations of malathion and some other OP pesticides under in vivo or in vitro conditions have led to controversial outcome9,19. In this regard, the present work should be evaluated under the guidelines set by Genotoxicity Expert Panel for another OP herbicide, glyphosate32. The evaluations recommended for such pesticides must consider “weights” of the genotoxicity assays. In this context, oxidative DNA, micronuclei in vitro, chromosomal aberration in vitro exhibit “moderate weights” whereas comet in vitro was placed under “low weight”. Consequently, the interpretations were not robust as several of the influenced physiological changes, viz. DNA damage, ROS production etc. were reversible and could have not been passed on to the next generation. Besides, the parameters were not examined in conjunction in a particular cell line. In this work, other than ROS, we examined all the “low to moderate weight” parameters and found these were dose-dependent. Hence, it can be undoubtedly said that malathion can promulgate genotoxic effect under in vitro state. Moreover, by following the same guidelines, it is reasonable to assume that the genotoxic effects of malathion are secondary to toxicity rather than it is target oriented (DNA alteration), because the applied doses were well in excess of the physiological limits set for testing genotoxicity. However, it is noteworthy to mention that malathion was shown to over-express oncogenes in human lymphocytes33 which could explain the carcinogenic attributes.
It is possible that malathion in conjunction with some other pesticide(s) could be toxic even at lower doses. It has been shown that combination of OP pesticides brings about synergistic effects on viability of human lymphocytes16. Pesticide mixing is a common practice in agriculture. Thus we propose that OP pesticides, if are mixed as a formulation, even at environmental chronic state of exposure can be harmful because of their synergistic effects and/or carcinogenic manifestation.
Conclusion
Carbofuran and malathion exert cytotoxic and genotoxic effects which may be the primary cause of impairment of cellular functions in skin fibroblast cells of domestic cat. Furthermore, the effect of malathion seems to be more of a secondary response brought out at unusually high dose. This study opens up new avenues for forecasting the environmental exposure and standardizing the dose of antidotes against OP pesticides in feline animals.
Acknowledgment
The authors wish to thank the Head, Department of Biological Science, Rani Durgavati University, Jabalpur, India, and the Director, Animal Biotechnology Centre, Department of Surgery, Nanaji Deshmukh Veterinary Science University, Jabalpur, India for providing lab facilities. We gratefully acknowledge the help of Aditya Kumar Kar, Senior Research Fellow, Indian Institute of Toxicological Research Lucknow, India in cytotoxicity evaluation and data interpretation. TRC thanks the University Grants Commission, New Delhi for providing a fellowship vide reference no. 3481/NET (June 2013).
Conflict of Interest
The authors declare there is no conflict of interest.
Funding Source
Our work was not funded by any funding source only st author TRC is getting fellowship from UGC -JRF (Refe. no. 3881/ NET-JUNE 2013)
References
- John EC, Pest toxicology. The primary mechanisms of pesticide action, in: R. Krieger (Ed.), Hayes’ Handbook of pesticide toxicology, third ed., Academic Press, New York.; 103-111 (2010).
CrossRef - Gerkowicz M, Wróblewska E, Turski W. The use of the radioisotope method in studies of pesticide penetration into the eyeball, Agric. Environ. Med.; 9: 29-31(2009).
CrossRef - Gupta RC. Carbofuran toxicity, Toxicol. Environ. Heal.; 43: 383–418 (1994). 10.1080/15287399409531931.
CrossRef - Kreutz LC, Barcellos LJG, Silva TO, Angiliero D, Martins D, Lorenson M, Marteninghe A, Silva LBD. Acute toxicity test of agricultural pesticides on silver catfish (Rhamdia quelen) fingerlings, Rural.; 38: 1050-1055 (2008). https://doi.org/10.1590/S0103-84782008000400022.
CrossRef - Kamel F, Boyes WK, Gladen BC, Rawland AS, Alavanja MCR, Blair A, Sandler DP. Retinal degeneration in licensed pesticide applicators, J. Ind. Med.;37: 618–628 (2000).
CrossRef - Moore PD, Yedjou CG, Tchounwou PB, Malathion-induced oxidative stress, cytotoxicity and genotoxicity in human liver carcinoma (HepG2) cells, Toxicol.; 25: 221–226 (2010). 10.1002/tox.20492.
CrossRef - Peter JV, Cherian AM. Organic insecticides, Intens. Care.; 28: 11–21 (2000). https://doi.org/10.1177/0310057X0002800102.
CrossRef - Pohanish Sittig’s Handbook of pesticides and agricultural chemicals, second ed., William Andrew Publishing, Elsevier B.V.; 2014.
CrossRef - Réus GZ, Valvassori SS, Nuernberg H, Commim CM, Stingari RB, Padilha PT, Leffa DD, Tavares P, Dagostim G, Paula MM, Andrade VM, Quevedo J. DNA damage after acute and chronic treatment with malathion in rats. Agric. Food Chem.; 56: 7560–7565 (2008). 10.1021/jf800910q.
CrossRef - Somnuek C, Boonphakdee C, Cheevaporn V, Tanaka K, Gene expression of acetylcholinesterase in hybrid catfish (Clarias gariepinus X Clarias macrocephalus) exposed to chlorpyrifos and carbaryl. Environ. Biol.; 30: 83-88 (2009).
CrossRef - Karczmar A. Anticholinesterases: dramatic aspects of their use and misuse. Int.; 32: 401-411 (1998). https://doi.org/10.1016/s0197-0186(97)00123-x.
CrossRef - Zeljezic D, Vrdoliak AL, Kopiar N, Radic B, Milkovic KS. Cholinesterase-inhibiting and genotoxic effects of acute carbofuran intoxication in man: A case report. Basic Clin. Pharmacol. Toxicol.; 103: 329–335 (2008). https://doi.org/10.1111/j.1742-7843.2008.00294.x.
CrossRef - Bonner MR, Coble J, Blair A, Freeman LEB, Hoppin JA, Sandler DP, Alavanja MC. Malathion exposure and the incidence of cancer in the agricultural health study. J. Epidemiol.; 166: 1023–1034 (2007). 10.1093/aje/kwm182.
CrossRef - Maurya PK, Malik DS, Sharma A. Impacts of pesticide application on aquatic environments and fish diversity, in: Kumar V, Kumar R, Singh J, Kumar P. (Eds.). Contaminants in agriculture and environment: Health risks and remediation. Agro Environ Media, Publication Cell Agriculture and Environmental Science Academy, Haridwar.; 111-128 (2019).
CrossRef - Hreljac I, Zajc I, Lah TT, Filipic M. Effects of model organophosphorus pesticides on DNA damage and proliferation of HepG2 cells. Mol. Mutagen.; 49: 360-367 (2008). 10.1002/em.20392.
CrossRef - Shaik AS, Shaik AP, Jamil K, Alsaeed AH. Evaluation of cytotoxicity and genotoxicity of pesticide mixtures on lymphocytes. Mech. Method.; 2016. http://dx.doi.org/10.1080/15376516.2016.1218577.
CrossRef - Sharma RK, Rai DK, Sharma B. In-vitro carbofuran induced micronucleus formation in human blood lymphocytes. Mol. Biol.; 58: 128–133 (2012).
CrossRef - Soloneski S, Reigosa MA, Molinari G, Norma VG, Larramendy ML. Genotoxic and cytotoxic effects of carbofuran and furadan on Chinese hamster ovary (CHOK1) cells. Res.; 656: 68-73 (2008).10.1016/j.mrgentox.2008.07.007.
CrossRef - Olakkaran S, Purayil AK, Antony A, Mallikarjunaiah S, Puttaswamygowda GH. Oxidative stress-mediated genotoxicity of malathion in human lymphocytes. Res. Gen. Tox. En.; 849: 503138 (2020). https://doi.org/10.1016/j.mrgentox.2020.503138.
CrossRef - Kwiatkowska M, Hoppe S, Pomianowski A, Tipold A. Reactive seizures in cats: A retrospective study of 64 cases. J.; 244: 1–6 (2019). 10.1016/j.tvjl.2018.11.009.
CrossRef - Freshney RI. Culture of animal cells: A manual of basic techniques, fifth ed., John Wiley & Sons, Inc., Hoboken.;
CrossRef - Prabhavathy DG, Pasha SA, Jamil K. Cytotoxicity and genotoxicity induced by the pesticide profenofos on cultured human peripheral blood lymphocytes. Drug Chem. Toxicol.; 29: 313-322 (2006). https://doi.org/10.1080/01480540600653093.
CrossRef - Feoktistova M, Geserick P, Leverkus M. Crystal violet assay for determining viability of cultured cells. Cold Spring Harb. Protoc., 10.1101/pdb.prot087379.
CrossRef - Ram T, Rahangdale S, Singh RR, Singh AP, Kumar D, Jadhav K, Sarkhel BC, Bagchi SN. Standard operating procedure of chromosomal identification for domestic animals. Bhartiya Krishi Anusandhan Patrika.; 32: 295-299 (2017).
CrossRef - Dhawan A, Bajpayee M, Parmar D. Comet assay: a reliable tool for the assessment of DNA damage in different models. Cell Biol. Toxicol.; 25: 5-32 (2009). 1007/s10565-008-9072-z.
CrossRef - Driessens N, Versteyhe S, Ghaddhab C, Burniat A, Deken XD, Sande JV, Dumont JE, Miot F, Corvilain B. Hydrogen peroxide induces DNA single- and double-strand breaks in thyroid cells and is therefore a potential mutagen for this organ. Relat. Cancer.; 16: 845-856 (2009). 10.1677/ERC-09-0020.
CrossRef - Artun FT, Karagoz A, Ozcan G, Melikoglu G, Anil S, Kultur S, Sutlupinar N. In vitro anticancer and cytotoxic activities of some plant extracts on HeLa and Vero cell lines. JBUON.; 21(3): 720-725 (2016).
CrossRef - Pandey MR, Guo H. Evaluation of cytotoxicity, genotoxicity and embryotoxicity of insecticide propoxur using flounder gill (FG) cells and zebrafish embryos. Toxicology in Vitro.; 28: 340-353 (2014).
CrossRef - Naravaneni R, Jamil K. Cytogenetic biomarkers of carbofuran toxicity utilizing human lymphocytes cultures in vitro. Drug Chem. Toxicol.; 28: 359-372 (2005). 1081/dct-200064508.
CrossRef - Palanikumar L, Kumaraguru AK, Muthiah RC, Anand M. Toxicity, biochemical and clastogenic response of chlorpyrifos and carbendazim in milkfish Chanos chanos. J. Environ. Sci. Tech.; 11: 765-774 (2014). 10.1007/s13762-013-0264-6.
CrossRef - Ojha A, Gupta YK. Evaluation of genotoxic potential of commonly used organophosphate pesticides in peripheral blood lymphocytes of rats. Exp. Toxicol.; 34: 390-400 (2015). 10.1177/0960327114537534.
CrossRef - Brusick D, Aardema M, Kier L, Kirkland D, Williams G. Genotoxicity Expert Panel review: weight of evidence evaluation of the genotoxicity of glyphosate, glyphosate-based formulations, and aminomethylphosphonic acid, Crit. Toxicol.; 46: 56–74 (2016). 10.1080/10408444.2016.1214680.
CrossRef - Anjitha R, Antony A, Shilpa O, Anupama KP, Mallikarjunaiah S, Gurushankara HP. Malathion induced cancer-linked gene expression in human lymphocytes. Res.; 2020. https://doi.org/10.1016/j.envres.2020.109131.
CrossRef

