
Manuscript accepted on :11-08-20
Published online on: 02-09-2020
Plagiarism Check: Yes
Reviewed by: Swastika Maity
Second Review by: Feng Xue
Final Approval by: Prof. Dr. Ziyad S. Haidar
P. Sridharan, C. PonSelvi and M. Bobby
Department of Biomedical Engineering, Rajalakshmi Engineering College, Chennai, India, 602105
Corresponding Author E-mail : sridharan89@hotmail.com
DOI : https://dx.doi.org/10.13005/bpj/2009
Abstract
Respiratory illness is a pathological condition targeting the lung cavity affecting the exchanging of gases resulting in difficulty in breathing cycle .Respiratory physiology is one mainstream that needs a lot of research not just in the anatomical aspect but also on geometrical parameters as well, which gives a deeper insight into the efficiency and effectiveness of drug delivery. Complexity involved with the respiratory passage is quite high, making it difficult to carry out an in depth analysis regarding the flow patterns in humans. In this study, we have generated a subject-specific airway model mimicking the structure of an anatomical lung extending into the bronchioles to study the effectiveness of drug delivery using the nebulizer for healthy and edematic subject. Significant drug delivery to the edematic zones can result in effective treatment and faster recovery, reducing the possibility of tissue damage. Understanding respiratory geometry give us deep awareness on the internal cavity that can aid in effective diagnosis and can shed light on fruitful drug delivery. Constructing model of edematic subjects tracheal and bronchus geometry, taking internal obstruction into consideration and designing patient-specific nebulizer will have an effective drug delivery resulting in increased healing of the edema at the terminal ends of the bronchioles, paving the way to faster recovery. Respiratory flow patterns are verified for normal and edematous conditions showing pronounced differences in end pressure and velocity values due to the obstruction in the flow passage due to the presence of watery fluid.
Keywords
Edema; Flow Dynamics; Pressure; Velocity
Download this article as:| Copy the following to cite this article: Sridharan P, PonSelvi C, Bobby M. Flow Field Analysis of Tracheal Bronchial Airway Passage Flow Field for Effective Drug Delivery. Biomed Pharmacol J 2020;13(3). |
| Copy the following to cite this URL: Sridharan P, PonSelvi C, Bobby M. Flow Field Analysis of Tracheal Bronchial Airway Passage Flow Field for Effective Drug Delivery. Biomed Pharmacol J 2020;13(3). Available from: https://bit.ly/3hVlYkD |
Introduction
The lungs are the largest organ responsible for exchanging gases in the body and have been constantly exposed to harsh environmental conditions. This has made lung tissues more vulnerable to enormous amounts of toxic substances and a large number of environmental viruses and bacteria. Forum of International Respiratory Society (FIRS), United States statistics indicates that respiratory-related diseases play a vital role in suppressing the immune system of an individual making them more susceptible to chronic obstructive pulmonary disorders.1 Inhalation of toxic gases from the environment and smoking of tobacco has resulted in the enlargement of bronchioles resulting in airflow pattern variations leading to extreme respiratory illness. Inhalation and exhalation cycle involve a large amount of resistance offered by the larger airway paths like larynx, tracheal passage and smaller airways paths such as alveoli in the lungs. Any pathological changes in these airway patterns bring about limitations in the breathing cycle.2 Any inflammation in the smaller or larger processes will result in disease development. Due to restriction in spatial and temporal resolutions, the study of terminal lung features has been very challenging. Generating patient-specific models by taking data from the clinical images can aid better understandings in understanding respiratory models.3 Numerical simulations results have given a better understanding of reading the airflow patterns of the airway pathway.4 Simulation results give us a deeper insight into the airway dynamics5 and give us in-depth knowledge on the intra thoracic and extra thoracic airway and the obstructions in it. The structural features of the tracheal bronchus passage have been reconstructed using Computational Fluid Dynamic (CFD) where the simulations pattern different features for Tuberculosis (TB) patients highlighting unique values for velocity, pressure and stress patterns.6 With the presence of any edematous conditions or lung obstructions, the airflow pattern inside the lungs is greatly affected, reducing the content of oxygen to be delivered to end nodules inside the lung cavity.
Multiple numerical studies have been worked out on the modeling of the tracheal and bronchial airway passage have shown some good outcomes on the level of pressure variations through the cavity but still there exists a complex nature while performing these lung cavity pressure estimations. Similar models have been created for the animal from nose to the pulmonary cavity and have shown promising results.
Computational fluid dynamics (CFD) in an effective tool in studying the flow of air and fluids in biological environment to get effective information about flow dynamics. Simulation is an effective method to give information about the respiratory functionalities and can give us a deep insight into the airway structures and functionalities Since it gives us an extensive data about the movement of air inside the thoracic cavity.6, 7 Subject-specific lung models have been created with specific boundary conditions to create subject-specific tracheobronchial tree models by extracting the parameters from CT images and then simulating it using CFD simulations software give depth information about the velocity and pressure exerted internally, since monitoring both these parameters can give us an in depth knowledge on the behavior of the thoracic cavity.8, 9 Using CFD simulations methods we can understand and study various lung ailments such as such as asthma, chronic obstructive pulmonary disease COPD, infections like influenza, pneumonia and tuberculosis to assist clinical trials and treatments. Extensive studies have been used for extracting details about chronic pulmonary disorders and asthma.10 Most recent works have been focused on predicting the concentrations of the antibiotics and various steroids used for treating the ailment, inhaled for treating cystic fibrosis patients.11
This paper focuses on exploring the airway dynamics of the respiratory airway tracheal bronchus passage by building a realistic airway model extending from the trachea towards the bronchus region, applying all boundary conditions to mimic the conditions of an exact human lung and studying and analyzing the pressure, velocity parameters under normal and edematous conditions and analyze the extent of the drug delivered through a nebulizer till the lower connecting airways of the lung cavity. Detailed patterns give us a deeper insight into the pressure required for delivering the drug at the end nodules.
Modeling of Tracheal Cavity
Edema is a medical condition where there will be swelling in the thoracic cavity thereby making it harder for the affected person to have a normal inhalation and exhalation cycle. To study and analyze the effect of this condition, we have designed the tracheal bronchus model starting from the trachea till the bifurcating bronchus and analyzed with the ANSYS software(https://www.ansys.com/en-in) .This analysis software is used for computing and deriving the flow parameters and characteristics during edematous and non-edematous conditions as shown in Figure 1 and Figure 2. In this work, we have modeled the tracheal cavity for monitoring pressure and velocity gradients for edematous and non-edematous conditions and observing the pressure and velocity changes for the same. The developed model of the tracheal cavity is created using standard anatomical values to match the dimensional data. Mathematical models and physical conditions are applied during the experimental setup of this work.
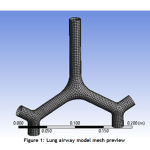 |
Figure 1: Lung airway model mesh preview |
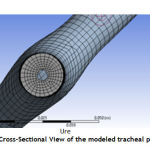 |
Figure 2: Cross-Sectional View of the modeled tracheal passage |
To bring about differences in developed models for the presence of edematous and non-edematous conditions, the developed model internal cavity is generated with swollen areas to mimic an edematous condition. Figure 3 depicts the development of swollen areas to set an edematous condition for the flow study. Grid or mesh generation, fluid properties, governing equations, boundary conditions, solver setup and the computational method for solution are the general algorithm of applying CFD. The meshed geometry is then analyzed to study flow properties.
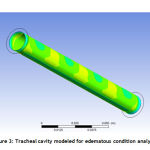 |
Figure 3: Tracheal cavity modeled for edematous condition analysis |
Pressure and Velocity Contour Results
In this current research work, the bronchial passage with the tracheal model that includes all the anatomical characteristics were extracted and reconstructed to mimic the characteristics of a respiratory cavity. The developed model is analyzed for pressure and velocity variations in edematous and non-edematous conditions. Thus, the pressure values of arterial end of pulmonary capillary; alveoli, venous end of pulmonary capillary and tissue are implied to the generated model to check these pressure and velocity variations. Inlet pressure is set with regular standards of a nebulizer to match the exact thoracic behavior for patients who are constantly exposed to its usage. For every case, the specific pressure value of 101325 Pa and velocity values of 2.5m/s are set and the flow pattern is generated for the above-specified pressure value.
Subject 1: Pressure and Velocity Analysis
The flow analysis obtained here in Figure 4 denotes pressure value obtained indicates an obstruction in the flow.
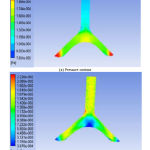 |
Figure 4: Pressure and velocity contour with edematous conditions for subject 1 |
The pressure contour’s starting input pressure is kept at 101325 Pa. The dark blue color denotes the change in the pressure due to obstruction, the green color denotes the gradual increase in the pressure values and finally, the red color denotes the end pressure value is about 91640 Pa. The pressure as shown in figure 1.a at the blocked region is bringing about a drop in pressure of 9685 Pa, thereby obstructing the flow of air into the thoracic cavity making the bronchioles devoid of oxygen content. The velocity contour’s as shown in figure1.b starting velocity is kept at 2.5m/s and the flow starts at this velocity and it is denoted in yellow. The obstruction causes a reduction in velocity and is generated in red color and at the end drops the velocity value to 2.2m/s generated in blue color. The velocity at the blocked region is affected by a value of 0.3m/s.
Subject 2: Pressure and Velocity Analysis
Figure 5.a.represents the response shown by the second subject, pressure contour’s starting input pressure is 101325 Pa and the flow starts at this pressure and it is generated in blue color. The dark blue color denotes the change in the pressure due to obstruction that is created on the passage due to edematous condition, the green color denotes the gradual increase in the pressure values and finally, the yellow color denotes the end pressure value as it is about 87525 Pa.
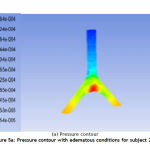 |
Figure 5a: Pressure contour with edematous conditions for subject 2 |
The pressure at the blocked region has created a pressure reduction of 13800 Pa. The velocity contour’s as shown in figure 5.b starting velocity is 2.5m/s and the flow starts at this velocity and it is denoted in yellow. The obstruction causes a reduction in velocity and is generated in red color whereas the end velocity value is 2.15 m/s. The velocity at the blocked region has reduced the velocity by a value of 0.75 m/s.
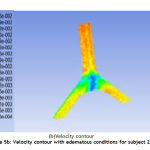 |
Figure 5b: Velocity contour with edematous conditions for subject 2 |
Subject 3: Pressure and Velocity Analysis
Normal pressure value at which air is taken inside the thoracic cavity is at 101325 Pa and a velocity value of 2.5m/s for normal subjects. The result shown in figure 6.a here denotes variations in pressure value indicating that there is an obstruction in the flow. The pressure contour’s starting input pressure is 101325 Pa and the flow starts at this pressure. The green color denotes the change in the pressure due to obstruction, the green color denotes the gradual decrease in the pressure values and finally, the red color denotes the end pressure value which almost tends to increase closing at a value of 86735 Pa. The pressure has decreased due to the blocked edematous condition by a value of the region is 14590 Pa. The velocity contour’s as shown in figure 6.b starting at 2. 5 m/s, the flow starts at this velocity and it is denoted in yellow. The obstruction causes a reduction in velocity and is generated in red color whereas the end velocity value decreases to almost 1.97 m/s and it is generated in blue color. The velocity at the blocked region as shown in fig.6.b has produced a reduction of 0.78 m/s.
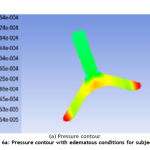 |
Figure 6a: Pressure contour with edematous conditions for subject 3 |
Nebulizer: Pressure and Velocity Analysis
The table 1 listed above indicates the list of pressure and velocity values for various subjects under edematic conditions, indicating pronounced difference in the end pressure velocity values after simulation , the significant pressure differences of various subjects along with the nebulizer pressure is shown in figure 7 and the velocity contours of various subjects and the
nebulizer velocity as shown in figure 8 show the response of edematous subjects , where the highest peak value indicates on both the graphs indicate the minimum pressure and velocity required for end delivery.
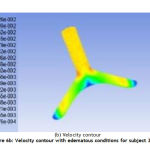 |
Figure 6b: Velocity contour with edematous conditions for subject 3 |
Table 1: Pressure and Velocity values obtained for edematous condition
| Parameters/Subjects | Pressure
(Pa) |
Velocity
(m/s) |
| Subject 1 | 91640 | 2.2 |
| Subject 2 | 87525 | 2.15 |
| Subject 3 | 86735 | 1.97 |
| Subject 4 | 97632 | 2.02 |
| Subject 5 | 99676 | 1.94 |
| Subject 6 | 89679 | 1.89 |
| Subject 7 | 100781 | 2.23 |
| Subject 8 | 100107 | 2.14 |
| Subject 9 | 99691 | 2.07 |
| Subject 10 | 89795 | 1.86 |
| Subject 11 | 99611 | 2.11 |
| Subject 12 (Nebulizer) | 102278 | 2.5 |
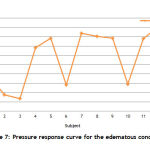 |
Figure 7: Pressure response curve for the edematous condition |
To deliver drugs to the tracheal bronchial nodes, the necessary end pressure and velocity needs to be maintained at a higher rate than the derived value generated by creating the subject specific models for edematous condition so that the drug reaches the tracheal bronchial end nodes and the entire edematous condition starting from the initial to the terminal end can be exposed to the drug. The operating pressure and velocity contour derived for the nebulizer for effective drug delivery for edematous conditions derived is shown in figure 9.a and figure 9.b.
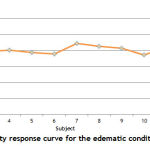 |
Figure 8: Velocity response curve for the edematic condition |
In this case, the nebulizer pressure value as shown in figure 9.a needs to be greater than the pressure responses recorded above to overcome the edematous conditions on the tracheal passage, pressure value of 102278 Pa delivers drugs to the end nodules for the edematous subjects derived above. The change in pressure is similarly observed on the above experiments and the end pressure monitored is 102278 Pa for an input pressure value of 103000 Pa and the response almost stays closer to blue color stating that if the nebulizer pressure when set as per patient need can deliver drug without much change in pressure values. This pressure is sufficient enough to deliver the drug to the affected end nodules. The velocity contour’s as shown in figure 9.b starting velocity was set at 2.7 m/s and the flow starts at this velocity and it is denoted in yellow. End velocity at the terminal ends was recorded at 2.5 m/s which are sufficient enough for carrying the drug across the edematous zones.
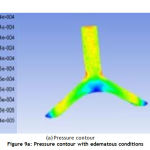 |
Figure 9a: Pressure contour with edematous conditions |
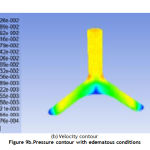 |
Figure 9b.Pressure contour with edematous conditions |
Conclusion
The velocity and pressure contour flow for the created models for various subjects and nebulizer were checked on different edematous conditions and the variations in pressure and velocity parameters were derived using computational flow dynamics, indicate significant differences in pressure and velocity due to the development of edematous condition. The pressure and velocity are inversely proportional, so we have lower pressure at the exit. As per definition of pressure, P=F/A, i.e., pressure is inversely proportional. In the current analysis, the relative size of the edema has a larger effect on velocity and pressure features and the dimension of the edema can be found using Finite Element Analysis were also taken into condition while simulating the pressure and velocity parameters. The extent of variation of these parameters in the inlet and the outlet zones show variation clearly indicating the role of edema on the airflow patterns across the tracheal bronchial passage. The aerosol is sent via the tracheal bronchial cavity to the lungs to treat edematous patients by the nebulizer. This aerosol is sent at a specific fixed pressure by the nebulizer and simulation results indicate that if drug is delivered at suitable pressure edematic condition can treated effectively resulting in faster recovery. When the patient has edema, it is hard for the aerosol to reach the last alveoli if it is delivered on a standard pressure input. Thus, the performance of the drug decreases and the time taken for the edematous condition to get cured increases proportionately. The performed analyses are done by setting various pressure and velocity and the flow is checked for each change of these parameters. Finally, the pressure and velocity which is apt for delivering the drug effect is selected and is set to aid the effective delivering of the drug. Thus, the prescribed number of nebulizer cycles can be reduced thereby increasing the effective curing capacity of the drug at the endpoints. Our future work focuses on taking into considerations the left and right bronchial nodes into consideration which can lead to treating of blocks inside the alveoli cavity as well by studying the flow patterns and setting the input pressure for effective treatments of patients.
Reference
- Barnes, Francesco Blasi, Brian Ward, Elin Reeves and Klaus F. Rabe, ”Respiratory diseases in the world: one voice ‘‘united for lung health’ “, Eur Respir J 2014;Vol 43,pg no: 3–5,Nov 2019.
CrossRef - James C. Hogg, Peter D. Paré, and Tillie-Louise Hackett “The Contribution Of Small Airway Obstruction To The Pathogenesis Of Chronic Obstructive Pulmonary Disease” doi:10.1152/physrev.00025.2015 ,pg no 529–552, Feb 1, 2017.
CrossRef - Jingliang Dong, Jiawei Ma, Yidan Shang, Kiao Inthavong, Dasheng Qiu, Jiyuan Tu and Dennis Frank-Ito, “Detailed nanoparticle exposure analysis among human nasal cavities with distinct vestibule phenotypes” , Journal of Aerosol Science,Volume 121,pg no:54-65,May 2018.
CrossRef - Jingliang Dong,Yidan Shang,Kiao Inthavong,Jiyuan Tu, Rui Chen,Ru Bai, Dongliang Wang and Chunying Chen, “Comparative Numerical Modeling of Inhaled Nanoparticle Deposition in Human and Rat Nasal Cavities” , Toxicological Sciences, Vol.152 No2, pg no:284–296, 2016.
CrossRef - Kiao Inthavong , Kai Zhang & Jiyuan Tu , “Numerical modelling of nanoparticle deposition in the nasal cavity and the tracheobronchial airway ”, Computer Methods in Biomechanics and Biomedical Engineering Vol. 14, No. 7, pg no:633–643, July 2011.
CrossRef - Burrowes, K.S., De Backer, J., Smallwood, R., Sterk, P.J, Gut, I., Wirix-Speetjens, R., Siddiqui, S., Owers-Bradley, J., Wild, J., Maier, D., and Brightling, “Multi-scale computational models of the airways to unravel the pathophysiological mechanisms in asthma and chronic obstructive pulmonary disease (AirPROM)”, Interface Focus. 3(2):20120057, 2013.
CrossRef - Kleinstreuer,C.,andZhang,Z.,”Airflow and particle transport in the human respiratory system” Annual Review of Fluid Mechanics, Vol. 42,pg no:301-334 , Jan 2010.
CrossRef - Lin, C.L., Tawhai, M.H., Mclennan, G., and Hoffman, E.A., “Multiscale simulation of gas flow in subject-specific models of the human lung”, IEEE Eng. Med. Biol. Vol no:28(3),pg no :25–33,2009.
CrossRef - DeBacker,J.W.,Vos,W.G.,Gorlé,C.D.,” Flow analyses in the lower airways: Patient-specific model and boundary conditions”. Med. Eng. Phys., Vol no:30(7):872, 2008.
CrossRef - De Backer JW, Vos WG, Vinchurkar SC, Claes R, Drollmann A, Wulfrank D, Parizel PM, Germonpre P, De Backer W,” Validation of computational fluid dynamics in CT-based airway models with SPECT/CT” Radiol Vol no 257(3),pg no:854–862,2010.
CrossRef - Bos,A.C.,vanHolsbeke, C., deBacker, J.W., van Westreenen,M., Janssens, H.M., Vos, W.G., “Patient-specific modeling of regional antibiotic concentration levels in airways of patients with cystic fibrosis: Are we dosing high enough? “, PLOS ONE | DOI:10.1371/journal.pone.0118454,pgno1-20,March,2015.
CrossRef

