
Manuscript accepted on :28-04-2020
Published online on: 13-05-2020
Plagiarism Check: Yes
Reviewed by: Vikrant Rai
Second Review by: Ankur Singh Bist
Final Approval by: Dr. Najam A Siddiqi
Suha Abed1, Akeel Assie1, Khaled Abu-Elteen2, Batol Dheeb3* and Luay Abu-Qatouseh4
1Department of Biology, College of Science, Tikrit University, Salaheldin, Iraq
2Department of Biology and Biotechnology, Faculty of Science, Hashemite University, Jordan
3Department of Pathological Analysis, College of Applied Science, Samarra University, Iraq
4Faculty of Pharmacy, Department of Biomedical Sciences, University of Petra, Jordan
Corresponding Author E-mail : batoolomran@yahoo.com
DOI : https://dx.doi.org/10.13005/bpj/1939
Abstract
The present study is conducted to investigatethe relatedness and genomic variability between strains of methicillin-resistant and methicillin-susceptible Staphylococcus aureus.A total of 100 isolatescollected from different human skin infection and used a combination of morphological and molecular techniques to identify ten of these as Methicillin-susceptible S. aureus (MSSA), and ten as Methicillin-resistant S. aureus (MRSA). The MRSA and MSSA samples were subjected to genetic characterization with the use of the Random Amplificationof Polymorphic DNA technique (RAPD) using 10 primers.The DNA profile of the samples wereobtained and showed that the number of the bands and banding patterns varied depending upon the primers used. A two-dimensional binary matrix was constructed through scoring the presence or absence of a band at any position on the gel. A total of 142 bands were generated per the 10 primers, of which 141 ranged between 3100-100 bp. Primers OPJ-13 and OPE-16 exhibited the largest number of bands (20) with a 100% polymorphism and the greatest discriminatory index power (DI, 14.1), while primer OPI- 06 produced the lowest number of bandsand a comparably lower level of discrimination (DI, 7.09).Data in this study demonstrate the ability of the RAPD analysis to differentiate between strains at the intraspecies level. Data also suggest that this technique can be applied successfully to assess the genetic backgrounds among isolates.
Keywords
Methicillin-Resistant; Methicillin-Susceptible; Random Amplification of Polymorphic DNA; Staphylococcus Aureus
Download this article as:| Copy the following to cite this article: Abed S, Assie A, Abu-Elteen K, Dheeb B, Abu-Qatouseh L. Molecular Characterization of Methicillin-Resistant and Methicillin- Susceptible Staphylococcus aureus Isolates Obtained from Human-Skin Samples in Iraq. Biomed Pharmacol J 2020;13(2). |
| Copy the following to cite this URL: Abed S, Assie A, Abu-Elteen K, Dheeb B, Abu-Qatouseh L. Molecular Characterization of Methicillin-Resistant and Methicillin- Susceptible Staphylococcus aureus Isolates Obtained from Human-Skin Samples in Iraq. Biomed Pharmacol J 2020;13(2). Available from: https://bit.ly/2zuWuJB |
Introduction
Staphylococci are ubiquitous, including a dozen species occurring as part of the normal flora. The most virulent species is Staphylococcus aureus, which colonizes epithelial surfaces and causes infections in humans. Historically, Methicillin has been the treatment of choice for the S. aureus infections, but resistance is now widespread. It is believed that this resistance is related to the mec Agenes, which are carried on mobile genetic elements, and can confer resistance to most beta-lactam antibiotics and other antimicrobial classes [1,2, 3, 4]. All staphylococcal genomes are approximately 2.8 Mbp in size, and are, thus predicted to encode 2500 genes with relatively low G-C content. The comparative analysis has revealed that most regions of the genome are well-conserved; however, several large sequence blocks showed high variability.
Lindsay and Holden first posited the concept of the ‘core’; the part of the genome that is present in all strains of S. aureus, in contrast to the “accessory genome” which is variable [5,6]. The core contains housekeeping genes and many virulence genes. Its genetic plasticity facilitates the evolution of many virulent and drug-resistant strains, presenting a major clinical challenge (Holden et al., 2004). Most of the dissimilarity among the species of the strains is due to mobile genetic elements, such as bacteriophages or pathogenicity islands [7, 8, 9].
Gene transfer amongthe S. aureus strains is certainly much higher than among different staphylococcal species [10].
The RAPD technique makesthe study of a large proportion of target genomes possible by generating distinct banding patterns that allow for finer discrimination among the strains [11, 12]. It amplifies segments of target DNA using small arbitrary primers of unknown homology with a target sequence.
The number and size of the fragments generated during PCR are the basis for typing an isolate [13, 14, 15]. This work seeks to apply RAPD-PCR extensively to determine the relatedness and genomic variability of a collection of methicillin-susceptible (MSSA) and methicillin-resistant (MRSA) S. aureusstrains, and thus analyse their diversity.
Materials and Methods
Isolation of Bacterial Strains and Molecular Detection using the Polymerase Chain Reaction (PCR)
The study included 100 local isolates of Staphyloccoci spp. collected from different clinical skin infections in unrelated patients. All isolates were grown at 37 °C on a mannitol salt agar (MSA) medium and were identified at the species level using their morphological characteristics and biochemical tests [16]. For the molecular determination, the MRSA and MSSA genomic DNA was extracted from the staphylococcal cultures via a heat shock/boiled-cell method that involved boiling and freeze-thawing processes as described elsewhere [17, 18, 19]. The application of the RAPD technique was preceded by the extraction of genomic DNA using the boiling method. The mecA gene was amplified to identify the MRSA strains without the need to check for antibiotic susceptibility, as discussed by Tang and Stratton, who suggested that the specificity of MRSA identification is based on the quantitative correlation of the mecA gene; this gene encodes the protein PBP2A (penicillin binding protein 2A), which has a low affinity for beta-lactam antibiotics such as methicillin). Therefore, this assay allows for a reliable identification within only six hours of sample collection.
The application of the RAPD technique was preceded by the extraction of genomic DNA using the boiling method. The mecA gene was amplified to identify the MRSA strains without the need to check for antibiotic susceptibility, as discussed by Tang and Stratton, who suggested that the specificity of MRSA identification is based on the quantitative correlation of the mecA gene; this gene encodes the protein PBP2A (penicillin binding protein 2A), which has a low affinity for beta-lactam antibiotics such as methicillin). Therefore, this assay allows for a reliable identification within only six hours of sample collection.
The purity of the extracted DNA was checked in a NanoDrop (Thermo Scientific) at the wavelengths of A260 and A280. A specificmecA -PCR primers with anamplicon size of 533bp was subjected to forward (mecA: F 5′- AAAATCGATGGTAAAGGTTGGCAG-3′) and reverse (mecA: R 5′- AGTTCTGCAGTACCGGATTTGC-3′) supplied by Integrated DNA Technologies company, Canada . The amplification program was one cycle at 94 °C for one minute; thirty-five cycles of 94 °C for one minute, 63 °C for one minute, 72 °C for one minute and 72 °C for ten minutes, using the Mastercycler (Eppendorf). The amplified product was subjected to 2% agarose gel electrophoresis and was visualized under UV (Imagemaster VDS, Pharmacia Biotech, USA) after being stained with Ethidium bromide [20]. Only twenty samples were subjected to the RAPD assay after being molecularly detected as either methicillin-resistant and methicillin-sensitive strains (ten samples were mec negative=MSSA and ten were mec positive= MRSA) [21].
Random Amplified Polymorphic DNA: Reaction Mix, Program, and Detection
All isolates from samples in this research were subjected to identification at the species level using their morphological characteristics and biochemical tests; all isolates were confirmed as S. aureus. The processes of DNA amplification were performed using the mecA gene to detect the Methicillin-resistant strains.The RAPD assay was conducted twice under the same conditions to confirm the reproducibility of the method and to eliminate sporadic amplification products from the analysis.
The RAPD primers used in the studywere as follows: OPI – 06: (5’– AAGGCGGCAG-3’), OPJ-13: (5’-CCACACTACC-3’), OPE-16: (5’– GGTGACTGTT-3’), OPQ-01: (5’-GGGACGATGG-3’), OPM-20: (5’– AGGTCTTGGG-3’), OPN-07: (5’-CAGCCCAGAG-3’), OPQ-17: (5’– GAAGCCCTTG-3’), OPD-20: (5’-ACCCGGTCAC-3’), OPB-14: (5’– TCCGCTCTGG-3’), and OPA-11: (5’-ACCCGACCTG-3’) (Primer set supplied by OPT (Operon DNA Technologies Company, Canada). The reaction was conducted in a 25 μl reaction mixture containing 2 μl of DNA (50 ng), 12.5 μlGoTaq 0T® Green Master (Promega, CA), (0.5 μl) 25 mM MgCl2, 2 μl of (10 Pmol\ μl) of each primer, 2 μl of deionized and distilled water.The PCR amplifications were performed in a Labnet Thermal Cycler with the following specification: first,a denaturation cycle at 94 ºC for five minutes; forty-five cycles (segment denaturation 94 ºC for forty-five seconds; annealing 40 ºC for one minute; extension 72 ºC for forty-five seconds), and then a final extension comprised of one cycle at 72 ºC for seven minutes according to Kumar and Gurusubramanian [22, 23, 24].
The amplified products were analysed by electrophoresis in a 1.5% (w/v) agarose gel and were visualized under UV (Imagemaster VDS, Pharmacia Biotech, USA) after being stained with ethidium bromide (Kumari and Thakur, 2014). A DNA ladder (250 bp) purchased from BIONEER Co. was used to assess the size of the PCR product, which was, then, photographed using a gel documentation system.
Statistical Efficiency Discrimination
RAPD fragments were scored as (0, 1) where 1 means presence and 0 denotes the absence of a band at a specific position in the gel. The binary patterns obtained were directly compared for their similarities using the NTSYS-pc Numerical Taxonomy and Multivariate Analysis System (version 2.1, Exeter Software) as described by Kosman and Leonard [25, 26]. The data collected were analysed, and only the major bands that were consistently amplified were recorded. The polymorphism of each primer was calculated based on the following equation:
Polymorphism% = (Np/Nt) ×100
Where Nprefers to the number of the polymorphic bands, and Nt reflects the total number of bands of the same primer [27]. The efficiency and discriminatory powers of each primer were calculated. Primer efficiency was calculated as the number of polymorphic bands to the total number of primer bands. The discriminatory power of each primer was calculated as the percentage of the number of polymorphic bands to all of the primers [28, 29].
Genetic Distance and Relationship Estimation
Phylogenetic analysis and pairwise alignment similarities were calculated via the neighbour-joining method. The genetic distances among all pairs were calculated based on Nei and Li’s similarity indices (Nei and Li, 1979) according to the following formula:
G.D= 1-{2Nab/(Na+Nb}
Where Na is the total number of the fragments observed in individual ‘a’; Nbisthe total number of fragments ‘b’ and Nab is the number of fragments shared by both individuals. Genetic relationship tree diagrams were developed to illustrate the relationships among the studied strains. The similarity was calculated based on the following formula [30, 31]
Similarity = 1- G.D× 100%
Results
The results were analysed using band notes obtained from the PIC of primers,as illustrated in Figure 2,which included the presence or absence of bands, together with their molecular weights that were produced by a primer across the twenty samples starting from the highest to lowest weight, as well as the total number of the amplified bands across all isolates. The bands obtained had a pattern similar to a bar code, allowing for the identification of each individual. In total, 142 bands were generated per the ten primers, of which 141 ranged between 3100 and 100 bp.
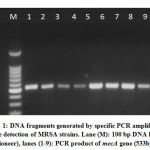 |
Figure 1: DNA fragments generated by specific PCR amplification for the detection of MRSA strains. |
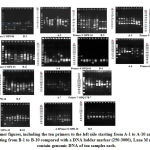 |
Figure 2: MRSA primer figures, including the ten primers to the left side starting |
The average number of bands per primer was 14. Primers OPJ-13 and OPE-16 exhibited the most bands (20) with a 100% polymorphism, and these also had the greatest discriminatory index power (DI, 14.1). Primer OPI-06 produced the smallest number of bands (10) and had the least discriminatory power (DI, 7.09). The differences in the molecular weights of the bands reflected the number of targets for each primer site within the DNA in question. The names and sequences of the commercially-synthesized primers used to generate the PCR products (Operon Technologies, USA) along with a summary of the total number of bands and polymorphic fragments are listed in Table 1.
Table 1: Fragments Amplified by the Primers in the Twenty S. aureus Isolates and the % Efficiency of Amplification and Discriminatory Power
| Primer Name | Sequences (5’– 3’) | Number of Bands Amplified in both Strains |
Polymorphism (%) |
Primer Efficiency
(%) |
Primer Discriminatory Power (%) | |
| Total | polymorphic | |||||
| OPI – 06 | AAGGCGGCAG | 10 | 10 | 100 | 7.04 | 7.09 |
| OPJ-13 | CCACACTACC | 20 | 20 | 100 | 14 | 14.1 |
| OPE-16 | GGTGACTGTT | 20 | 20 | 100 | 14 | 14.1 |
| OPQ-01 | GGGACGATGG | 16 | 16 | 100 | 11.2 | 11.3 |
| OPM-20 | AGGTCTTGGG | 14 | 14 | 100 | 9.8 | 9.9 |
| OPN-07 | CAGCCCAGAG | 13 | 13 | 100 | 9.1 | 9.2 |
| OPQ-17 | GAAGCCCTTG | 11 | 11 | 100 | 7.7 | 7.8 |
| OPD-20 | ACCCGGTCAC | 11 | 10 | 90.9 | 7.04 | 7.09 |
| OPB-14 | TCCGCTCTGG | 12 | 12 | 100 | 8.4 | 8.5 |
| OPA-11 | ACCCGACCTG | 15 | 15 | 100 | 10.5 | 10.6 |
| Total | 10 | 142 | 141 | 99.1 | – | – |
In respect to the percentage of polymorphism, a unique band means that the band is present in just one individual and absent in the others (as in the underlined primer OPD-20).The discriminatory index (DI) reflects the likelihood of unrelated isolates being classified as the same type. According to recent guidelines, a typing system should have DI >0.95 for a reliable assessment of the clonal relatedness of the isolates.
Analysis Of Genetic Distance
The inter-group distance is the average of the paired distances of members from both groups. The similarity measures given took values ranging from zero to unity. For identical genotypes s= 1, while for completely distinct measures s = 0. Depending onshared bands between MRSA and MSSA,the increase in bands led to a decrease inthe genetic distance, and vice versa. Table 2 illustrates the values of genetic distance. The highest similarity was obtained between strainsnumbers ‘11’ and ‘12’, while the lowest level was obtained between strainsnumbers ‘4’(MRSA) and ‘14’(MSSA).
Table 2: Genetic distance of Both MRSA and MSSA Strains
| 1. 2. 3. 4. 5. 6. 7. 8. 9. 10. 11. 12. 13. 14. 15. 16. 17. 18. 19. 20. | ||||||||||||||||||||
| 1 0.00000 | ||||||||||||||||||||
| 2. 0.32384 0.00000 | ||||||||||||||||||||
| 3. 0.56972 0.28742 0.00000 | ||||||||||||||||||||
| 4. 0.52774 0.56390 0.42629 0.00000 | ||||||||||||||||||||
| 5. 0.56573 0.55933 0.66907 0.41748 0.00000 | ||||||||||||||||||||
| 6. 0.72791 0.58175 0.45033 0.48715 0.49340 0.00000 | ||||||||||||||||||||
| 7. 0.50461 0.54077 0.49205 0.34082 0.55470 0.56185 0.00000 | ||||||||||||||||||||
| 8. 0.75204 0.73941 0.67117 0.88891 0.81568 0.60448 0.60125 0.00000 | ||||||||||||||||||||
| 9. 0.61871 0.80902 0.72639 0.86500 0.63106 0.66304 0.63931 0.35483 0.00000 | ||||||||||||||||||||
| 10. 0.72499 0.67018 0.49620 0.60837 0.56298 0.53091 0.51379 0.46111 0.44803 0.00000 | ||||||||||||||||||||
| 11. 0.84059 0.78974 0.73243 0.86146 0.68588 0.50066 0.78511 0.69469 0.64789 0.64497 0.00000 | ||||||||||||||||||||
| 12. 0.80057 0.79228 0.77245 0.99901 0.68508 0.65301 0.82513 0.77245 0.68791 0.64004 0.18312 0.00000 | ||||||||||||||||||||
| 13. 0.72182 0.75798 0.82327 0.82971 0.65413 0.57426 0.75335 0.86773 0.69618 0.68467 0.31399 0.21079 0.00000 | ||||||||||||||||||||
| 14. 0.86348 0.76611 0.78884 0.999110.82931 0.63955 0.72374 0.92238 0.74687 0.69280 0.30061 0.21892 0.24780 0.00000 | ||||||||||||||||||||
| 15. 0.74262 0.70182 0.76229 0.84480 0.67800 0.50583 0.85419 0.80151 0.67775 0.70992 0.35410 0.25220 0.22125 0.26860 0.00000 | ||||||||||||||||||||
| 16. 0.75171 0.67867 0.73649 0.76528 0.72632 0.48352 0.65564 0.81060 0.89312 0.62470 0.40241 0.30052 0.23182 0.25864 0.20488 0.00000 | ||||||||||||||||||||
| 17. 0.91697 0.90661 0.84233 0.99141 0.75496 0.50583 0.77723 0.80151 0.71697 0.60814 0.31243 0.21298 0.22125 0.19164 0.24512 0.22198 0.00000 | ||||||||||||||||||||
| 18. 0.82496 0.77411 0.75602 0.79932 0.79286 0.53633 0.84953 0.75602 0.89463 0.77777 0.37457 0.31208 0.27686 0.28499 0.29680 0.22960 0.27660 0.00000 | ||||||||||||||||||||
| 19. 0.80377 0.71733 0.74006 0.73557 0.69352 0.55959 0.83196 0.77928 0.69474 0.72406 0.37536 0.27080 0.21844 0.28719 0.24159 0.30895 0.29986 0.21515 0.00000 | ||||||||||||||||||||
| 20. 0.68913 0.72529 0.78884 0.88663 0.70148 0.58239 0.88408 0.70880 0.62426 0.69280 0.23874 0.19872 0.24780 0.29849 0.24879 0.33711 0.28880 0.26393 0.22657 0.00000 | ||||||||||||||||||||
Cluster Analysis of RAPD
Cluster analysis was conducted using the unweighted pair-group method, in which the samples were grouped based on similarity to construct a dendrogram. Strikingly, the twenty S. aureus isolates formed two distinct groups (Fig. 3). All MRSA strain isolates were mapped to the upper group in the phylogenetic tree. Major Cluster, I included three main groups. The first of these groups contained two sub-clusters; one contained isolate C1 and the other contained isolates C2 and C3. The second group also contained two sub-clusters; one included isolates C4 and C7 and the other included isolates C5 and C6. Likewise, there were two sub-clusters in the third group with the first cluster containing isolates C8 and C9 and the second containing isolate C10.
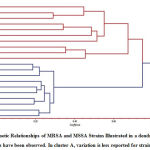 |
Figure 3: Genetic Relationships of MRSA and MSSA Strains Illustrated in a dendrogram. |
The second major cluster (Cluster II) represents the MSSA strains and included three main groups. The first group contained two sub-clusters; one contained isolates C11 and C12 and the other contained isolate C20. The second group also included two sub-clusters. The first of these contained only isolate C13, and the second contained isolates C15 and C16. The second sub-cluster, meanwhile, contained isolates C14 and C17. The third group contained only one sub-cluster which included two isolates, C18 and C19.
Discussion
The taxonomy of a genus is traditionally based on morphological characteristics, but there are significant difficulties in distinguishing the closelyrelated groups such as the populations or strains of the same species. New techniques using molecular markers, however, now allow for much easier identification of such strains [32, 33].
One of these techniques is RAPD-PCR, which depends on the amplification of DNA fragments with a single arbitrary primer resulting in the generation of amplified products that represent a multiplicity of anonymous sites that are characteristic of the studied genome [34, 35]. This method is widely recognized as a highly discriminatory tool for the molecular typing of a wide range of bacteria, due to its ability to determine polymorphisms in the entire bacterial genome [36].
The advantage of this technique is that markers are targeted to a much smaller locus within the genome, and the likelihood of identifying false positive markers is small; therefore, the RAPD analysis has been widely used for taxonomic and phylogenetic studies, for species differentiation, and for the study of phylo-geographic patterns of genetic variations [37, 38]. Furthermore, it requires only small amounts of DNA. Compared to other methods, it is simpler, very sensitive, cheaper, faster and less labour-intensive [39, 40, 41]. It can detect rearrangements, additions, or deletions of DNA by visualizing banding shifts, missing bands or the appearance of new bands [42].
The failure of some primers to amplify DNA may be attributed to their need for special requirements in terms of PCR-reagents or temperature profile since all reaction parameters were identical for all primers. The G+C content of a primer may further interfere with the PCR yield. The RAPD markers developed independently were soon used for linkage mapping and the detection of relatedness among species [43].
These markers were the simplest (as they do not require prior knowledge of the target sequences for their design), and they are less expensive and fast. In addition, these markers exhibit reasonable efficiency compared with other methods. They can anneal and prime at multiple locations throughout the genome, producing a spectrum of amplification products that are characteristic of the template [44]. Ozbeyet al. (2004) stated that using different RAPD primers increases the differentiation power of the process. If RAPD markers are used to detect polymorphisms and genetic relationships, as in the present work, a large number of primers is recommended to make the chance of producing monomorphic bands over the species tested [45].
In this study the differences in the RAPD profiles obtained with almost all primers revealed the presence of a great genetic heterogeneity between both strains, allowing the researchers to demonstrate the technique’s ability to differentiate strains at the intra-specific level. The strategy for identifying the methicillin-resistant strains among S. aureus in this study agreed with that of Ozbeyet al. (2004), who maintained that the RAPD analysis has been applied to identify the strains belonging to the same species.
Historically, S. aureushas been described as a variable bacterium with many pathogenic and antibiotic-resistance variants [9]. Several studies have provided evidence that MRSA strains have evolved in a relatively small number of lineages that are clonally-related, and that some MRSA strains are present in distant lineages. This has led to the prediction that the presence of the mecAgene in such widely divergent lineages is the consequence of the horizontal transfer of the mecregion into related S. aureuschromosomal backgrounds, proving that the MRSA strains have evolved several times independently [42]. Our cluster analysis is compatible with Branger’s hypothesis; it demonstrates that MSSA and MRSA genomic groups are distantrelated. In Branger et al., the coefficient of relatedness did not exceed 45%, while in this study the coefficient was 40% with degree-interrelatedness (only 15).
The reasons behind the progressive development of genotypic strategies were the shortcomings in the previous phonotypical methods. Accordingly, RAPD has been proposed as the method of choice for typing S. aureusisolates and is considered as one of the most reproducible and discriminatory techniques [46].Using appropriate statistical analysis is very important to make definitive identifications of genetic variation. RAPD subtyping approaches can provide useful epidemiological information regarding antibiotic resistance.
Conclusion
In this study, the DNA-based assays (both RAPD and conventional PCR) have provided a rapid method for the detection and characterization of methicillin-resistant Staphylococcus aureus(MRSA). The RAPD technique allows larger proportions of the genomes to be studied in the generation of the banding pattern, leading to finer discrimination among strains. This analysis has detected the genetic variation revealing that the analyzed S. aureusisolates were divided into two distinct groups of the same species, methicillin- susceptible and methicillin-resistant strains.
References
- Cornelissen C.N., Fisher B. D., and Harvey R. A., Lippincott’s Illustrated Reviews, Microbiology, 3rd Edition, 2013, Lippincott Williams & Wilkins, Tokyo, Japan.
- Nouri, M. A., Al-Halbosiy, M. M. F., Dheeb, B. I. and Hashim, A. J., Cytotoxicity and genotoxicity of gliotoxin on human lymphocytes in vitro, 2015, Journal of K S U – Science. 27, 193–197.
- Himsworth Ch. G., Miller R. R., Montoya V., Hoang L., Romney M. G., Al-Rawahi G. N., Kerr T., Jardine C. M., Patrick D. M., Tang P., Weese J. S., Carriage of Methicillin-Resistant Staphylococcus aureus by Wild Urban Norway Rats (Rattusnorvegicus), of Plos One. 2014, 9 (2): 1-9.
- El-Hilali F, El-Hilali H, Dheeb BI, Traore BM, Messouak M, Mazouz H, Moumni M, Belgacem FBM, and El-Mowafy AM., Blood Transfusion Utility During Cardiopulmonary Bypass and Correlation with Key-Biochemical Laboratory Findings: A New Approach to Identify Preventive and Risk Factors (1-Year Practice at University Hospital Hassan-II of Fez), Biochem Anal Biochem 2016, 5:3 DOI: 10.4172/2161-1009.1000290
- Al-Tekreeti AR, Al-Halbosiy MMF, Dheeb BI, Hashim AJ, Al-Zuhairi AFH., Molecular identification of clinical Candida isolates by simple and randomly amplified polymorphic DNA-PCR, Arab J SciEng, 2017, DOI 10.1007/s13369-017-2762-1.
- Hussain, A. F., Sulaiman, G. M., Dheeb, B. I., Hashim, A. J. and Seddiq, S. H., Improvingconditions for gliotoxin production by local isolates of Aspergillusfumigatus, Journal ofbiotechnology research center, 2017, 11(2):14-24.
- Lindsay J A and Holden MT. Staphylococcus aureus: superbug, super genome? Trend Microbiol., 2004: 12 (8): 378- 385.
- Rassin, N. K., Nemat J. A, Dheeb, B. I., Molecular Identification of Aspergillusfumigatus Using ISSR and RAPD Markers, Iraqi Journal of Science, 2015, 56 (4A), 2788-2797.
- Baba T., Bae T., Schneewind O., Takeuchi F. and Hiramatsu K., Genome Sequence of Staphylococcus aureusStrain Newman and Comparative Analysis of Staphylococcal Genomes: Polymorphism and Evolution of Two Major Pathogenicity Islands, of Bacteriol. 2008, 190(1):300-310.
- Ibrahim, I. M., Iftikhar, M., Ali, I. M., Dheeb, B. I., Abbas, Q. A., Ramizy, A., Eisa, M. H. andAljameel, A. I., Antifungal activity of wide band gap Thioglycolic acid capped ZnS:Mnsemiconductor nanoparticles against some pathogenic fungi, Materials Science and Engineering, 2017, C 73:665–669.
- Chua K.Y.L., Stinear T. P. and Howden B. P., Functional genomics of Staphylococcus aureus, of Brif.InFunc. Genomics, 2013, 12 (4): 305-315.
- Dheeb BI, Al-Mashhadani II, dheeb BI, Ismail EN, MajeedSM, Majeed DM., A Study of the Expression of Aflatoxin B1 Regulatory Gene in Clinical and Environmental Aspergillusflavus using Real-time PCR, 2014, I J S: B A R, 17 (1), 417-427.
- Dheeb, B. I., Al-Mudallal, N. H., Salman, Z. A. and Ali, M., The Inhibitory Effects ofHuman, Camel and Cow’s Milk against Some Pathogenic Fungi in Iraq, Jordan Journal of Biological Sciences, 2015, 8(2) 89 – 93.
- Xia G., Wolz Ch., Phages of Staphylococcus aureus and their impact on host evolution, of Infection, Genetics and Evolution, 2014, 21: 593-601.
- Hussain AF, Sulaiman GM, Dheeb BI , Hashim AJ., Histopathological changes and expression of transforming growth factor beta (TGF-β3) in mice exposed to gliotoxin, Journal of K S U – Science, 2018, 27, 193–197.12.
- Yoke-Kqueen C., Laurence J., Radu S., Characterization of Staphylococcus aureus Isolated from The Skin Surface of Athletes and Training Environment by Random Amplified Polymorphic DNA and Antibiotic Resistance profiling, of Biotechnol. 2006, 5 (4): 489-494.
- Abdulbaqi NJ, DheebBI ,Irshad R., Expression of Biotransformation and Antioxidant Genes in the Liver of Albino Mice after Exposure to Aflatoxin B1 and an Antioxidant Sourced from Turmeric (Curcuma longa), Jordan Journal of Biological Sciences. 2018, 11(2) 89 – 93.
- Hussein, HS, Dheeb BI, Hamada,TA., Studying the candida resistance and sensitivity for some antifungals, Journal of Biotechnology Research Center. 2019, 13 (2)25-34.
- Bander KI, Mohammed SH, ThalijKM, Dheeb BI., Survey Study of the Allergic Fungi in Kirkuk Area and Use Molecular Detection for Identification, 2015, I J S: B A R, 19 (1), 383-397.
- Mehndiratta P.L. and Bhalla P., Typing of Methicillin resistant Staphylococcus aureus: A technical review, J. of Indian Midic. Microbiol., 2012, 30 (1) : 16-23.
- Dahham, MT, Omar AF, Dheeb BI., Synergistic effect of tea tree oil on fungi causing vaginal thrush in pregnant women, Journal of Biotechnology Research Center, 2019, 13 (2)35-44.
- Shanmugam S., Selvarajan R., Thangiah S., Drug resistance of Staphylococcus aureus in sinusitis patients, Int. J. of Biosci. 2011, 1(3):63-71.
- Abdulamir A. S., Yoke T. S., Nordin N. and Abu Bakar F., Detection and quantification of probiotic bacteria using optimized DNA extraction, traditional and real-time PCR methods in complex microbial communities, Afr. J. Biotechnol. 2010, 9 (10): 1481-1492.
- Al-Noaami R. J., Detection the Genotype Estimation of Allele Frequencies for ABO Groups an Rh Factor in Populations of Selah Al-Dine and Kirkuk and Neneva Provinces, Ph.D. thesis, College of Education, Tikrit University, 2014.
- Dheeb BI, Al-Halbosiy MMF, Al lihabi RK, Khashman BM., The effects of Rubusidaeus extract on normal human lymphocytes and cancer cell line. BMC Genomics., 2016, 17(Suppl 6):P19.
- Kumari N. and Thakur S.K., Randomly Amplified Polymorphic DNA- A Brief Review, J. of Americ. Animal and Vet. Scien., 2014, 9 (1): 6-13.
- Dheeb B. I., Immunohistochemical study of Tumor Necrosis Factor-alpha(TNF- α) expression in lung, liver, and spleen during aspergillosis infection, BMC genomics., 2013 ,15 (2), 71.
- Kosman E. and Leonard K. J., Similarity coefficients for molecular markers in studies of genetic relationships between individuals for haploid, diploid, and polyploid species, of Molec. Ecol. 2005, 14: 415-424.
- AF Hussain, GM Sulaiman, BI Dheeb, AJ Hashim, ESA Alrahman., Histopathological changes and expression of transforming growth factor beta (TGF-β3) in mice exposed to gliotoxin], Journal of K S U – Science., 2020, 27, 193–197.
- Galal F. H., Comparison of RAPD and PCR-RFLP markers for classification and taxonomic studies of insects, Egypt.Acad. J. of biolog. Sci., 2009, 2 (2): 187-195.
- BI Dheeb., Antifungal Activity of Alkaloids and Phenols Compounds extracted from black pepper Piper nigrum against some pathogenic fungi, Jornal of B R., 2015. 9 (2), 46-54.
- AL-Darahi K. F., Mahdi L. K., AL-Naib K. T., Jubreal J., Molecular Charecterization of E. coli O157:H7 Strains Using Random Amplified Polymorphic DNA (RAPD), J. of Dohuk Univ., 2008, 11 (1): 198-205.
- SY Hammadi, AS Hussein, DM Majeed, BI Dheeb, EN Ismail. RAPD and ISSR analyses of Saccharomyces cerevisiae isolates from different sources Jornal of BRC .2019 .12 (2), 40-50
- AHM Hamoody, JN Abood, BI Dheeb., The synergistic effect of fungus filter Aspergillusterreus and aqueous extract of Fucusvesiculosus on some growth characteristics of the ocimumbasilicum and its content of heocimumbasilicum and itscontentof active substances, Eurasia J Bio sci., 2020. 14, 161-166.
- Larrasa J., Garcı´a-Sa´nchez A., Ambrose N. C., Parra A., Alonso J. M., Reyd J. M., Hermoso-de-Mendoza M., And Hermoso-de-Mendoza J., Evaluation of randomly amplified polymorphic DNA and pulsed field gel electrophoresis techniques for molecular typing of Dermatophiluscongolensis, FEMS Microbiology Letters, 2004, 240: 87-97.
- AS Husain, KM Thalij, BI Dheeb., Effects of interaction between Aflatoxins (AFs) and functional materials FM in the hematological, biochemical parameters and enzyme activity in Rats, Egyptian Academic Journal of Biological Sciences, B. Zoology., 2014, 6 (2), 17-2.
- Abu-Qatouseh, L. F., Chinni, S. V., Seggewiß, J., Proctor, R. A., Brosius, J., Rozhdestvensky, T. S., … & Becker, K. (2010). Identification of differentially expressed small non-protein-coding RNAs in Staphylococcus aureus displaying both the normal and the small-colony variant phenotype. Journal of Molecular Medicine, 88(6), 565-575.
- Scarano D. and Rao R., DNA Markers for Food Products Authentication, J. of Diversity, 2014, 6: 579-596.
- Ozbey G., Kilic A., Ertas H. B., Muz A., Random amplified polymorphic DNA (RAPD) analysis of PasteurellamultocidaandManheimiahaemolyticastrains isolated from cattle, sheep and goats, J. ofVet. Med. – Czech, 2004, 49 (3): 65-69.
- Idil N. and Bilkay I.S., Application of RAPD-PCR for Determining the Clonality of Methicillin Resistant Staphylococcus aureusIsolated from Different Hospitals, J. of Braz. Arch. Biol. Technol., 2014, 57(4): 548-553.
- Donate-Correa J., Alcoba-Florez J. and Méndez-AlvarezS., New Staphylococcus aureusgenetic cluster associated with infectious osteomyelitis, J.of Int. Microbiol. 2011, 14:33-39.
- Datta S., Gangwar S., Kumar S., Gupta S., Rai R., Kaashyap M., Singh P., Chaturvedi S. K., Singh B. B., Nadarajan N., Genetic Diversity in Selected Indian Mungbean [Vignaradiata(L.) Wilczek] Cultivars Using RAPD Markers, Ameri.J. of Plant Scien. 2012, 3, 1085-1091.
- Al-Zahrani N. H., PCR- based Random Amplified Polymorphic DNA Fingerprinting of Staphylococcus aureusstrains isolated from patients in Jizan Hospital, Saudi Arabia, J. of Life Sci, 2013, 10 (12): 316-322.
- Olorunfemi O.B., Onasanya A.A. and Adetuyi F.C., Genetic variation and relationship in Staphylococcus aureusisolates from human and food samples using random amplified polymorphic DNAs, African J. of Biotechnol., 2005, 4 (7): 611-614.
- Penner G. A., Bush A., Wise R., Kim W., Domier L., Kasha K., Laroche A., Scoles G., Molnar S. J. and Fedak G., Reproducibility of Random Amplified Polymorphic DNA (RAPD) Analysis among Laboratories, Cold Spring Harbor Laboratory Press ISSN, 1993, 9: 341-345.
- Branger C., Gardye C., Galdbart J-O., Deschamps C., and Lambert N., Genetic Relationship between Methicillin-Sensitive and Methicillin-Resistant Staphylococcus aureusStrains from France and from International Sources: Delineation of Genomic Groups, J. of Clin. Microbiol., 2003, 41(7): 2946-295.

