
Manuscript accepted on :28-04-2020
Published online on: 19-05-2020
Plagiarism Check: Yes
Reviewed by: Karol Wróblewski
Second Review by: Jarosław L. Przybył
Final Approval by: Prof. Omar M. E. Abdel-Salam
O. Alami Hamedane*, T. Saffaj, B. Ihssane, R. El hajji, F. Jhilal, Y.Hameda Benchekroun and S. Alaoui Sosse
Application Organic Chemistry Laboratory, Faculty of Sciences and Techniques, BP 2202 immouzer-FEZ- Road-University Sidi Mohamed Ben Abedallah-Morocco
Corresponding Author E-mail: omar.alamihamedane@usmba.ac.ma
DOI : https://dx.doi.org/10.13005/bpj/1929
Abstract
This work aims to confirm the reliability and applicability of the decision profile as a new overall strategy for the analytical validation and estimation of measurement uncertainty by applying it to the analysis of oxycodone and imatinib using LC-MS. The primary goal of this new approach is to unite two essential criteria prescribed by the ISO IEC 17025, namely analytical validation and estimation of measurement uncertainty, which are required to produce quality results [3]. This innovative approach, recently developed in our laboratory, is defined as a simple and efficient graphical decision-making tool based on the calculation of the tolerance interval of the type "β-γ content" [7,8] using Monte-Carlo simulation. This technique uses the notion of uncertainty instead of accuracy to evaluate the performance of analytical methods, without the need for additional experiments.
Keywords
Analytical validation; Decision profile; Measurement uncertainty; Monte-Carlo simulation; Tolerance interval of type "β-γ content"
Download this article as:| Copy the following to cite this article: Hamedane O. A, T. Saffaj 1, B.Ihssane 1, R.El hajji 1, F. Jhilal 1, Benchekroun Y. H, Sosse S. A. Full Validation of the Method Employed to Analyze Oxycodone and Imatinib with LC-MS Using Monte-Carlo Simulation. Biomed Pharmacol J 2020;13(2). |
| Copy the following to cite this URL: Hamedane O. A, T. Saffaj 1, B.Ihssane 1, R.El hajji 1, F. Jhilal 1, Benchekroun Y. H, Sosse S. A. Full Validation of the Method Employed to Analyze Oxycodone and Imatinib with LC-MS Using Monte-Carlo Simulation. Biomed Pharmacol J 2020;13(2). Available from: https://bit.ly/3g63tcL |
Introduction
Oxycodone or 4,5α-Epoxy-14-hydroxy-3-methoxy-17-methylmorphinan-6-one (Figure 1) is a semi-synthetic opioid analgesic, derived from thebaine. It is a narcotic analgesic that acts in a similar way to morphine and is proposed for treating the intense chronic pain caused by cancer. Furthermore, oxycodone is used when other lower-level analgesics are not effective or when the patient exhibits intolerable side effects to such drugs.
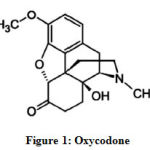 |
Figure 1: Oxycodone |
Oxycodone appears on the list of narcotic drugs, indicating that it acts on the nervous system and is addictive. Therefore, the patient must take it with care, while the number of therapeutic units per dose, the number of doses, and the dosage of the prescribed specialty must be indicated in full [1].
Imatinib or 4-(4-methyl piperazine-1-methyl)-N-4-methyl-3-[4-(3- pyridyl) pyrimidine-2-amino]-benzamide (Figure 2) is a small molecule protein kinase inhibitor that significantly restricts the activity of platelet-derived growth factor (PDGF) tyrosine kinase. It is widely used in the treatment of chronic myeloid leukemia (CML) and gastrointestinal stromal tumors [2].
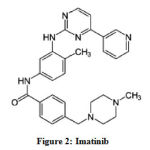 |
Figure 2: Imatinib |
As noted previously, oxycodone and imatinib are two molecules used in the treatment of cancer, but at certain doses, their side effects can lead to death [1, 2].
Consequently, it is essential that the analytical results are reliable and accurate, especially when the safety of patients is at stake. This means that the analytical results should reflect the content of the sample as accurately as possible.
ISO/IEC 17025 represents an international standard, which indicates the general requirements for the competence of calibration and testing laboratories. Moreover, this standard applies to all laboratories, regardless of the purpose of their activities, or their size.
Chapter 5 of this standard is crucial and covers the technical requirements for producing quality results, namely, analytical validation and estimation of measurement uncertainty [3].
Analytical validation can be considered crucial as many guides have been published that explain how to validate methods (IUPAC Technical Report: Harmonized guidelines for single-laboratory validation of methods of analysis; ICH Recommendations: Validation of Analytical Procedures: text and methodology; NIST Recommendations: NIST Guidelines for Evaluating and Expressing Uncertainty of NIST Measurement Results; The ISO 5725 Series of Standards; ISO 17025, 2005; ISO 15189, 2012; COFRAC Guides). Unfortunately, these guides often contain inconsistencies in terminology and the statistical methods proposed. In practice, the proposed procedures often present problems in the final decision. To address these issues, in 2003 the SFSTP [4] proposed a new strategy for analytical validation called the accuracy profile. This method suggests creating a simple and efficient graphical decision-making tool based on the tolerance interval “β-expectation” as a statistical methodology [5]. The advantage of this approach is that it resolves conflicts between accuracy and trueness as previous approaches treat accuracy and trueness independently. This has resulted in ambiguous conclusions that can only be reached if one of these two criteria are met. In contrast, the accuracy profile facilitates the simultaneous representation of both criteria in the same graph.
ISO IEC 17025 is also based on measurement uncertainty. This can be defined as a parameter that characterizes the dispersion of values assigned to a measurand [3]. The term uncertainty has only recently become familiar to chemists. However, it is now considered a key issue in laboratories as it requires a high degree of technicality and the mastery of statistical tools.
The methodology described in the Eurachem Guide [6] for estimating measurement uncertainty is based on revealing the sources of error for each method. These should then be organized in the form of a 5M diagram (material, labor, material, medium, and method). The disadvantages of this methodology are its complexity and high cost.
As such, our laboratory has developed a new strategy for estimating measurement uncertainty and validating analytical methods called the decision profile [7, 8]. This aims to combine these two requirements and facilitate the estimation of measurement uncertainty.
This new approach uses a simple and effective graphical decision-making tool based on the Monte Carlo simulation that calculates the tolerance of interval “β-γ content”. It uses the notion of uncertainty instead of accuracy to evaluate the performance of analytical methods.
Materials and Methods
Analytical Procedure
To demonstrate the wide applicability of the decision profile when evaluating chromatographic procedures, oxycodone and imatinib in human plasma were analyzed using LC-MS. In addition, a supported liquid extraction (SPE) extraction was used to determine levels of oxycodone and a protein precipitation (PP) extraction was used to determine levels of imatinib [9].
Key information demonstrating the analyte assays is given in Table 1.
Table 1: Summary of Analytical Methods Used for the Determination of Oxycodone and Imatinib in Human Plasma
| Name of analyte | Oxycodone | Imatinib |
| Matrix | Human EDTA K2 plasma | Human EDTA K2 plasma |
| Extraction | SLE | PP |
| Internal standard | Oxycodone-d6 | Imatinib-d8 |
| Mass spectrometer and ionization mode | API4000, ESI+ | API4000, ESI+ |
| Concentartion range | 0,25–250 | 10–10000 |
| Concentration unit | ng/ml | ng/ml |
| Validation concentration | 0,25; 0,75; 125; 200 | 10; 30; 5000; 8000 |
| Production concentration | 0,75; 10; 125; 200 | 30; 400; 5000; 8000 |
ESI+: electrospray ionization in positive mode, SLE: Supported liquide extraction, PP : protein precipitation.
Calibration and Validation Protocol
To validate this method for determining levels of oxycodone in human plasma, calibration standard solutions were prepared by doping human plasma with four concentration levels. The lowest concentration level acted as the limit of quantification. Each sample was analyzed six times (n=6) on six different days (p=6). Depending on the choices made, the calibration plan was adopted as 4×6×6 =144 [9]. Adopting the same calibration plan and the same concentration levels, 144 validation standard solutions were prepared by spiking a stock solution. This solution was prepared by homogenizing human plasma with oxycodone.
To validate this method for determining levels of imatinib in human plasma, calibration standard solutions were doped with human plasma at four concentration levels. The lowest concentration level acted as the limit of quantification. Each sample was analyzed six times (n=6) on five different days (p=5). Depending on the choices made, the calibration plan was adopted as 4×6×5 = 120 [9]. To prepare the validation standard solutions, the same concentrations and calibration protocol were chosen as for determining levels of oxycodone. Homogenized human plasma was spiked with imatinib and 120 validation standard solutions were prepared.
Decision Profile
The decision profile is a graphical decision tool that aims to assure laboratories that each measurement will be carried out in a routine manner. Once the procedure has been validated, it will produce measurements sufficiently close to the true unknown value of the sample, or at least within an acceptable limit depending on the purpose of the procedure. This new approach is based on the calculation of tolerance interval type “β-γ content” [7, 8]. It uses the Liao-Lin-Iyer method [11, 12] which is based on the Monte Carlo simulation.
Monte Carlo Simulation
The Monte Carlo simulation is a general method used early on in metrology to estimate measurement uncertainty when the GUM approach is not easily applicable. It artificially reconstructs a random phenomenon by simulating a fictitious realization sample from the input variables. As a result, this method can obtain the distribution of values for the characterized measurand using the distributions of the input quantities. This leads to a level of confidence in the result of the measurement uncertainty estimation.
Therefore, the Monte Carlo method provides a numerical approximation of measurand distribution. Using this method, determining a mean and a standard deviation becomes a simple process [13, 14].
Constructing the Decision Profile
To build the decision profile, the following steps were carried out:
The acceptance limits were chosen.
The appropriate response functions were chosen.
Based on the selected calibration model, the inverse concentrations were calculated.
The tolerance interval of β-γ for each concentration level was calculated.
The measurement uncertainty for each level was determined.
The decision profile was constructed and the 2D graph was established.
The uncertainty interval (L, U) was compared with the acceptance limits.
Acceptance Limits λ
Acceptance limits are a threshold value. They are proposed by the result user and expressed using %. As such, acceptance limits are variable according to the requirements of the analyst or the objectives of the analytical procedure. For example, λ =1–2% for an analysis of raw materials, 5% for pharmaceutical specialties or 15% for bioanalysis [4].
In this research, the acceptance limit used was ±15% as bioanalytical methods were being tested for validation.
Response Function
The response function was determined using the results obtained after calibration. The response function can be defined as the relationship between the response (signal or material response) and concentration X. The F function that characterizes this relationship is:
![]()
Where ε is the residual error, it can be defined as the error associated with the response function F
In this research, the simple linear function was characterized by the following equation:
![]()
Here, a is the slope and b is the originally ordained [5].
Calculation of Inverse Concentrations (Table 2 and Table 3)
Table 2: Reverse Prediction in the Analysis of Oxycodone in Human Plasma
| Concentration (ng/l) | Replicate | Days | |||||
| 1 | 2 | 3 | 4 | 5 | 6 | ||
| 0,25 | 1 | 0,28 | 0,25 | 0,26 | 0,24 | 0,25 | 0,24 |
| 2 | 0,27 | 0,24 | 0,26 | 0,24 | 0,25 | 0,23 | |
| 3 | 0,28 | 0,24 | 0,25 | 0,25 | 0,25 | 0,23 | |
| 4 | 0,27 | 0,25 | 0,24 | 0,25 | 0,25 | 0,23 | |
| 5 | 0,27 | 0,25 | 0,24 | 0,25 | 0,26 | 0,23 | |
| 6 | 0,28 | 0,23 | 0,25 | 0,24 | 0,23 | 0,23 | |
| 0,75 | 1 | 0,78 | 0,74 | 0,71 | 0,72 | 0,74 | 0,70 |
| 2 | 0,77 | 0,70 | 0,72 | 0,69 | 0,75 | 0,70 | |
| 3 | 0,74 | 0,71 | 0,74 | 0,72 | 0,74 | 0,70 | |
| 4 | 0,75 | 0,72 | 0,71 | 0,69 | 0,73 | 0,73 | |
| 5 | 0,75 | 0,71 | 0,71 | 0,68 | 0,75 | 0,74 | |
| 6 | 0,72 | 0,74 | 0,73 | 0,68 | 0,76 | 0,73 | |
| 125 | 1 | 121,93 | 123,53 | 120,40 | 119,88 | 127,08 | 124,55 |
| 2 | 123,72 | 124,47 | 123,42 | 121,84 | 124,93 | 124,21 | |
| 3 | 122,39 | 123,97 | 120,79 | 119,59 | 126,30 | 122,47 | |
| 4 | 121,38 | 123,43 | 123,53 | 119,81 | 126,94 | 123,62 | |
| 5 | 121,22 | 121,56 | 123,04 | 119,09 | 127,56 | 125,17 | |
| 6 | 123,12 | 121,55 | 120,76 | 121,32 | 124,90 | 124,29 | |
| 200 | 1 | 201,91 | 194,36 | 199,71 | 192,84 | 207,39 | 197,25 |
| 2 | 200,98 | 196,94 | 196,60 | 193,57 | 210,20 | 197,11 | |
| 3 | 199,92 | 195,80 | 198,84 | 194,21 | 209,81 | 197,31 | |
| 4 | 201,45 | 195,93 | 200,59 | 192,85 | 209,44 | 197,90 | |
| 5 | 200,45 | 196,71 | 198,88 | 191,97 | 214,13 | 196,06 | |
| 6 | 198,65 | 193,78 | 199,58 | 194,11 | 208,96 | 199,84 | |
Table 3: Reverse Prediction in the Analysis of Imatinib in Human Plasma
|
Concentration (ng/l) |
Replicate | Days | ||||
| 1 | 2 | 3 | 4 | 5 | ||
| 10 | 1 | 9,46 | 10,28 | 9,92 | 9,69 | 8,94 |
| 2 | 9,64 | 9,71 | 11,24 | 10,55 | 10,43 | |
| 3 | 9,51 | 10,39 | 10,02 | 10,09 | 10,37 | |
| 4 | 11,03 | 10,23 | 9,99 | 9,88 | 9,97 | |
| 5 | 9,71 | 10,35 | 10,78 | 9,35 | 8,89 | |
| 6 | 12,58 | 9,90 | 10,34 | 10,37 | 8,69 | |
| 30 | 1 | 31,68 | 28,56 | 29,88 | 29,72 | 28,23 |
| 2 | 29,03 | 30,13 | 28,67 | 30,42 | 30,25 | |
| 3 | 31,67 | 29,66 | 30,10 | 29,99 | 29,82 | |
| 4 | 31,74 | 30,43 | 29,73 | 30,26 | 29,97 | |
| 5 | 30,96 | 30,03 | 30,57 | 29,78 | 29,51 | |
| 6 | 27,19 | 30,61 | 28,55 | 30,39 | 30,24 | |
| 5000 | 1 | 4559,77 | 4752,63 | 4919,21 | 5046,32 | 5006,11 |
| 2 | 5119,55 | 4815,70 | 4893,39 | 5034,08 | 4914,78 | |
| 3 | 4915,58 | 4829,49 | 5001,62 | 4946,21 | 5004,03 | |
| 4 | 5904,43 | 4719,72 | 4972,73 | 4874,40 | 4983,72 | |
| 5 | 4633,30 | 4744,61 | 4938,22 | 5013,00 | 4998,56 | |
| 6 | 4587,73 | 4790,18 | 4881,54 | 4971,13 | 4998,40 | |
| 8000 | 1 | 8028,48 | 7641,16 | 7909,01 | 7867,78 | 7953,80 |
| 2 | 8610,33 | 7802,65 | 7987,19 | 8093,63 | 7940,22 | |
| 3 | 7470,81 | 7796,86 | 7893,60 | 7665,54 | 7922,61 | |
| 4 | 7202,23 | 7820,88 | 7958,41 | 8042,01 | 7754,34 | |
| 5 | 8405,82 | 7746,37 | 7950,00 | 7804,78 | 8007,04 | |
| 6 | 8739,63 | 7784,91 | 7988,07 | 7788,05 |
7791,23 |
|
Inverse concentrations or inverse predictions are the feedback concentrations in the response function [5].
In this research, the inverse concentrations for the response function were obtained according to the following formula:
![]()
Calculation of the Tolerance Interval type β- γ Content.
Where [L (X), U (X)] is an interval based on the data vector X, X = (X1, …, Xn) is a data sample drawn from a cumulative (continuous) distribution of F using the random variable Z. The interval [L (X), U (X)] is then the tolerance interval for F of β contained with a confidence γ (or (β, γ) – tolerance interval) if:
![]()
Therefore, at least a proportion β of the population modelled by F is contained in the interval [L, U] with a confidence coefficient of γ [10-12].
In this work, the Liao-Lin-Iyer [11, 12] method, which is based on the Monte Carlo simulation, was used to calculate the tolerance interval through the following algorithm using a number of simulations for K=10000 where i = 1, 2, …, K :
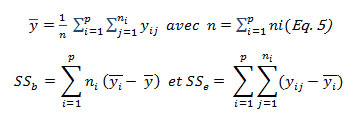
The mean squares MSb and MSe were identified as:
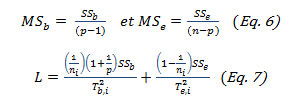
With
![]()
random numbers generated from the chi-square distribution.
The square root of L multiplied by the quantile of a normal distribution (Z(1+β)/2) gives the statistical margin of error D used to calculate the β- content type tolerance interval according to the following formula:
![]()
Here, Uk is the upper limit of the tolerance interval for a concentration level k.
Lk is the lower limit of the tolerance interval for a concentration level k.
Uncertainty Calculation
The measurement uncertainty is a parameter that characterizes the dispersion of values attributed to a measurand (z). Therefore, the purpose of estimating uncertainty is to evaluate the dispersion of measurements made on a sample.
The measurement uncertainty can be calculated by aggregating it with the tolerance interval (Eq.8) according to the following formula [7, 8]:
![]()
Here, t(ν) is (1+ γ)/2 quantile of the student t-distribution with a degree of freedom calculated according to the following equation:
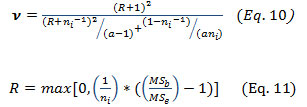
Decision Profile
The decision profile is a graphical decision-making tool recently developed to evaluate the performance of quantitative analytical procedures.
The construction of this profile is based on the calculation of uncertainty limits using measurement uncertainty according to the following equation:
![]()
Here, k is the coverage factor. The use of the k-factor was based on the desired confidence level. To achieve an approximately 95% confidence level, k=2.
Results and Interpretations
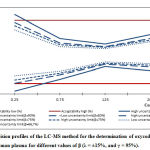 |
Figure 3: Decision profiles of the LC-MS method for the determination |
Table 4: Validation results of the LC-MS method for the determination of oxycodone in human plasma by LC-MS using the decision profile (acceptance limit λ = ±15% and γ = 95%).
|
β |
Concentration | Upper uncertainty limits % | Lower uncertainty limits % | Uncertainty | Expanded Uncertainty | Relative expanded uncertainty |
Decision |
| 66,70% | 0,25 | 10,4526 | -11,3415 | 0,014 | 0,027 | 10,800 | Valid |
| 0,75 | 2,4872 | -9,1539 | 0,022 | 0,044 | 5,813 | Valid | |
| 125 | 1,569 | -4,7797 | 1,984 | 3,968 | 3,174 | Valid | |
| 200 | 4,7862 | -5,452 | 5,119 | 10,238 | 5,119 | Valid | |
| 75% | 0,25 | 12,7379 | -13,6268 | 0,0165 | 0,033 | 13,200 | Valid |
| 0,75 | 3,3594 | -10,026 | 0,0251 | 0,050 | 6,693 | Valid | |
| 125 | 2,1666 | -5,3773 | 2,3575 | 4,715 | 3,772 | Valid | |
| 200 | 5,7499 | -6,4158 | 6,0828 | 12,166 | 6,083 | Valid | |
| 80% | 0,25 | 14,0726 | -14,9615 | 0,0181 | 0,036 | 14,480 | Valid |
| 0,75 | 4,3321 | -10,9988 | 0,0287 | 0,057 | 7,653 | Valid | |
| 125 | 2,5883 | -5,799 | 2,621 | 5,242 | 4,194 | Valid | |
| 200 | 6,4198 | -7,0856 | 6,7527 | 13,505 | 6,753 | Valid | |
| 90% | 0,25 | 18,1193 | -19,0082 | 0,0232 | 0,046 | 18,560 | Invalid |
| 0,75 | 6,2139 | -12,8805 | 0,0358 | 0,072 | 9,547 | Valid | |
| 125 | 3,7966 | -7,0073 | 3,3762 | 6,752 | 5,402 | Valid | |
| 200 | 8,4264 | -9,0922 | 8,7593 | 17,519 | 8,759 | Valid |
Table 4 presents all results necessary to validate the decision profile method for determining oxycodone levels in human plasma using LC-MS.
For a confidence value of (γ=95%) and for a value of β between (66.7% and 80%), in all concentration levels, the uncertainty limits do not exceed the acceptance limits set at ±15%. In addition, the relative expanded uncertainties (%) obtained by dividing the corresponding uncertainties with the introduced concentrations do not exceed 15%. Therefore, it can be concluded that the method is valid for the dosing interval under consideration.
For a confidence value of (γ=95%) and for a value of β= 90%, in concentrations between 0.75 and 200 (ng/l), the uncertainty limits do not exceed the acceptance limits set at ±15%. In addition, the expanded relative uncertainties (%) do not exceed 15%. However, for a concentration of 0.25(ng/l), the uncertainty limits exceed the acceptance limits and the expanded relative uncertainty greater than 15%. In this case, therefore, the method is valid for concentrations between 0.75 and 200 (ng/l) and invalid for a concentration of 0.25(ng/l).
Table 5: Validation results of the LC-MS method for the determination of Imatinib in human plasma using LC-MS using the decision profile (acceptance limit λ = ±15% and γ = 95%).
| β | Concentraion | Upper uncertainty limits % | Lower uncertainty limits % | Uncertainty | Expanded Uncertainty | Relative expanded uncertainty | Decision |
| 66,70% | 10 | 11,7267 | -10,1933 | 0,548 | 1,096 | 10,960 | Valid |
| 30 | 4,1646 | -4,6602 | 0,662 | 1,324 | 4,413 | Valid | |
| 5000 | 4,7527 | -7,7258 | 155,981 | 311,961 | 6,239 | Valid | |
| 8000 | 3,9540 | -6,1478 | 202,035 | 404,069 | 5,051 | Valid | |
| 75% | 10 | 13,6594 | -12,126 | 0,645 | 1,289 | 12,892 | Valid |
| 30 | 4,9699 | -5,4654 | 0,783 | 1,565 | 5,217 | Valid | |
| 5000 | 6,0141 | -8,9872 | 187,056 | 374,112 | 7,482 | Valid | |
| 8000 | 4,9209 | -7,1147 | 240,713 | 481,426 | 6,018 | Valid | |
| 80% | 10 | 15,2327 | -13,6993 | 0,723 | 1,447 | 14,466 | Valid |
| 30 | 5,628 | -6,1235 | 0,881 | 1,763 | 5,876 | Valid | |
| 5000 | 6,9315 | -9,9046 | 210,452 | 420,903 | 8,418 | Valid | |
| 8000 | 5,5916 | -7,7854 | 267,542 | 535,084 | 6,689 | Valid | |
| 85% | 10 | 16,9265 | -15,3931 | 0,808 | 1,616 | 16,160 | Invalid |
| 30 | 6,3421 | -6,8377 | 0,989 | 1,977 | 6,590 | Valid | |
| 5000 | 7,8730 | -10,8462 | 233,990 | 467,980 | 9,360 | Valid | |
| 8000 | 6,4017 | -8,5955 | 299,944 | 599,888 | 7,499 | Valid |
To validate the method for determining imatinib levels in human plasma using LC-MS, the results presented in Table 5 and the decision profile shown in Figure 4 were obtained.
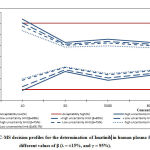 |
Figure 4: LC-MS decision profiles for the determination of Imatinib |
As can be seen for a confidence value of (γ=95%), for a value of β=66.7% and for a value of β=75%, all uncertainty limits were within the acceptance limits set at ±15% for all concentration levels. In addition, the expanded relative uncertainties did not exceed 15%. Therefore, the method can be considered valid over the dosing interval under consideration.
When γ=95% and β=80%, for a concentration of 10(ng/l), the upper uncertainty limit slightly exceeded the acceptance limit. This contrasts to the lower uncertainty limit which did not exceed the acceptance limit. The expanded relative uncertainty did not exceed 15%. As such, this method can be considered valid for all concentration levels under consideration.
When γ=95% and β= 85%, for concentration levels between 30 and 8000 (ng/l), the uncertainty limits did not exceed the acceptance limits. In addition, the expanded relative uncertainties were less than 15%. For the concentration level of 10(ng/l), the acceptance limits were exceeded. In addition, the expanded relative uncertainty was greater than 15%. This method is, therefore, valid for concentration levels between 30 and 8000(ng/l) and invalid for the concentration level of 10(ng/l).
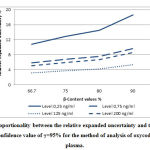 |
Figure 5: Proportionality between the relative expanded uncertainty |
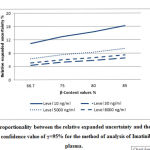 |
Figure 6: Proportionality between the relative expanded uncertainty |
Figure 5, and Figure 6 respectively illustrate the proportionality between the expanded relative uncertainty and the value of β-content for the validation of the method for the analysis of oxycodone in human plasma and the method for the analysis of imatinib in human plasma by LC/MS, for a confidence value of γ=95%.
These two figures show that the higher the confidence value γ, the higher the expanded relative uncertainty value. This provides analysts with result credibility obtained using the routine method.
Conclusion
These results demonstrate that the decision profile approach is reliable and can be easily used to validate the LC-MS method for determining levels of oxycodone and imatinib in human plasma. This approach, without any additional experiments, combines two essential criteria to produce quality results. These results are analytical validation and the estimation of measurement uncertainty. As such, this gives analysists a greater degree of control over the risks of routinely using the analytical method. It also provides analysists with more complete information on the performance of this method.
Aknowledgement
The authors are very grateful to the anonymous reviewers for providing important comments that led to significant improvements of this publication.
Conflict of Interest
There is no conflict of interest
References
- Frédéric Aknouche, Émilie Guibert, Alison Tessier , Jean-Claude Alvarez, Anne-Sophie Lemaire-Hurtel, Pascal Kintz. . Première serie de décés en France liés à l’oxycodone . Toxicologie Analytique & Clinique (2015) 27, 52—56
- Goldman, A.-B. Duval-Modeste, A. Lambert, N. Contentin, P. Courville , P. Musette, P. Joly. Syndrome d’hypersensibilité médicamenteuse à l’imatinib. Annales de dermatologie et de vénéréologie (2008) 135, 393—396.
- ISO/DIS 17025, General requirements for the competence of calibration and testing laboratories, ISO, Geneva, Switzerland, 2005.
- Hubert Ph., Nguyen-Huu J. J., Boulanger B., Chapuzet E., Chiap P., Cohen N., Compagnon P. A., Dewe W., Feinberg M., Lallier M., Laurentie M., Mercier N., Muzard G., Nivet C., Valat L. Validation des procédures analytiques quantitatives : Harmonisation des démarches. STP Pharma Pratiques, 13 (2003) , 101.
- Hubert Ph, Nguyen-Huu JJ, Boulanger B, Chapuzet E, Chiap P, Cohen N, et al. Harmonization of strategies for the validation of quantitative analytical procedures-A SFSTP proposal-Part II. J Pharm Biomed Anal 2007;45:70-81.
- EURACHEM/CITAC Guide: quantifying uncertainty in analytical measurement, 2nd. edn EURACHEM/CITAC, Budapest, 2000
- T. Saffaj, B. Ihssane, Reply to the responses to the comments on uncertainty profiles for validation of analytical methods . Talanta 106 (2013) 155–157.
- Saffaj, B. Ihssane, F. Jhilal, H. Bouchafra, S. Laslami, S. Alaoui Sosse. An overall uncertainty approach for the validation of analytical separation methods. Analyst 138 (2013) 4677-4691.
- Aimin Tan, Taoufiq Saffaj, Adrien Musuku, Kayode Awaiye, Bouchaib Ihssane, Faycal. Jhilal, Saad. Alaoui Sosse, Fethi Trabelsi. Large-scale retrospective evaluation of regulated liquid chromatography-mass spectrometry bioanalysis projetcs using different total error approaches. journal of Chromatography B, 983–984 (2015) 68–75
- Tabea Rebafka , Stéphan Clémençon , Max Feinberg. Bootstrap-based tolerance intervals for application to method validation. Chemometrics and Intelligent Laboratory Systems 89 (2007) 69–81
- Liao C.T., Iyer H.K. A tolerance interval for the normal distribution with several variance components . Statistica Sinica, 14 (2004), 217-229.
- Liao C.T., Lin T. Y., Iyer H. K. One- and Two-Sided Tolerance Intervals for General Balanced Mixed Models and Unbalanced One-Way Random Models. Technometrics, 47 (2005) , 323-335.
- François Hennebelle, Thierry Coorevits. Propagation des distributions – Détermination des incertitudes par la méthode de Monte Carlo. Techniques de l’ingénieur, pp.21, 2013.
- Evaluation of measurement data_ Supplement 1 to the “guide to the expression of uncertainty in measurement propagation of distributions using a Monte Carlo method; JCGM 101:2008

