
Manuscript accepted on :11-03-2020
Published online on: 22-05-2020
Plagiarism Check: Yes
Reviewed by: Hesam Kamyab
Second Review by: Tianhong Mu
Final Approval by: Dr Pallav Sengupta
Fayez Althobaiti
Department of Biotechnlogy, Faculty of Science, Taif University, Taif, Saudi Arabia
Corresponding Author E-mail : faizh1394@gmail.com
DOI : https://dx.doi.org/10.13005/bpj/1938
Abstract
The complete phenolic and flavonoid content ofChenopodium ambrosioidswas extracted and analyzed calorimetrically in methanol and polyphenols, and quantified by HPLC assessment. An antioxidant assay was also carried out; DPPH radical scavenging activity was evaluated in methanol extract. Samples were screened for inhibitory potentials against free radicals and microbial types. The findings indicate that the HPLC assessment of phenolic acids was particularly enriched by quercetin-3-O-rutinoside, kaempferol 3-O-rutinoside and quercetin dirhamnoside in resorcinol acids, gallic acid, trans p-coumaric acid, ellagic acid and flavonoid compounds. The highest levels of polyphenols and flavonoids in Commiphora ambrosioides leaves are related to excellent DPPH radical inhibition outcomes.The inhibition zones for the gram‐positive bacteria, Bacillus subtilis and Staphylococcus aureus, were 9mm and 18mm, while those for the gram negative bacteria, Escherichia coli and Proteus vulgaris,were 15mm and 10mm. The inhibition zones for the two fungi,Cryptococcus neoformas and Candida albicans, were 12mm and 8mm respectively. From these results it could be recommended that the methanolic extract ofC.ambrosioides leaf revealed higher phenolic acids, flavonoid compounds and antioxidant activity. Moreover, the study of polyphenolic compound activity against some pathogenic bacteria foundC. ambrosioides extractexhibited significant bioactivity and antimicrobial properties.Seven Chenopodium ambrosioides samples were gathered from separate geographical places in Saudi Arabia and ten RAMP primer combinations were used in the phylogenetic analysis of these samples, all of which generated scorable PCR patterns. The RAMP assay produced 134 PCR patterns, with a mean of 13.4 patterns per primer. There were 75 polymorphic patterns, with a mean of 7.5 patterns per primer. The total polymorphic pattern percentage was 60%, with a range of 36-85%. The RAMP-PCR assay proved its efficiency in studying the diversity of C. ambrosioides, providing a high number of polymorphic PCR patterns with low cost and good reliability.
Keywords
Chenopodium Ambrosioides; DPPH Radical Scavenging Activity; Microorganisms; Phenolic Acid
Download this article as:| Copy the following to cite this article: Althobaiti F. Evaluation of the Chenopodium Ambrosioides Leaf Extract from Taif Region, Saudi Arabia on Antimicroorganisms and the Assessment of its Genetic Diversity using the RAMP Assay. Biomed Pharmacol J 2020;13(2). |
| Copy the following to cite this URL: Althobaiti F. Evaluation of the Chenopodium Ambrosioides Leaf Extract from Taif Region, Saudi Arabia on Antimicroorganisms and the Assessment of its Genetic Diversity using the RAMP Assay. Biomed Pharmacol J 2020;13(2). Available from: https://bit.ly/3h21d6O |
Introduction
The phytoremediation activity of Chenopodium ambrosioides (Chenopodiacea), Amaranthus hybridus (Amaranthaceae), Mentha longifolia (Labiatae) and Typha domingensis (Typhaceae) in the Wadi Alargy marshes of the Taif region, Saudi Arabia, is high 1,2. Medicinal plants are used by countless individuals worldwide to treat illnesses and are often the primary source of health care. This type of therapeutic tool in folk medicine is accessible, available and socially recognized 3.
These features of Chenopodium crops have led to an appreciation of local species. There are few studies of antioxidant activity in this genus and these mainly focus on C. album, C. quinoa, and C. Ambrosioides 4.
Plant phenolic and flavonoid compounds are natural antioxidants and bioactive substances beneficial to human health, used in the treatment and inhibition of illnesses. Natural antioxidant compounds are the leading replacements for therapeutic products. As a result, many plants are used in the production of pharmaceuticals 5.
The natural antioxidant capabilities in plants and their derivatives have been evaluated to some degree; most natural antioxidants result from the oxidized features of the plants. Multiple methods are used to assess the antioxidant effects of phenolic compounds, which have the ability to get rid of reactive oxygen species and chelate metal ions 6.
Several medicinal behaviors have been allocated to the species, such as antifungal, antitumor, anti-inflammatory, immunomodulatory, antibacterial and analgesic properties. The species is characterized by its high levels of flavonoids, terpenes, alkaloids and gallic tannins 7,8.
Many types of Chenopodiumare used in common medicines, having demonstrated powerful antibacterial, antifungal and anticancer activity 9.
The dried leaves of Chenopodium ambrosioides, have been used medicinally, to treat many illnesses, as well as for its anti-inflammatory and anti-tumor characteristics 10.
Microorganisms can cause diseases, while parasites can also be hazardous to human health. The effects of infectious diseases are particularly serious in countries where plant remedies are not used and where there are problems associated with the use of antibiotics 11.
The advantage of herbal medicine with antimicrobial features and the highest incidence of multi-resistant bacteria is clear. As a result the analysis of plant samples may have the ability to treat complicated diseases 12.
Molecular markers are primarily used in biotechnology and molecular biology to recognize a particular DNA sequence in a pool of unidentified DNA. A genetic marker might be a long or a brief DNA sequence 13.They can identify DNA-level variations including nucleotide change, deletion, duplication, inversion and/or insertion 14. The connection between genetic variation, detected using molecular marker assays, and genes accountable for morphological and physiological characteristics is recognized through sophisticated bioinformatics assessment methods 15,16.
A technique to cover for some deficiency in Random Amplified Polymorphic DNA (RAPD)-PCR, such as inconsistency among specimens and loci-targeted dominance, was introduced using combinations of RAPD and microsatellite primers called Random Amplified Microsatellite Polymorphism (RAMP)-PCR 17.
RAMP-PCR can potentially identify and map co-dominant polymorphisms in DNA without cloning and sequencing, and RAMP-PCR clusters provide more accurate relatedness descriptors than RAPD or microsatellite techniques alone 18. RAMP-PCR is more reproducible and faster than RAPD-PCR in revealing the genetic relationship in barley cultivars 19. The technique uses the permanent and extremely polymorphic nature of microsatellites in combination with the simplicity of genome screening provided by RAPD primers 20.
RAMP-PCR was used to screen for genetic changes in rice mutants after gamma irradiation, where it was easier than RAPD-PCR to identify genetic changes between tightly associated individuals. Only RAMP-PCR was able to identify polymorphic bands between mutants 20. In addition, the RAMP assay was used to search for a tobacco-resistant black shank gene 21, to study genetic stability in Moringa oleifera explants, and to construct a rat genetic map 22.
The objective of this study was to assess complete phenolic acids and total flavonoid compounds in a methanolic sample of Chenopodium ambrosioides leaves and polyphenols by HPLC assessment. DPPH radical antioxidant properties were determined by methanol extract and by the impact of methanol extract at distinct levels on microorganisms. In addition, genetic diversity and DNA fingerprints for Chenopodium ambrosioides samples gathered from distinct geographical locations have been performed using a RAMP molecular marker assay.
Materials and Methods
Materials
Chenopodium ambrosioides leaves were gathered from the Taif region, south-east of Jiddah and the Holy City of Makkah. These were washed with distilled water and air-dried at ambient temperature for a week, followed by oven-drying for 6 hours at 60°C.
Two Gram-positive bacteria species (Staphylococcus aureus and Bacillus subtilis), two Gram-negative bacteria species (Proteus vulgaris and Escherichia coli) and two fungi (Candida albicans and Aspergillus fumigatus) were derived from the American Type Culture Collection (ATCC) as well as other clinical components.
All microbial species have been maintained and cultivated at the Regional Center for Mycology and Biotechnology (RCMB), Al-Azhar University, Cairo, Egypt. Pure cultures of bacteria and fungi were preserved on nutrient agar stands for vegetative development. Plants were kept in the fridge for use and were frequently inspected for pollution. Regular transfers were carried out aseptically.
Nutrient agar was acquired from Oxoid, Basingstoke, United Kingdom. Gentamycin and Ketoconazole are bought from Sigma-Aldrich, St. Louis, MO, USA. Folin-Ciocalteu phenol reagent, aluminum chloride hexahydrate and sodium carbonate were obtained from Applichem GmbH, Darmstadt, Germany. 2,2-Diphenyl-1-picrylhydrazile (DPPH) was acquired from Alfa Aesar, Ward Hill, MA, USA.
Methods
Extraction of Commiphora Ambrosioides Leaves
Methanol leaves were dried at 40oC for three days and leaf powder suspended in methanol was incubated overnight at room temperature (25oC), accompanied by centrifugation (13,000rpm). The supernatant (extract) was moved to another tube and retained at −20oC until needed.
Estimation of Total Phenolic Acids and Total Flavonoid Compounds
The complete phenolic content of the extract was evaluated using the technique according to Qawasmeh et al 23 with Folin-Ciocalteu reagent. The UV reading was measured at 760 nm. Gallic acids are used as normal (1mg/ml) and the outcomes are exhibited as gallic acid counterparts (GAE mg/g dry weight). The complete flavonoid quantity was determined using the technique used by Eghdami and Sadeghi 24. Absorption was measured against a blank solution at 510 nm and a total of 143 flavonoid content is described in terms of milligrams of quercetin corresponding per gram of dry weight (mg QE/g DW).
Quantitative Determination of Flavonoids by HPLC
HPLC analyses were conducted using Dionex Ultimate 3000 fluid chromatography (Germany) with four solvent supply unit quaternary pumps (LPG 3400 SD), which included a diode array sensor (DAD 3000) with a 5 cm liquid chamber, a manual sample transfer valve with a 20μl circuit and a Chromeleon 6.8 circuit assistant information processor. Separation was accomplished by reversing the Acclaim TM 120 C18 column (5 μm particle volume, 4.6 x 250 mm) 25. The total assessment period per sample was 65 min. HPLC chromatograms were identified through a photodiode array UV sensor at three different wavelengths (272, 280 and 310nm), based on the maximum absorption of the analyzed substances. Each compound was recognized by its retention time and by applying norms under the same circumstances. The quantification of the sample was performed by measuring the embedded peak area and its content determined using the calibration curve and plotting the peak area towards the concentration of the respective control sample.
Quantitative Determination of Phenolic Compounds by HPLC
Phenolic substances were determined using the HPLC technique according to Goupy et al 26 as follows:
5 g of specimen was mixed with methanol and centrifuged at 10000 rpm for 10 min. The supernatant was washed through a 0.2 μm Millipore membrane filter, then 1-3ml was gathered in a bottle for incorporation into a Hewlett Packard 1050 HPLC system fitted with self-sampling spray, water degasser, ultraviolet (UV) sensor set at 280 nm and a quaternary pump.
Hewlett Packard with column Altman C18, 5mm (150 mm x 4.6 mm Alltech) The temperature of the column was preserved at 35°C. Gradient extraction was performed with methanol and acetonitrile as a portable phase at a flow rate of 1 ml/min. Phenolic acid standard was dissolved in a portable phase and introduced into the HPLC. Retention time and maximum region were used to calculate the quantity of phenolic compounds using information from Hewlett Packard software.
DPPH Radical Scavenging Activity
The capacity to scavenge DPPH was conducted following the operation outlined by Jena et al 27. Briefly, 0.1mlof eight distinct levels (0.1–1.3mg/ml) of the sample was placed in the dark at 10°C. The reduction in absorbance at 515nm with the UV-visible spectrophotometer (Milton RoySpectronic 1201) was continually determined, with information collected at 1min periods until the absorbance was maintained (16 min). Absorption of the DPPH radical without antioxidant (control) and the reference compound ascorbic acid was also evaluated. The ratio inhibition of the DPPH radical was calculated using the equation:
DPPH Scavenging % = [{(AC- AT)/ AC} x 100]
Where AC = Absorbance of the control at t = 0min
AT = absorbance of the sample +DPPH at t = 16min
The 50% inhibitory concentration (IC50), the amount needed to prevent radical DPPH by 50%, was predicted from the graph of the dose response curve. Ascorbic acid was used as a guide.
Determination of Antimicrobial Activity Assay
The antimicrobial profile was evaluated against two Gram-positive bacterial species (Staphylococcus aureus and Bacillus subtilis), two Gram-negative bacterial species (Proteus vulgaris and Escherichia coli) and two fungi (Candida albicans and Cryptococcus neoformans), using an altered well diffusion technique. 100 μl of both bacteria / fungi tests were cultivated in 10ml of new soil until roughly 108 cells/ml of bacteria or 105 cells/ml of fungi were counted 28,29.
100 μl of microbial suspension was distributed to agar plates similar to the broth in which the Mueller-Hinton and Sabouraud agar were preserved and checked for susceptibility by well propagation technique 30.100 μl of each sample (10 mg/ml) was introduced to each well (10 mm diameter holes in the agar gel). Plates were incubated at 37°C (for bacteria and yeast) for 24-48h and at 28°C (for filamentous fungi) for 48h. The development of the microorganism was noted after incubation. The corresponding inhibition area diameters were evaluated in millimeters and used as a measure for antimicrobial activity.
If the organism is put on the agar, it will not expand in the region surrounding the well if it is vulnerable to the chemical. This region of no disk growth is called the ‘Zone of Inhibition’or ‘Clear Zone’. The size of the clear zone is proportional to the inhibiting action of the compound under investigation. Solvent Controls (DMSOs) were included as adverse checks in each experiment.
DMSO was used to dissolve the compounds tested and showed no inhibition zones, confirming that it had no effect on the growth of the microorganisms examined. Gentamycin and ketoconazole (Sigma Aldrich, USA) were used as conventional antibacterial and antifungal drugs at 30 and 50 ug/ml.
MIC Assay
The sample was examined in vitro for antibacterial and antifungal activity at distinct concentrations in order to determine the smallest amount inhibiting the development of the organism recorded as MIC 31. All readings of the MIC scores were repeated in triplicate.
Statistical Analysis
The experimental results are expressed as mean ± standard deviation (STD) in triplicate. Values were analyzed using SAS PROC GLM methods (release 9.1.3 of 2007, SAS Institute Inc., Cary, NC, USA) 32. p <0.05 was considered statistically significance.
DNA Fingerprinting and Diversity Analysis using RAMP Assay
Seven Chenopodium ambrosioides plant samples were gathered from separate geographical places in Saudi Arabia. To recover intact and high-quality genomic DNA appropriate for PCR assessment, the commercial DNeasy Plant Mini Kit (Qiagen, New York, NY, USA) was used for DNA extraction as indicated by the supplier. DNA quantity and quality were determined using gel electrophoresis and DNA samples were stored at –20oC. Ten RAMP primer combinations were used (Table 1). The RAMP-PCR reaction composition and cycles were based on Hoang et al 20. PCR ultimate products were deposited at 4oC until needed. The electrophoresis assessment using agarose gel (8%) is used to distinguish distinct PCR fragments according to their molecular size. For the observation of PCR bands, the agarose gels used were ethidium bromide, stained and documented by the Gel Doc XR system (Bio-Rad, Hercules, CA, USA).
Table 1: The primer sequence combinations and code names of RAMP assay.
| Name Primer | Combination sequence 5′-3′ |
| RAMP- 1 | 5′-GTTTCGCTCC/(GACA)4-3′ |
| RAMP- 2 | 5′- GTTTCGCTCC/(AC)8T-3′ |
| RAMP- 3 | 5′- GTGACATGCC/(AC)8T-3′ |
| RAMP- 4 | 5′- TGGACCGGTG/(AG)8TC-3′ |
| RAMP- 5 | 5′- GTGACATGCC/(AG)8TC-3′ |
| RAMP- 6 | 5′- AGGCTGGGTG/(AG)8TC-3′ |
| RAMP-7 | 5′-TGGACCGGTG/(AG)8GTG-3′ |
| RAMP-8 | 5′-GTGACATGCC/(AG)8GTG-3′ |
| RAMP-9 | 5′-GTGACATGCC/(AG)8GTG-3′ |
| RAMP-10 | 5′-GACGGATCAG/(GACA)4-3′ |
In terms of phylogentic and variety assessment, only scorable PCR fragments were classified as present (1) or missing (0). The unweighted arithmetic average group method (UPGMA) and Dice’s similarity matrix coefficients, were used to calculate comparison matrices between distinct samples and the phylogenetic dendrogram using the ‘Past’tool 33.
Results and Discussion
Quantitative and Fractional Analysis of Total Phenolic Acids from Commiphora Ambrosioides Leaves using HPLC
Total phenolic acids from Commiphora ambrosioides and their identity, determined using HPLC are recorded in Table 2. The complete phenolic compounds were 126 mg GAE/g of dried leaves. Overall, the HPLC analysis concluded that the extract of methanol was particularly enriched with resorcinol acids, gallic acid, trans p-coumaric acid and ellagic acid, which accounted for approximately 40.2, 33.5, 25.65 and 12.54 mg/100g DW of the complete quantified phenolic acid for the leaves. Lesser quantities of other phenolic acids were found, including catecholic acid, p-coumaroyl pentoside acid, ferulic acid and feruloyl pentoside acid, at 3.96, 3.53, 3.51 and 2.58 mg/100g DW respectively.
Table 2: Fractionation of total phenolic acids as mg/100g DW
| Phenolic acids | Rt (min) | Quantification
(mg/100 g dw) |
| p-Coumaroyl pentoside acid | 6.8 | 3.53 ± 0.50 |
| Feruloyl pentoside acid | 8.2 | 2.58 ± 0.27 |
| Ferulic acid | 14.8 | 3.51 ± 0.14 |
| trans p-Coumaric acid | 16.4 | 25.65 ± 0.77 |
| Ellagic acid | 17.8 | 12.54±0.18 |
| Catechol | 19.1 | 3.96±0.02 |
| Resorcinol | 20.9 | 40.2±0.43 |
| Gallic acid | 23.2 | 33.5±0.27 |
| Total phenolic acids 126.4mg GAE /g | ||
Knowledge of plants exhibiting antioxidant activity may be due to the existence of distinct phenolic compounds. Phenols are secondary metabolites that have an aromatic benzene ring compound attached to one or more hydroxyl groups. Plant polyphenols are a source of nutritional antioxidants and give protection against various diseases 34.
Quantitative and Fractional Analysis of Flavonoid Compounds from Commiphora Ambrosioides Leaves using HPLC
Flavonoid compounds from C. ambrosioides leaf extract were fractionated using HPLC, as reported in Table 3. Flavonoids were the major phenolic compounds present (72.38 mg Quercetin/g). Table 3 shows the major flavonoid glycosides to bequercetin-3-o-rutinoside, kaempferol 3-o-rutinoside and quercetin dirhamnoside, at 84.95, 74.82 and 56.63 mg/100g DW respectively. The median quantities were quercetin-o-glucuronide, kaempferol o-dirhamnoside and quercetin-3-o-glucoside (33.99, 20.38 and 12.91 mg/100g DW respectively). Whereas the flavonoids from the methanol extract as apigenin, kaempferol, quercetin, luteolin andrutin were 25.2319.85, 10.2, 10.1 7.54 mg/100g DW respectively. Kaempferol o-glucuronside, luteolin c-hexoside, isorhamnetin o-pentoside and isorhamnetin o-rhamnoside were the minor flavonoid glycosides compounds.
Table 3: Fractionation of flavonoid compounds as mg/100g dry weight
| Flavonoids compounds | Rt (min) | Quantification
(mg/100 g dw) |
| Apigenin | 9.85 | 25.23±0.25 |
| Luteolin | 11.74 | 10.1±0.12 |
| Kaempferol | 12.1 | 19.85±0.18 |
| Rutin | 12.6 | 7.54±0.08 |
| Quercetin | 13..3 | 10.2±0.11 |
| Luteolin C-hexoside | 15.7 | 2.27 ± 0.09 |
| Kaempferol O -dirhamnoside | 18.1 | 20.38 ± 0.74 |
| Quercetin-3- O -rutinoside | 19.4 | 84.95 ± 6.39 |
| Quercetin dirhamnoside | 20.2 | 56.63 ± 0.35 |
| Quercetin 3- O -glucoside | 20.8 | 12.91 ± 0.80 |
| Kaempferol 3- O -rutinoside | 23.1 | 74.82 ± 2.29 |
| Isorhamnetin O– pentoside | 25.1 | 1.60 ± 0.09 |
| Quercetin O – glucuronside | 26.6 | 33.99 ± 0.28 |
| Kaempferol O – glucuronside | 29.6 | 6.54 ± 0.28 |
| Isorhamnetin O -rhamnoside | 31.2 | 0.50 ± 0.00 |
| Total flavonoids compounds 72.38mg QE /g | ||
Herbal infusions are widely used in common medicines due to their beneficial activities. Among their components, special connections have been assigned to phenolic compounds, which often prevent large antioxidants from withstanding oxidative stress 35,36. These activities as antioxidants exhibit distinct methods, including hydrogen donation responses, metal chelating and antioxidant defense protection 36. C. ambrosioides is a rich source of distinct polyphenols that may participate in this activity.
DPPH Scavenging Activity
The findings relating to DPPH scavenging activity for C.ambrosioides leaf extract are recorded in Figure 1. The reduction in DPPH free radical scavenging activity was estimated on the basis of 50% inhibition concentration (IC50) value. The highest concentration was 1280 µg/ml (89.26%), indicating the highest free radical scavenging activity. The maximum levels of polyphenols and flavonoids in C. ambrosioides leaves achieved the best DPPH radical inhibition results. This connection between phenolic compounds and antioxidant ability (DPPH) agrees with the findings of Schubert et al 37 and Mustafa et al 38.
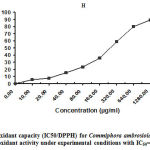 |
Figure 1: Antioxidant capacity (IC50/DPPH) for Commiphora ambrosioides. |
This can be demonstrated by: a number of products that contain plant extract compounds capable of altering the antioxidant capacity; the synergistic effects of different compounds; the testing conditions and processes of the techniques used for antioxidant responses 39. In addition, the extract exhibited antioxidant capacity, functioning under single electron transfer responses. These extracts contain enhanced levels of polyphenol compounds, which are known to have potent antioxidant particles 40-42. Polyphenolic compounds have limited responsibility for the strong antioxidant capacity of C. ambrosioides extracts.
Antimicrobial Activity
Two Gram positive bacteria species (Bacillus subtilis and Staphylococcus aureus), two Gram-negative bacteria species (Escherichia coli and Proteus vulgaris) and two fungi (Cryptococcus neoformas and Candida albicans) were assayed using methanolic extract from Commiphora ambrosioides leaves for antibacterial activity, as shown in Table 4. The extract was studied against all organisms for zones of inhibition. The maximum activity was observed using the diffusion agar technique with a disc diameter of6.0mm for100µl concentration of methanol extract. The zones of inhibition for the Gram‐positive bacteria, Bacillus subtilis and Staphylococcus aureus, were 9mm and 18mm, while the Gram-negative bacteria, Escherichia coli and Proteus vulgaris, were 15mm and 10mm, and the fungi, Cryptococcus neoformas and Candida albicans, were 12mm and 8mm respectively. These results indicate that the Commiphora ambrosioides leaf extracts were rich in natural antioxidants, inhibiting the microorganisms.
Table 4: Mean zone of inhibition in mm produced on a range of pathogenic microorganisms
| Microorganisms | Methanolic extract | Control |
| Fungi | Ketoconazole | |
| Candida albicans | 8 | 20 |
| Cryptococcus neoformas | 12 | 25 |
| Gram-positive bacteria | Gentamycin | |
| Staphylococcus aureus(RCMB010010) | 18 | 24 |
| Bacillus subtilis | 9 | 26 |
| Gram-negatvie bacteria | Gentamycin | |
| Proteus vulgaris R | 10 | 25 |
| Escherichia coli | 15 | 30 |
Gentamycin was used as a control for both Gram-positive and negative bacteria, and Ketoconazole was used as a control for the fungi species. For Bacillus subtilis and Staphylococcus aureus, the inhibition zones were 24 mm and 26 mm; for Escherichia coli and Proteus vulgaris, they were 23 mm and 30 mm, and for Cryptococcus neoformasand Candida albicans, they were 25 mm and 20 mm, respectively.
These findings agree with Kaur et al 43, who examined the antibacterial activity of methanol, acetone and chloroform extracts of C. Album leaves.
Antibacterial activity was evaluated using the well plate method and was determined by the size of the zone of inhibition. Different extracts were studied against the test organisms, namely: Lactobacillus, Bacillus subtilis and Escherichia coli. The highest activity was 100% concentration of various leaf extracts, yielding the greatest zone of inhibition in E. coli (19 mm) and Lactobacillus (19 mm). Antibacterial activity was compared with standard Amoxicillin and was observed to be 23 mm inhibition for Lactobacillus and 25 mm for both E. coli and B. subtilis.
The test was done using the diffusion agar technique, with a well diameter of6.0mm (100 µl was tested). The positive control for fungi was 100 g/ml Ketoconazole and the positive control for bacteria was 4g/ml Gentamycin. The sample was tested at 10 mg/ml concentration.
The minimum inhibitory concentrations in µg/ml of the tested extract on a range of pathogenic microorganisms are displayed in Table 5. These results show that the minimum inhibitory concentration for Staphylococcus aureus was 312.5 µg/ml, followed by Escherichia coli at 625.0 µg/ml. These results confirm that Staphylococcus aureus and Escherichia coliexhibitedthe highest inhibition zone in methanol extract. Cryptococcus neoformas and Proteus vulgaris had equal minimum inhibitory concentrations (1250 µg/ml), and Bacillus subtilis and Candida albicans were higher still 2500 and 5000 µg/ml respectively. Bacillus subtilis and Candida albicans exhibitedthe lowest inhibition zone in methanol extract.
Table 5: Minimum inhibitory concentrations in µg/ml of the tested extract on a range of pathogenic microorganisms
| Microorganisms | Methanolic extract |
| Fungi | |
| Candida albicans | 5000 |
| Cryptococcusneoformas | 1250 |
| Gram Positive Bacteria | |
| Staphylococcus aureus | 312.5 |
| Bacillus subtilis | 2500 |
| Gram Negatvie Bacteria | |
| Proteus vulgaris | 1250 |
| Escherichia coli | 625 |
Methanol samples from Salicornia herbacea, an annual herb of the Chenopodiaceae family, have been found to show antioxidant and antibacterial effects against several pathogenic microorganisms. The samples were also found to be a powerful inhibitor of cytochrome P450 activity against three CYP isozymes 44.
The pharmaceutical significance of Chenopodium quinoa leaves was evaluated by analyzing their phenolic content, the impact of phenolic compounds on the characteristics of cancer cells and estimating their antioxidant behavior. Observations confirmed the chemo-preventive and anti-carcinogenic effects of their phenolic compounds 45.
Chenopodium album is a rich source of anthelmintic substances. It is used medically in some nations as a source of several potent drugs. Ethanol samples of C. Album leaves were discovered to have an antibacterial effect on all Gram-positive and Gram-negative microorganisms. The strongest effect was reported on B. subtilis, with a 13 mm inhibition area at 1000 μg/ml 46.
Molecular Marker Analysis using RAMP Assay
All RAMP primers generated scorable PCR patterns (Figure 2). The RAMP assay produced 134 PCR patterns with a mean of 13.4 patterns per primer. The minimum amount of PCR patterns was 8 (RAMP-2) and the highest was 21 (RAMP-9 and RAMP-4). The number of polymorphic patterns was 75, with a mean of 7.5 patterns per primer. The minimum number of polymorphic patterns was 3 (RAMP-2), while the highest amount was 14, produced by the RAMP-9 primer combination. The polymorphic pattern percentage (PP) was 60%, where RAMP-10 had the highest PP (85%) and RAMP-6 had the lowest (36%). About 16 different RAMP PCR patterns were uniquely linked to one of the 7 plant samples (Table 6).
Table 6: Primer name (PN), total number of PCR patterns (TB), number of monophonic patterns (MB), polymorphic patterns (PB) and polymorphic percentage (PP).
| PN | TB | MB | PB | PP |
| RAMP-9 | 21 | 7 | 14 | 0.67 |
| RAMP-6 | 11 | 7 | 4 | 0.36 |
| RAMP-7 | 15 | 7 | 8 | 0.53 |
| RAMP-8 | 10 | 2 | 8 | 0.8 |
| RAMP-3 | 10 | 5 | 5 | 0.5 |
| RAMP-2 | 8 | 5 | 3 | 0.38 |
| RAMP-4 | 21 | 11 | 10 | 0.48 |
| RAMP-5 | 13 | 7 | 6 | 0.46 |
| RAMP-1 | 12 | 6 | 6 | 0.5 |
| RAMP-10 | 13 | 2 | 11 | 0.85 |
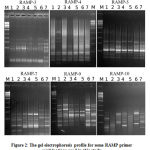 |
Figure 2: The gel electrophoresis profile for some RAMP primer combinations used in this study |
The study of Saleh 47 used the RAMP assay to evaluate the phylogenetic analysis of arthrocnemum macrostachyum. The RAMP markers and the percentages for PCR products are amplified in the three genotypes tested. The use of 21 primer combinations resulted in 145 scorable bands, of which 139 (95.862%) were polymorphic, with an average of 6,619 amplicons per primer. Previously, RAMP markers were used to evaluate biodiversity and resemblance between the 40 accessions of Leymus Hochst. From that research, 24 (20%) of the 120 RAMP primer combinations studied generated visible polymorphic bands. Of the 192 bands amplified by these 24 primer combinations, 179 (93.23%) were discovered to be polymorphic (average 7.64 bands) 48.
The RAMP assay binary data was used to construct a phylogenetic tree between different Chenopodium ambrosioides plant samples, to infer genetic similarity. The phylogenetic tree was split into two major clusters, with samples 6, 7, 2 and 1 in one cluster and samples 3, 4 and 5 in another. The first cluster separated from the common ancestor at 80% similarity, while the other group separated at 85% similarity (Figure 3). The genetic similarity between different plant samples ranged from 74% between sample 7 and samples 4 and 5, to 86% between sample 5 and samples 3 and 4 (Table 7).
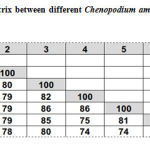 |
Table 7: Similarity matrix between different Chenopodium ambrosioides |
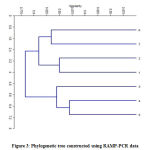 |
Figure 3: Phylogenetic tree constructed using RAMP-PCR data |
Conclusion
Generally, there is a correlation between the quantitative outcomes of phenolic and flavonoid compounds, which have been observed to be particularly related to the antioxidant activity (DPPH scavenging) of the C. ambrosioides sample. Methanol extract from the leaves of the plant have been discovered to be quite efficient at inhibiting bacteria and fungi. The RAMP-PCR assay proved it efficiency in studying the diversity of C. ambrosioides, providing a high number of polymorphic PCR patterns with low cost and good reliability. This study demonstrates the usefulness of using the RAMP-PCR assay in the phylogenetic studying of C. ambrosioides and related species.
Acknowledgment and Funding
The author is deeply grateful to and acknowledge the Deanship of Scientific Research in Taif University, Saudi Arabia, for its financial support for Project (1-439-6077).
Competing Interests
The author declares that no conflicts of interest exist.
Author Contributions
Fayez Althobaiti – planning, acquisition of data, analysis and interpretation of data, drafting of the manuscript
References
- Sherif E: Floristic composition and vegetation analysis of wild legumes in Taif district, Saudi Arabia. International Research Journal of Agricultural Science and Soil Science, 2015; 5:74-80.
- Farrag H, Al-Sodany Y, Otiby FG: Phytoremediation and accumulation characteristics of heavy metals by some plants in wadi Alargy-Wetland, Taif-KSA. World Applied Sciences Journal, 2013; 28:644-653.
- WHO WHO: WHO Sites. WHO Traditional Medicine Strategy 2014 – 2023. (WHO, 2014) Available in the World Wide Web: http://www.who.int/medicines/publications/traditional/trm_strategy14_23/en/ . 2014.
- Alvarez-Jubete L, Wijngaard H, Arendt EK, Gallagher E: Polyphenol composition and in vitro antioxidant activity of amaranth, quinoa buckwheat and wheat as affected by sprouting and baking. Food Chemistry, 2010; 119:770-778.
- Tungmunnithum D, Thongboonyou A, Pholboon A, Yangsabai A: medicines Flavonoids and Other Phenolic Compounds from Medicinal Plants for Pharmaceutical and Medical Aspects: An Overview. Medicines, 2018; 5.
- Gawlik-Dziki U: Effect of hydrothermal treatment on the antioxidant properties of broccoli (Brassica oleracea var. botrytis italica) florets. Food Chemistry, 2008; 109:393-401.
- Hallal A, Benali S, Mohammed M, Bekkouche K, Larhsini M, Abderrahman C, Abderrahmane R, Abbad A, Abdouni M: Evaluation of the Analgesic and Antipyretic Activities of Chenopodium ambrosioides L. Asian Journal of EXP. Biological Sciences, 2010; 1:189.
- TrivellatoGrassi L, Malheiros A, Meyre-Silva C, da Silva Buss Z, Monguilhott ED, Fröde TS, da Silva KABS, de Souza MM: From popular use to pharmacological validation: A study of the anti-inflammatory, anti-nociceptive and healing effects of Chenopodium ambrosioides extract. Journal of Ethnopharmacology, 2013; 145:127-138.
- Herrera D, Vega-Gálvez J, Jorquera A, Martínez I, Aranda M, Delatorre-Herrera J, Vega-Galvez A, Jorquera E, Quispe I, Martínez E: Antimicrobial Potential and Phytochemical Content of Six Diverse Sources of Quinoa Seeds (Chenopodium Quinoa Willd.). Agricultural Sciences, 2014; 5:1015-1024.
- Carvalho AM: Plantas y sabiduría popular del Parque Natural de Montesinho : un estudio etnobotánico en Portugal. 2010.
- Okeke IN, Laxminarayan R, Bhutta ZA, Duse AG, Jenkins P, O’Brien TF, Pablos-Mendez A, Klugman KP: Antimicrobial resistance in developing countries. Part I: recent trends and current status. The Lancet Infectious Diseases, 2005; 5:481-493.
- Ríos JL, Recio MC: Medicinal plants and antimicrobial activity. Journal of Ethnopharmacology, 2005; 100:80-84.
- Fraser MP, Yue ZW, Buzcu B: Source apportionment of fine particulate matter in Houston, TX, using organic molecular markers. Atmospheric Environment, 2003; 37:2117-2123.
- White TL, Adams WT, Neale DB: Genetic markers-morphological, biochemical and molecular markers. . Book: Forest Genetics, 53-74., 2007.
- Alsamman A, Ibrahim S, Hamwieh A: KASPspoon: an in vitro and in silico PCR analysis tool for high-throughput SNP genotyping. Bioinformatics, 2019; 35.
- Habib P, Alsamman A, Hamwieh A: BioAnalyzer: Bioinformatic Software of Routinely Used Tools for Analysis of Genomic Data. Advances in Bioscience and Biotechnology, 2019; 10:33-41.
- Wu K-S, Tanksley SD: Abundance, polymorphism and genetic mapping of microsatellites in rice. Molecular and General Genetics MGG, 1993; 241:225-235.
- Panaud O, Chen X, McCouch SR: Development of microsatellite markers and characterization of simple sequence length polymorphism (SSLP) in rice (Oryza sativa L.). Molecular and General Genetics MGG, 1996; 252:597-607.
- Sanchez de la Hoz MP, Davila JA, Loarce Y, Ferrer E: Simple sequence repeat primers used in polymerase chain reaction amplifications to study genetic diversity in barley. Genome, 1996; 39:112-117.
- Hoang TM, Filippis L, Le X: Salt Tolerance and Screening for Genetic Changes in Rice Mutants after Gamma Irradiation Using RAPD and Microsatellite (RAMP) Markers. The Open Horticulture Journal, 2009; 2.
- Liu X, Yang Y, He C, Li H, Zhang H: A RAMP marker linked to the tobacco black shank resistant gene. African Journal of Biotechnology, 2010; 8.
- Avila-Treviño JA, Muñoz-Alemán JM, Pérez-Molphe-Balch E, Rodríguez-Sahagún A, Morales-Domínguez JF: In vitro propagation from bud and apex explants of Moringa oleifera and evaluation of the genetic stability with RAMP marker. South African Journal of Botany, 2017; 108:149-156.
- Qawasmeh A, Obied H, Raman A, Wheatley W: Influence of Fungal Endophyte Infection on Phenolic Content and Antioxidant Activity in Grasses: Interaction between Lolium perenne and Different Strains of Neotyphodium lolii. Journal of agricultural and food chemistry, 2012; 60:3381-3388.
- Eghdami A, Sadeghi F: Determination of Total Phenolic and Flavonoids Contents in Methanolic and Aqueous Extract of Achillea Millefolium. Org. Chem. J., 2010; 2.
- Zuo Y, Chen H, Deng Y: Simultaneous determination of catechins, caffeine and gallic acids in green, Oolong, black and pu-erh teas using HPLC with a photodiode array detector. Talanta, 2002; 57:307-316.
- Goupy P, Hugues M, Boivin P, Amiot MJ: Antioxidant composition and activity of barley (Hordeum vulgare) and malt extracts and of isolated phenolic compounds. 1999; 79:1625-1634.
- Jena S, Ray A, Banerjee A, Sahoo A, Nasim N, Sahoo S, Kar B, Patnaik J, Panda P, Nayak S: Chemical composition and antioxidant activity of essential oil from leaves and rhizomes of Curcuma angustifolia Roxb. Natural Product Research, 2017; 31.
- Ibrahim HS, Eldehna WM, Abdel-Aziz HA, Elaasser MM, Abdel-Aziz MM: Improvement of antibacterial activity of some sulfa drugs through linkage to certain phthalazin-1(2H)-one scaffolds. European Journal of Medicinal Chemistry, 2014; 85:480-486.
- Abdelrahman MA, Salama I, Gomaa MS, Elaasser MM, Abdel-Aziz MM, Soliman DH: Design, synthesis and 2D QSAR study of novel pyridine and quinolone hydrazone derivatives as potential antimicrobial and antitubercular agents. European Journal of Medicinal Chemistry, 2017; 138:698-714.
- CLSI: Clinical and Laboratory Standards Institute. Performance standard for antimicrobial susceptibility testing. Twentieth informational supplement. M100-S22. Wayne: PA., 2012.
- Ahmed HEA, Ihmaid SK, Omar AM, Shehata AM, Rateb HS, Zayed MF, Ahmed S, Elaasser MM: Design, synthesis, molecular docking of new lipophilic acetamide derivatives affording potential anticancer and antimicrobial agents. Bioorganic Chemistry, 2018; 76:332-342.
- SAS: Statistical Analysis System Institute. SAS User’s Guide: Statistics (Version 9.1.3); SAS Institute Inc.: Cary, NC, USA. 2007.
- Hammer O, Harper D, Ryan P: PAST: Paleontological Statistics Software Package for Education and Data Analysis. Palaeontologia Electronica, 2001; 4:1-9.
- Vanin AB, Orlando T, Piazza SP, Puton BMS, Cansian RL, Oliveira D, Paroul N: Antimicrobial and antioxidant activities of clove essential oil and eugenyl acetate produced by enzymatic esterification. Appl Biochem Biotechnol, 2014; 174:1286-1298.
- de Mejía EG, Song YS, Heck CI, Ramírez-Mares M: Yerba mate tea (Ilex paraguariensis): Phenolics, antioxidant capacity and in vitro inhibition of colon cancer cell proliferation. Journal of Functional Foods, 2010; 2:23-34.
- Pereira OR, Macias RIR, Perez MJ, Marin JJG, Cardoso SM: Protective effects of phenolic constituents from Cytisus multiflorus, Lamium album L. and Thymus citriodorus on liver cells. Journal of Functional Foods, 2013; 5:1170-1179.
- Schubert A, Pereira DF, Zanin FF, Alves SH, Beck A, M.L., C: omparison of antioxidant activities and total polyphenolic and methylxanthine contents between the unripe fruit and leaves of Ilex paraguariensis A. St. Hil. . Pharmazie, 2007; 62:876–880.
- Mustafa RA, Abdul Hamid A, Mohamed S, Bakar FA: Total phenolic compounds, flavonoids, and radical scavenging activity of 21 selected tropical plants. J Food Sci, 2010; 75:C28-35.
- Jayaprakasha GK, Patil BS: In vitro evaluation of the antioxidant activities in fruit extracts from citron and blood orange. Food Chemistry, 2007; 101:410-418.
- Hung TM, Na M, Thuong PT, Su ND, Sok D, Song KS, Seong YH, Bae K: Antioxidant activity of caffeoyl quinic acid derivatives from the roots of Dipsacus asper Wall. Journal of Ethnopharmacology, 2006; 108:188-192.
- Nakajima Y, Shimazawa M, Mishima S, Hara H: Water extract of propolis and its main constituents, caffeoylquinic acid derivatives, exert neuroprotective effects via antioxidant actions. Life Sciences, 2007; 80:370-377.
- Ooi KL, Muhammad TST, Tan ML, Sulaiman SF: Cytotoxic, apoptotic and anti-α-glucosidase activities of 3,4-di-O-caffeoyl quinic acid, an antioxidant isolated from the polyphenolic-rich extract of Elephantopus mollis Kunth. Journal of Ethnopharmacology, 2011; 135:685-695.
- Kaur M, Sharma S, Garg S, Arora M: Study of Antibacterial Activity of Chenopodium album Leaves Extract. International Journal of Pharmacognosy and Phytochemical Research, 2018; 10.
- Essaidi I, Brahmi Z, Snoussi A, Ben Haj Koubaier H, Casabianca H, Abe N, El Omri A, Chaabouni MM, Bouzouita N: Phytochemical investigation of Tunisian Salicornia herbacea L., antioxidant, antimicrobial and cytochrome P450 (CYPs) inhibitory activities of its methanol extract. Food Control, 2013; 32:125-133.
- Gawlik-Dziki U, Świeca M, Sułkowski M, Dziki D, Baraniak B, Czyż J: Antioxidant and anticancer activities of Chenopodium quinoa leaves extracts – In vitro study. Food and Chemical Toxicology, 2013; 57:154-160.
- Elif Korcan S, Aksoy O, Feyza Erdoğmuş S, Hakkı Ciğerci İ, Konuk M: Evaluation of antibacterial, antioxidant and DNA protective capacity of Chenopodium album’s ethanolic leaf extract. Chemosphere, 2013; 90:374-379.
- Saleh B: Phylogenetic Assessment Of Arthrocnemum Macrostachyum (Chenopodiaceae) Genotypes, Using Ramp Markers. Polish Botanical Journal, 2015; 60.
- Yang R-W, Zhou Y-H, Zhang Y, Zheng Y-L, Ding C-B: The Genetic Diversity Among Leymus Species Based on Random Amplified Microsatellite Polymorphism (RAMP). Genetic Resources and Crop Evolution, 2006; 53:139-144.

