
Manuscript accepted on :11-05-2020
Published online on: 10-06-2020
Plagiarism Check: Yes
Reviewed by: Kushagra Kulshrestha
Second Review by: Tukaram Dudhamal
Final Approval by: Dr. H Fai Poon
Shubham Atal, Akanksha Mathur* , Balakrishnan S
Department of Pharmacology, AIIMS Bhopal, Saket Nagar, Madhya Pradesh, India, 462020
Corresponding Author E-mail : akanksha.mathur1@gmail.com
DOI : https://dx.doi.org/10.13005/bpj/1941
Abstract
Cost of drug therapy is a major concern for patients in developing countries. Indian government has launched a generic drug (‘Jan Aushadhi’) scheme to provide cheaper medicines. This cost minimization analysis was carried out to assess cost of treatment regimens for common bacterial infections, and variations in costs arising due to generic or branded prescribing. Various regimens recommended for common bacterial infections were noted from the national guidelines for antimicrobial use in India. The unit prices of antibacterial formulations available under the generic drug scheme were noted, and the median, maximum – minimum unit prices of branded formulations were calculated from a recognised commercial drug directory. Total cost of therapy for each regimen, and the variations in cost with generic and branded therapy were then calculated. Out of 68 regimens analysed for 24 bacterial infections, the cheapest regimen was for treating cholera (INR 3.48 - generic, INR 8.7 - median branded prescription) whereas the costliest was for infective endocarditis (INR 3912 – generic, INR 11823.84 – median branded prescription). Treatment costs varied significantly with prescription of maximum and minimum priced brands, ranging from 69.81% to 14900%. Branded therapy was more than 3 times costlier than generic therapy in 36 (52.9 %) regimens. In 51 (75 %) regimens, the variation in cost of treatment between maximum and minimum priced branded therapy was more than 100%, while in 21 (30.9 %) regimens it was more than 1000 %. Significant variations in cost of therapy due to differences in prescribing place a direct burden on the patients’ pockets, and should be considered by physicians.
Keywords
Brand; Cost Minimization Analysis; Generic; Infections; Price Variations
Download this article as:| Copy the following to cite this article: Atal S, Mathur A, Balakrishnan S. Cost of Treating Bacterial Infections in India: A Cost Minimization Analysis to Assess Price Variations. Biomed Pharmacol J 2020;13(2). |
| Copy the following to cite this URL: Atal S, Mathur A, Balakrishnan S. Cost of Treating Bacterial Infections in India: A Cost Minimization Analysis to Assess Price Variations. Biomed Pharmacol J 2020;13(2). Available from: https://bit.ly/2BJ7mV5 |
Introduction
Infectious diseases remain one of the major health care problems in India. Besides endemic diseases like malaria, tuberculosis and tropical diseases, Indian population remains highly vulnerable to many common bacterial infections. Due to low socioeconomic status, poor sanitation, inadequate hygiene, scarcity of resources, and general lack of awareness, the transmission of infections is easy particularly in rural areas and urban slums. According to a study conducted by WHO, India has witnessed a 66% increase in the use of antibiotics during the past 10 years. This is further compounded by rising antimicrobial resistance to affordable first line treatments.1
India spends approximately 1% of its GDP on health care.2 Per capita income of the country is still low, ranking 126 out of 200 countries in the world.3 Health funding is disappointing and recent efforts to provide subsidized health care through initiating insurance schemes remain inadequate. Medicine expenses are generally uncovered; mostly borne as out of pocket expenditure by patients.4 They are often disproportionately high compared to the income for most and become a significant financial burden especially for large masses of people below or around the poverty line.5 Out of the total health expenditure, more than 50% is spent on medicines; this is complicated by the availability of multiple branded and generic versions of drugs. Generic drugs are expected to provide the same efficacy as the branded versions with the same active pharmaceutical components, but at lower costs.6
High costs of treatment limit patients’ compliance, increases morbidity and mortality, and may contribute to antimicrobial resistance. Price variation among various brands are known to exist in India.7-11 The government has seriously attempted to curtail unjustifiable pricing of drugs through the Drug Price Control Order (DPCO) 2013, which has been subsequently amended. The Pradhan Mantri Bhartiya Janaushadhi Pariyojana (PMBJP) or the Jan Aushadhi Scheme (JAS), as it is commonly referred to, was launched in 2015 as another such step to make generic medicines available at affordable prices.12 However, questions have been raised as prices of some commonly used generic drugs under JAS are higher than their corresponding brands available in the market.5
‘Cost-minimization analysis’ is a tool used in pharmacoeconomics to compare the costs for alternative courses of treatment or therapies which have equivalent clinical effectiveness. It involves cost calculations to identify the least expensive drug or regimen or therapeutic modality.13 A novel therapeutic product, innovator brand, is launched in market under patent protection. Other companies can launch this product only after expiry of patent, and satisfactory bioequivalence studies. They are then termed as generic drugs. Currently, almost all generic drugs are also being sold in India under brand names, the branded-generics, because patent protection was not applicable in India till January 2005.14 These generics are expected to provide a same therapeutic outcome. More than 1,00,000 brands of various medicines are presently sold in India. Analysis of costs of different treatment regimens with these drugs can highlight the phenomenon of ‘inter-brand price variation’, which can pose moral and ethical concerns to prescribers along with financial constraints for patients. Previous studies have revealed that prices of various antimicrobial brands in India show significant variation. The mean percentage price variations for antibiotics have been shown to 38% and 93% respectively in two similar studies.9,15 A recent study conducted in 2017 showed a mean price variation of 82% for antibiotics.[10] Other classes of drugs like antiplatelets, anti-hyperglycaemics, antihypertensives, drugs used in neuropsychiatric illnesses also show such wide price variation among formulations manufactured by different pharmaceutical companies.11,16-18
‘National Treatment Guidelines For Antimicrobial Use In Infectious Diseases’ were first published in 2016 by the National Centre for Disease Control, MoHFW, India19 and more recently ‘Treatment Guidelines for Antimicrobial Use in Common Syndromes’ (2nd edition) have been released by the ICMR in 2019.20 It is expected that treatment of bacterial infections in the country should be done using the regimes recommended in these guidelines. This gives us a unique opportunity to compare the costs of the different regimens for bacterial infections, and also analyse the cost variations according to use of branded or generic drugs. To our knowledge, such a cost minimization analysis of regimens included in national treatment guidelines for antimicrobial use in infectious diseases has not been published in India.
Materials and Methods
The study was carried out as a cross sectional descriptive study using data from secondary sources. National treatment guidelines for antimicrobial use in infectious diseases19, 20 published in 2016 and 2019 were considered as reference for the treatment regimens for bacterial infections. The first line antibacterial regimens as well as alternative regimens for commonly occurring bacterial infections across different organ systems were taken into account. The name of drug, dose, dosage form, frequency and duration of administration recommended in these regimens were noted. The average body weight of 60 kg for an adult was assumed for the drugs prescribed by mg/kg body weight. The regimens with unspecified duration of treatment or dosage form or frequency were excluded. Permission to conduct the study was obtained from the Institutional Human Ethics Committee (IHEC – LOP no. IM0219 dated 10.06.19).
The commercial drug directory – Current Index of Monthly Specialities, CIMS (July-September 2019), was referred to for the prices of branded drugs available across the country. CIMS is considered a trusted and authentic source of commercial drug information and was chosen as the single source to ensure uniformity of price data, and avoid repetition or ambiguity which may arise due to use of multiple sources. The median price was found by listing the prices of all the different brands available for a particular drug formulation. Median was chosen as the measure of central tendency due to presence of extreme values in brand prices of these formulations. Price variation calculations for drug formulations having less than a minimum of five available brands were not included in the final observation as it was deemed unjustified to comment on price variations in such small samples. The latest generic drug price list of the government scheme (JAS) was used for noting generic prices. The (single) unit prices for all formulations were taken.
Number of brands available for identified formulations, unit prices of different brands of the same formulations, maximum and minimum brand prices and the generic price (if available) for each formulation, median brand price of each formulation were recorded. Total cost of drug therapy for each treatment regimen with generic, median / minimum / maximum brand prices was calculated. Percentage variations between cost of treatment (with median brand and generic prices) between different regimens for each infection were then calculated, along with variations in cost of therapy for each regimen using prices for generic and branded drugs (median). The percentage variation between maximum and minimum cost of treatment with branded drugs was calculated using the formula18:
The data obtained was recorded in Microsoft Excel spreadsheet. Descriptive statistics were used to evaluate the data in terms of frequencies, percentage, range and median along with appropriate graphical displays using SPSS version 22.
Results
Twenty four common infectious diseases were analysed across organ systems classified into gastrointestinal system (GIT), respiratory system (RS), cardiovascular system (CVS) and central nervous system (CNS) and miscellaneous. There were 68 regimens listed for these infections. More than 500 brands were found for drugs like cefixime, azithromycin and ciprofloxacin. Tablet cefixime 200 mg was found to have the maximum number of brands (643) and injection meropenem 1 gm had the highest median brand price (INR 1499.5, USD 19.97; @ 1 USD ̴ INR 75) whereas tablet metronidazole 400 mg had the lowest median brand price (INR 0.63, USD 0.008). (Table 1)
Table 1: Unit prices of drug formulations
| S.No. | Name of drug formulation | Dosage | No. of brands | Unit price (INR) | |||
| Median brand price | Max brand price | Min brand price | Generic price as per JAS | ||||
| 1. | Inj. Ceftriaxone | 2 gm | 15 | 135 | 171 | 100.7 | NA |
| 2. | Tab. Cefixime | 200mg | 643 | 6 | 49 | 0.78 | 4.15 |
| 3. | Tab. Azithromycin | 1 gm | 15 | 36 | 70 | 30 | NA |
| 4. | Tab. Azithromycin | 500mg | 609 | 22 | 80 | 1.98 | 8.06 |
| 5. | Tab. Cotrimoxazole | 960 mg | 61 | 1.39 | 2 | 1 | NA |
| 6. | Capsule Doxycycline | 100mg | 79 | 2.9 | 7.8 | 0.6 | 1.16 |
| 7. | Tab. Ciprofloxacin | 500 mg | 546 | 5.94 | 13.75 | 0.6 | 1.7 |
| 8. | Inj. Piperacillin-Tazobactam | 4.5gm | 229 | 450 | 984 | 14.87 | 164.21 |
| 9. | Inj. Imipenem | 500 mg | 9 | 1310 | 1700 | 538 | 385 |
| 10. | Inj. Meropenem | 1 gm | 20 | 1499.5 | 2889 | 592 | 214.6 |
| 11. | Tab. Metronidazole | 400 mg | 28 | 0.63 | 1.9 | 0.45 | 0.385 |
| 12. | Tab. Amoxycillin-Clavulanate | 625mg | 346 | 27 | 54 | 1.63 | 8.7 |
| 13. | Inj. Amoxicillin-Clavulanate | 1.2gm | 125 | 170 | 250 | 90 | 55 |
| 14. | Inj. Vancomycin | 1 gm | 15 | 700 | 778 | 450 | NA |
| 15. | Inj. Cefotaxime | 1 gm | 126 | 38.57 | 110 | 22.3 | 15.93 |
| 16. | Inj. Ampicillin | 1gm | 10 | 21.67 | 25.5 | 14 | 7.2 |
| 17. | Inj. Clindamycin | 600mg | 14 | 149.5 | 245 | 120 | NA |
| 18. | Tab. Amoxycillin | 500mg | 264 | 6.3 | 10.38 | 2.4 | 2.62 |
| 19. | Tab. Moxifloxacin | 400 mg | 17 | 45 | 75 | 5.5 | 12.6 |
| 20. | Tab. Nitrofurantoin | 100 mg | 8 | 6.03 | 10.75 | 1 | 1.52 |
| 21. | Tab. Cefuroxime | 250 mg | 349 | 26 | 50 | 2.6 | 5.6 |
| 22. | Inj. Amikacin | 500mg | 20 | 62.45 | 84.7 | 38.55 | 25.2 |
| 23. | Inj. Gentamycin | 80mg | 63 | 7.6 | 12 | 4 | 2.25 |
(*NA- not available)
All drug formulations recommended in national treatment guidelines were not covered in the JAS; inj ceftriaxone, tab azithromycin, tab cotrimoxazole, inj vancomycin and tab clindamycin were notably unavailable. Imipenem was the most expensive drug under JAS (INR 385, USD 5.5), still 3 times cheaper than the median brand price. Interestingly, for many of the drugs like cefixime, azithromycin, doxycyline, ciprofloxacin, piperacillin-tazobactam, amoxycillin-clavulanate, moxifloxacin, nitrofurantoin, cefuroxime, the generic prices were found to be higher than many cheaper branded alternatives. The cheapest treatment regimen was for cholera (INR 3.48, USD 0.05 – generic cost, INR 8.7, USD 0.12 – median branded cost) whereas the costliest was for infective endocarditis (INR 3912, USD 52.1 – generic cost, INR 11823.84, USD 157.44 – median branded cost). Table 2 shows the cost of antimicrobial therapy for different regimens, and various cost variations for common GI infections.
Table 2: Cost of treatment of infections of GIT and variations
| S. N. | Infection | Regimens | Cost of treatment (INR) | Variation (%) | ||||
| Med.
Brand Price |
Max brand price | Min
brand price |
Gen.
price |
Max -Min | Med -Generic | |||
| 1. | Bacterial dysentery | Inj. Ceftriaxone 2g IV OD for 5 days | 675 | 855 | 503.5 | 225 | 69.81 | 200
|
| Tab. Cefixime 600 mg/ day orally for 5 days | 90 | 735 | 11.7 | 62.25 | 6182.05 | 44.57
|
||
| Tab. Azithromycin 1 gm orally OD for 3 days | 108 | 350 | 150 | 48.36 | 133.33 | 123.32 | ||
| 2. | Enteric fever | Tab. Cefixime 1200 mg/ day orally for 14 days | 1,239 | 1,851.78 | 625.8 | 348.6 | 195.9 | 255.42 |
| Tab. Azithromycin 500mg orally BD for 7 days | 308 | 1,120 | 27.72 | 112.84 | 3940.4 | 172.95 | ||
| Inj. Ceftriaxone 2g IV BD for 14 days | 3,780 | 4,788 | 2,819.6 | 1,260 | 69.81 | 200 | ||
| Tab. Cotrimoxazole
960 mg orally BD for 14 days |
38.92 | 56 | 28 | 68.32 | 100 | -43.03 | ||
| 3. | Cholera | Tab. Doxycycline 300mg stat | 8.7 | 23.4 | 1.8 | 3.48 | 1200 | 150 |
| Tab. Azithromycin 1 gm orally stat | 36 | 70 | 30 | 16.12 | 133.33 | 123.32 | ||
| Tab. Ciprofloxacin 500 mg orally BD for 3 days | 35.64 | 82.5 | 3.60 | 10.2 | 2191.66 | 249.41 | ||
| 4. | Biliary tract infections | Inj. Ceftriaxone 2g IV OD for 7 days | 945 | 1,197 | 704.9 | 315. | 69.81 | 200 |
| Inj. Piperacillin-Tazobactam 4.5gm IV TDS for 7 days | 9,450 | 20,664 | 312.27 | 3,448.4 | 6517.35 | 174.03 | ||
| Inj. Imipenem 500 mg IV QID for 7 days | 36,680 | 47,600 | 15,064 | 10,780 | 215.98 | 240.25 | ||
| Inj. Meropenem 1gm IV TDS for 7 days | 31,489 | 60,669 | 12,432 | 4,506.6 | 388 | 598.74 | ||
| 5. | Hospital acquired diarrhea | Tab. Metronidazole
400 mg TDS for 10 days |
18.90 | 57 | 13.5 | 11.55 | 322.22 | 63.63 |
| 6. | Diverti-culitis:
Mild |
Tab. Amoxycillin-Clavulanate 625 mg orally TDS for 7 days | 567 | 1,134 | 34.23 | 182.7 | 3212.88 | 210.34 |
The carbapenem based regimens for biliary tract infections were the most expensive. Oral regimens were expectedly cheaper than the ones containing injectables, as were the regimens of shorter duration. Second line regimens of azithromycin and cotrimoxazole were cheaper across all calculated costs than the first line cefixime based regimen. For regimens containing cefixime in bacillary dysentery, azithromycin and cotrimoxazole in enteric fever, doxycycline and ciprofloxacin in cholera, cheaper branded alternatives were available which provided lower cost of treatment with minimum priced brands compared to treatment with generics. Cost variation between maximum and minimum price branded prescribing ranged from 69.81% to a huge 6517.35%. Variation between median branded and generic cost of treatment also showed wide variations; almost 600 % for meropenem based regimen for biliary tract infections, making it seven times more expensive.
Table 3 shows cost variations for CNS and CVS infections. For infective endocarditis, the ampicillin and gentamicin regimen was significantly cheaper, using branded or generic formulations. The meropenem based regimens for brain abscess and subdural empyema were the costliest while ceftriaxone based regimen for treating acute bacterial meningitis was the least costly. The maximum cost variation between median branded and generic prescribing was 936 % for the cefotaxime-vacomycin regimen for acute bacterial meningitis, and the least variation was 132.74% for vancomycin-gentamycin for acute infective endocarditis, which still makes branded prescribing more than twice as expensive as generic prescribing.
Table 3: Cost of treatment of infections of CNS-CVS and variations
| S.N | Infection | Regimen | Cost of treatment (INR) | Variation (%) | ||||
| Med.
Brand price |
Max brand price | Min brand price | Generic | Max-
Min |
Med-
Gen |
|||
| 1. | Acute bacterial meningitis | Inj. Ceftriaxone 2g IV BD for 10 days | 2,700 | 3,420 | 2,014 | 900 | 69.81 | 200 |
| Inj Ceftriaxone 2gm BD and Vancomycin 15 mg/kg IV 8 hrly for 10-14 days | 23,700 | 26,760 | 15,514 | 5,430 | 72.48 | 336.
46 |
||
| Inj Cefotaxime 2 gm IV QID and Vancomycin 15 mg/kg 8 hrly for 10-14 days | 22,545.6 | 27,740 | 14,392 | 2,174.40 | 92.74 | 936.
86 |
||
| 2. | Meningitis-Post surgery or head trauma | Inj. Meropenem 2gm IV 8 hourly and Vancomycin 15mg/kg IV 8 hourly for 14 days | 1,55,358 | 2,75,352 | 68,628 | 24,368.4 | 301.2 | 537.
53 |
| 3. | Brain abscess, Subdural empyema | Inj. Meropenem 2gm IV 8 hourly for 60 days | 5,39,820 | 10,40,040 | 2,84,160 | 77,256 | 266 | 598.
74 |
| Inj. Ceftriaxone 2gm IV BD and metronidazole 400 mg TDS for 4-6 weeks | 7,617 | 9,644 | 5,696 | 2,551.92 | 69 | 198 | ||
| 4. | Infective endocarditis | Inj. Vancomycin 15mg/kg IV 12 hourly and Gentamicin 1mg/kg IM or IV 8 hourly for 6 weeks | 59,702.2 | 66,864 | 38,304 | 25,651.5 | 74.56 | 132.
74 |
| Inj. Ampicillin 2gm iv 4h + Gentamycin 1mg/kg IM or IV 8h for 6 weeks | 11,823.8 | 13,356 | 7,560 | 3,912.3 | 76.67 | 202.
22
|
||
| Inj Ampicillin 2gm IV q4h +ceftriaxone 2gm IV q24h + gentamicin 1mg/kg IV q8h for 2 weeks | 5,849.76 | 7,182.00 | 3,929.80 | 1,934.10 | 82.75
|
202.
41
|
||
Among the respiratory infections, as described in table 4, the piperacillin tazobactam and clindamycin based regimen for community acquired pneumonia, lung abscess and empyema was the costliest, and also had the highest brand price variation. Oral azithromycin regimen for community acquired pneumonia was significantly cheaper in all calculated costs compared to the 3 injectable regimens, which is expected. Interestingly, the cost of generic treatment with piperacillin tazobactam was much higher than the minimum priced brand treatment; the same was also seen with azithromycin in acute pharyngitis. The alternative regimens of oral moxifloxacin and cefpodoxime for rhinosinusitis were cheaper than the first line oral amoxicillin-clavulanate, and also showed staggering cost variations (14900 and 2579 % respectively). Median brand price based costs of treatment were found to be more than 2 times to 4 times more expensive than generic treatment costs.
Table 4: Cost of treatment of respiratory infections and variations
| S. N | Infection | Regimen | Cost of treatment (INR) | Variation (%) | ||||
| Med.
Brand price |
Max brand price | Min brand price | Gen.
Price |
Max-Min | Med-Gen. | |||
| 1. | Community acquired Pneumonia (mild – severe cases) | Tab. Amoxycillin 500mg TDS orally for 5 days | 94.5 | 155.7 | 36 | 39.3 | 332.5 | 140.
45 |
| Inj. Amoxycillin-clavulanate 1.2 g IV TDS for 5 days | 2550 | 3750 | 1350 | 825 | 177.
77 |
209 | ||
| Inj. Ceftriaxone 2g IV OD for 5 days | 675 | 855 | 503.5 | 225 | 69.81 | 200 | ||
| Inj. Piperacillin-Tazobactam 4.5gm IV
6 hourly for 5 days |
9,000 | 19680 | 297.4 | 3284.2 | 6517.3 | 174 | ||
| Inj Ceftriaxone 2g OD + azithromycin 500mg OD for 5 days | 785 | 1255 | 114.4 | 265.3 | 997.02 | 195.89 | ||
| Tab Coamoxyclav 625 mg TDS + azithromycin 500 mg OD for 5 days | 515 | 1210 | 34.35 | 170.9 | 3422.56 | 201.34 | ||
| 2. | Lung abscess, Empyema | Inj. Piperacillin-Tazobactam 4.5gm IV
6 hourly for 3 weeks |
37,800 | 82656 | 1249 | 13793 | 6517.3 | 174 |
| Inj. Piperacillin-Tazobactam 4.5gm IV 6hourly and Clindamycin 600mg IV 8 hourly for 3 weeks |
47,218
|
98091 | 8809 | 16,741 | 1013.5 | 182 | ||
| 3. | Acute pharyngitis (Strepto-coccal) | Tab. Amoxicillin 500 mg orally TDS for 10 days | 189 | 311.4 | 72 | 78.6 | 332.5 | 140.
45 |
| Tab. Azithromycin 500mg orally OD for 5 days | 110 | 400 | 9.9 | 40.3 | 3940.4 | 173 | ||
| Tab Amoxycillin 500-1000mg tds for 5-7 days | 94.5 | 155.7 | 36 | 39.3 | 332.5 | 140.45 | ||
| Inj Benzathine Penicillin 1.2 M IU im single dose for 5-7 days | 60.1 | 61.15 | 57.75 | NA | 5.88 | NA | ||
| 4. | Acute bacterial rhinosinusitis | Tab. Amoxicillin-clavulanate 1gm orally BD for 7 days | 588.7 | 840 | 306.88 | 147 | 173.72 | 300.
47 |
| Tab. Moxifloxacin 400mg orally OD for 5days | 225 | 375 | 2.5 | 63 | 14,900 | 257.
14 |
||
| Inj Ceftriaxone 2 gm OD for 5-7 days | 675 | 855 | 503.5 | 225 | 34.06 | 200 | ||
| Tab Cefpodoxime 200mg BD for 5-7 days | 200 | 522.5 | 19.5 | 69.2 | 2579.48 | 189.01 | ||
| 5. | Acute bacterial exacerbation of COPD | Tab. Amoxicillin-clavulanate 1gm orally BD for 7 days | 588.7 | 840 | 306.88 | 147 | 173.72 | 300.
47 |
| Tab. Azithromycin 500 mg orally OD for 3 days | 66 | 240 | 5.94 | 24.18 | 3940.4 | 173 | ||
Table 5 includes analysis of miscellaneous infections of skin, ENT and genitourinary tract. Meropenem for complicated pyelonephritis was the most expensive regimen while cotrimoxazole for uncomplicated pyelonephritis was the least expensive. For cellulitis and furunculosis, second line regimen of oral amoxicillin-clavulanate was significantly cheaper across all costs; ceftriaxone being the cheapest among injectable regimens. The same was seen with oral cotrimoxazole and injectable amikacin regimens for uncomplicated and complicated cystitis respectively. For many regimens, it was found that branded alternatives cheaper than generics were available. Inter-brand cost variations were similar in magnitude as for other infections, highest being for amoxicillin-clavulanate for acute otitis media (8081 %). Variations in median branded and generic based regimen costs varied from around 100 – 600 %.
Table 5: Cost of treatment of miscellaneous infections and variations
| S. N | Infection | Regimen | Cost of treatment (INR) | Variation (%) | ||||
| Median Brand price | Max brand price | Min brand price | Generic | Max
– Min |
Med-
Gen |
|||
| 1 | Cellulitis | Inj. Amoxicillin-Clavulanate 1.2gm IV TDS for 7 days | 3570 | 5250 | 1890 | 1155 | 177.
77 |
209.09 |
| Tab. Amoxycillin-Clavulanate 625mg orally TDS for 7 days | 567 | 1134 | 34.23 | 182.7 | 3212.88 | 210.34 | ||
| Inj. Ceftriaxone 2g IV OD for 7 days | 945 | 1197 | 704.9 | 315 | 69.81 | 200 | ||
| Inj. Clindamycin 600 IV TDS for 7 days | 3139.5 | 5145 | 2520 | 982.8 | 104.
16 |
219.44 | ||
| 2 | Furunculosis | Inj. Amoxicillin-Clavulanate 1.2gm IV TDS for 7 days | 3570 | 5250 | 1890 | 1155 | 177.
77 |
209.09 |
| Tab. Amoxycillin-Clavulanate 625mg orally TDS for 7 days | 567 | 1134 | 34.23 | 182.7 | 3212.88 | 210.34 | ||
| Inj. Ceftriaxone 2g IV OD for 7 days | 945 | 1197 | 704.9 | 315 | 69.81 | 200 | ||
| Inj. Clindamycin 600 IV TDS for 7 days | 3139.5 | 5145 | 2520 | 982.8 | 104.
16 |
219.44 | ||
| 3 | Acute uncompliated cystitis | Tab. Nitrofurantoin
100 mg orally BD for 7 days |
42.21 | 150.5 | 14 | 21.28 | 975 | 98.35 |
| Tab. Cotrimoxazole
960 mg orally BD for 3 days |
8.34 | 12 | 6 | 14.64 | 100 | -43.03 | ||
| Tab. Ciprofloxacin 500 mg orally BD for
3-5 days |
35.64 | 82.5 | 3.6 | 10.2 | 2191.66 | 249.41 | ||
| Tab. Cefuroxime 250 mg orally BD for
3-5 days |
156 | 300 | 15.6 | 33.6 | 1823.07 | 364.28 | ||
| 4 | Acute uncomplicated pyelonephritis | Inj. Amikacin 1 g OD IM/IV for 14 days | 1748.6 | 2371.6 | 1079.4 | 705.6 | 119.
71 |
147.81 |
| 5 | Complicated pyelonephritis | Inj. Piperacillin-Tazobactam 4.5gm IV 6 hourly for 10 days | 18,000 | 39360 | 594.8 | 6568.4 | 6517.35 | 174.03 |
| Inj. Amikacin 1 g OD IV for 10 days | 1249 | 1694 | 771 | 504 | 119.
71 |
147.81 | ||
| Inj. Imipenem 1g IV 8 hourly for 10 days | 78600 | 25,500 | 2670 | 11527.5 | 855.
05 |
581.84 | ||
| Inj. Meropenem 1gm IV 8 hourly for
10 days |
44985 | 86670 | 14940 | 6438 | 480.
12 |
598.74 | ||
| 6 | Acute asymptomatic bacteriuria >1,00,000 cfu/ml | Tab. Nitrofurantoin 100 mg orally BD for
7 days |
42.21 | 150.50 | 14 | 21.28 | 975 | 98.35 |
| Tab. Amoxicillin 500 mg orally BD for
7 days |
88.2 | 145.32 | 33.6 | 31.64 | 332.5 | 178.76 | ||
| 7 | Cervicitis/ urethritis mucopurulent gonococcal | Inj. Ceftriaxone 250 mg IM Single dose + Tab. Azithromycin 1 gm single dose | 64 | 105 | 51.38 | 27.52 | 104.
35 |
132.55 |
| Inj. Ceftriaxone 250 mg IM Single dose + Tab. Doxycycline 100 mg orally BD for
7 days |
68.6 | 142.2 | 29.78 | 27.64 | 377.5 | 148.19 | ||
| 8 | Pelvic inflammatory disease | Inj. Ceftriaxone 250 mg IM/IV single dose + Tab. Doxycycline 100 mg BD for 14 Days | 109.2 | 251.4 | 38.18 | 43.88 | 558.
45 |
148.86 |
| 9 | Acute otitis media | Tab. Cefuroxime axetil 250 mg BD for
5 days |
260 | 500 | 26 | 56 | 1823 | 364.28 |
| Tab Amoxycillin 500 mg TDS for 5-7 days | 94.5 | 155.7 | 36 | 39.3 | 332.5 | 140.45 | ||
| Tab Coamoxyclav 625 mg TDS for 5-7 days | 405 | 810 | 9.9 | 130.6 | 8081.81 | 210.1 | ||
Overall, almost all analysed regimens across different infections showed more than 100% cost variation between branded (median) versus generic based prescriptions; more than 250 % cost variation was found in 12 regimens as shown in figure 1.
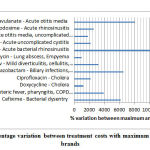 |
Figure 1: High percentage variation between treatment costs with maximum – minimum priced brands |
Inter-brand treatment cost variations between prescriptions with maximum and minimum priced brands were extremely high (> 1000%) for many regimens as shown in figure 2 like cefixime for dysentery, azithromycin for enteric fever, acute pharyngitis, doxycycline and ciprofloxacin for cholera, moxifloxacin for rhinosinusitis, cefuroxime for cystitis and otitis media, and piperacillin tazobactam and amoxicillin – clavulanate in multiple regimens.
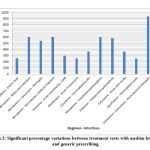 |
Figure 2: Significant percentage variations between treatment costs with median branded |
Paradoxically, cost of treatment for some regimens was found to be higher with generic prices. An example was the regimen of cefixime for treating bacillary dysentery where generic based treatment cost was INR 62.25 (USD 0.83) while it was INR 11.70 (USD 0.16) with minimum priced brand. Similar cheaper treatment costs with minimum branded drug formulations were seen for cotrimoxazole for enteric fever, and regimens for treating pneumonia with amoxicillin and piperacillin-tazobactam.
Discussion
Cost of drug therapy is a major concern for Indian patients. The results showed that widespread inter-brand cost variations exist in commonly used antibacterial formulations despite efforts to curb the same. The variations between cost of treating infections with recommended regimens using the maximum and minimum priced brands ranged from 70% to 14,900%. There were 25 regimens where prescription of most expensive brands would make the regimen 5 times costlier than prescribing the cheapest brands. Such variations are in line with those found in previous studies on antimicrobials in India where variations in cost of ranged from 9% to 2000% [21-23]
It was also observed that wide cost variations also exist between different regimens recommended for the same infection. The national treatment guidelines have classified the regimens as first line antibiotics and alternative antibiotics based on scientific evidence and review. Alternative antibiotics should be prescribed when first line regimens cannot be used due to hypersensitivity, patient’s clinical parameters or non-availability of drugs. For many infections, the alternative treatment regimens were found to be significantly less expensive than the first line regimens. This raises an important question regarding the consideration of cost effectiveness in the recommendation of the regimens in the guidelines? Clarity is needed in choosing alternative regimens over the first line in context of economic burden on the patients. Pharmacoeconomic data needs to be gathered and provided to the prescribers so that best therapeutic decisions can be made, remaining conscious of expected outcomes.
The generic drug scheme of the government (JAS), with more than 3600 stores across the country, was launched to make low-priced, good quality medicines available for all.[12] For most infections, generics do provide a cheaper treatment alternative. However for quite a few regimens, cheaper branded alternatives of common antibacterials are available like cefixime in dysentery, azithromycin and cotrimoxazole in enteric fever, doxycycline and ciprofloxacin in cholera, amoxicillin in pneumonia, piperacillin tazobactam in lung abscess, azithromycin in acute pharyngitis, moxifloxacin in rhinosinusitis, amoxicillin clavulanate in cellulitis and furunculosis, regimens of cystitis, pelvic inflammatory disease etc.
This needs to be reviewed as health care practitioners are being encouraged to prescribe only generics in the country.24 It raises questions on the utility of the generic scheme, and the quality of the cheaper brands? All generic drugs under JAS are procured and supplied by Bureau of Pharma PSUs of India (BPPI) to ensure quality and efficacy.25 However, the same cannot be ensured for the cheap brands available in the market.
Another important finding is the non-availability of some recommended drugs as generic formulations which should not be the case. In the guidelines, a few regimens are not outlined completely (dosage / duration unspecified) like for ciprofloxacin and metronidazole regimen for mild diverticulitis, chloramphenicol for acute bacterial meningitis, clindamycin and ceftriaxone for pelvic inflammatory disease, trimethoprim and cotrimoxazole for asymptomatic bacteriuria. For better compliance to the guidelines in achieving the objective of rational use of antibiotics, regimens should be mentioned in completeness.
Consequences of Price Differences and Variations
Cost related poor patient compliance is a worldwide problem affecting clinical outcome and increasing further expenditure. The links between poor antimicrobial compliance and antimicrobial resistance have also been demonstrated.26 In India, where the recently recommended minimum daily wages were just INR 375 (USD 5)27, patients’ out of pocket expenditures acquire grave significance. If a patient is prescribed medicines which are two to ten times more expensive than a generic alternative or cheaper brand, it’s tantamount to gross injustice. It severely hampers their ability to complete treatment courses. On the other hand, prescribing cheaper alternatives does not guarantee the requisite quality or effectiveness, which is the prevailing view among practitioners and patients despite the mandatory proof of bioequivalence required for approval of generics.25, 28 Evidence based assurance should be provided for effectiveness of generics, compared to so called ‘trusted’ or ‘established’ brands. This may be taken up as clinical effectiveness studies.
Exploring Reasons for Price Variations
The Indian pharmaceutical industry has witnessed a robust growth from a turnover of approximately US $ 1 billion in 1990 to over US $ 30 billion in 2015. It ranks 3rd worldwide by volume of production, accounting for around 10% of world’s production by volume and 1.5% by value.25 Anti-infective drugs command the largest share (16%) in the Indian pharmaceutical market.28 The magnitude of price variation is vast encompassing almost all drug categories.
Open Competitive Pharmaceutical Market
With a turnover of approximately US $ 30 billion in 2015, Indian pharmaceutical industry ranks 3rd worldwide by volume of production, accounting for around 10% of world’s medicine production. [25] Anti-infective drugs command the largest share (16%) in the market. India provides an open platform for both domestic and numerous foreign drug manufacturers. The competition has led to a tremendous increase in the number of brands available. To cope with it, price variations on either extremes are prevalent.28 Established brands try to maximise profits with high pricing, emerging or lesser players try to enhance their market by offering very low prices, perhaps at cost of compromised quality or efficacy?
Concept of Branded Generics
These are molecular copies of an off-patent product with a trade name and aggressive marketing, generally available at a lower cost than innovator brand. There is absence of FDA like regulations to ensure maintenance of quality of generics in India where branded generics accounted for about 63% of all drug sales by value in 2015 which is expected to grow at an annual rate of 9−12%, compared to only 3−6% for other drugs.29, 30 With so many alternatives, vested interest come into play during both prescribing and dispensing of drugs to patients.
Presence of ‘Me Too’ Drugs
These are broadly defined as chemically related to the prototype, or other chemical compounds which have an identical mechanism of action. It was presumed that the competition arising because of me too drugs would lead to substantial price reductions. However, in practice, while me-too drugs may bring product diversity, they do not seem to bring price reductions to the same extent.30 This is perhaps because the therapeutically similar drugs compete primarily in marketing, rather than in price. Generic drugs typically enter the market at a significantly discounted price compared to the innovator drug, while me-too drugs do not.
The ‘Drug Price Control Order’
This is a legislative regulation issued by the government to declare a ‘ceiling price’ primarily for essential medicines to ensure reasonable drug prices for the general public. No manufacturer can sell a formulation above the effective ceiling rate. The latest order issued in 2013, is applicable to all drugs listed as ‘scheduled’, and is being continuously expanded to add lists of ‘non-scheduled’ formulations brought under price regulation largely in public interest. By 2019, ceiling prices for 914 formulations were fixed under this order.[31] However, it has been subjected to criticism as ceiling prices are considered quite high, allowing wide price variations. The profit margin for manufacturers and dealers remains as high as upto 1000% of manufacturing cost.31 Currently a market based policy is being followed where ceiling price is determined through a formula including all those formulations – brands and generic – of the medicine having ≥ 1 % of share in the total market turnover.32 So, ceiling prices are actually influenced by the already existing high prices of popular brands with larger market shares.
Pharmaceutical companies have also evolved new ways to avoid the DPCO. They are changing the composition of the formulations through excipients, or making dosage forms that are not included in scheduled drug list. As only 14-17% of the total Indian pharmaceutical market has actually come under price control, the brand price variation in the non-price controlled market is deemed to be much larger. A substantial 16% margin to the retailer and 8-10% to distributor is allowed for scheduled drugs within the ceiling price fixed by the government where as for other drugs, pharmaceutical companies are at liberty to decide the margin leading to exorbitant retail prices of these drugs. For the non-price controlled drugs, the pharmaceutical companies are at liberty to decide the margin.34
Other Government Measures
The use of low cost generic drugs is being emphasized upon in the country especially in public hospitals. Some studies have investigated the quality of generic medicines and found them to be of similar quality to branded equivalents.35-37 Contrary to that, drug recalls have also been reported six times in a short span of time according to the Indian Medical Association, of Maharashtra state.38 Space is to be provided in hospital premises or suitable locations for the generic drug stores.39 However, such stores are still limited in number, and have poor accessibility in many areas. The general public isn’t adequately aware about them. Most of the stores are not stocked with common medicines for long durations due to lack of supply arising out of logistic issues.40 Additionally, the government has recently made it mandatory for pharmacies to display generic medicines conspicuously on separate shelves, easily visible to the consumers. In public procurement, supplying manufacturers will only be allowed to stamp the company name and generic name on the packaging.39 The Competition Commission of India (CCI) considers unreasonably high trade margins as the major factor behind exorbitant drug prices. It has recently recommended efficient public procurement and distribution of essential drugs and endorsed e-pharmacies which can bring in transparency and spur price competition.41
‘Ayushman Bharat’, an insurance scheme launched in 2018 aims to cover nearly 500 million beneficiaries. A proposal of launching of low priced ‘second brand’ by the multinational pharmaceutical companies to participate in this scheme was tabled.41 This raises concern over the quality of drugs as there is no explanation for selling the same molecule at a lower price. It invokes suspicion regarding compromises that may happen, and margins that are available with large drug manufacturers. Although drug manufacturers are expected to follow Good Manufacturing Practice (GMP) in India, in reality its implementation is seriously questionable with constant reports of issues arising out of use of substandard drugs.42,43 Although, all the drug manufacturers are expected to follow Good Manufacturing Practice (GMP) in India, the implementation is seriously questionable with constant reports of issues arising out of use of substandard drugs. Drug regulators across the globe use different strategies including the sampling of products, document verification, and site visits to assure quality. However, limited resources and manpower lead to inadequate testing at irregular intervals in India. It has been estimated that 75% of counterfeit drugs supplied worldwide had some origins in India.44 This is an indication of serious lack of compliance to GMP rules.
Conclusion
Our study revealed large variations in cost of treatment of infections depending on regimen chosen, and type of prescribing of medicines – branded or generic. The economic burden of treatment of infections on patients can be significantly reduced by including pharmacoeconomic analyses in treatment recommendations, and elimination of cost variations arising out of branded or generic prescribing. Despite measures in place, there is a distinct need for further measures to tackle issues of exorbitant brand prices, assuring quality of generics, improvement of ceiling price policy, and implementation of regulations. Lastly, health care professionals should be conscious of drug prices while prescribing to decrease the out of pocket expenditure of their patients.
Conflict of Interest
There is no conflict of interest.
Funding Source
There is not funding source
References
- Klein E.Y., Boeckel T.V., Martinez E.M., Pant S., Gandra S., Levin S.A., Goossens H., Laksminarayan R. Global increase and geographic convergence in antibiotic consumption between 2000 and 2015. Proc Natl Acad Sci, 2018;115:3463-70.
- Dey S. India’s health spend just over 1% of GDP. The Times Of India. Jun 20, 2018. https://timesofindia.indiatimes.com/business/india-business/indias-health-spend-just-over-1-of-gdp/articleshow/64655804.cms. Accessed Feb 21,2019.
- Dhoot V. Why is India’s GDP growth falling? The Hindu. https://www.thehindu.com/business/Economy/why-is-indias-gdp-growth-falling/article19651796.ece. Updated Sep 16, 2017. Accessed Dec 17, 2018.
- Roy V., Gupta U., Agarwal A.K. Cost of medicines & their affordability in private pharmacies in Delhi (India). Indian J Med Res, 2012;136:827-35.
- Mukherjee K. A Cost Analysis of the Jan Aushadhi Scheme in India. Int J Health Policy Manag, 2017;6:253–6.
- Dhamija P., Sharma P.K., Kalra S. Only generics (drugs/names): Is India ready? Indian J Endocrinol Metab, 2015;19:541-5.
- Meher M., Srivastav A., Jiwane D. A cost analysis study of oral hypoglycemic drugs available in Indian market. World J Pharm Pharm Sci, 2018;7:1237-45.
- Atal S., Atal S., Deshmankar B., Nawaz S.A. Cost Analysis Of Commonly Used Drugs Under Price Control In India: Assessing The Effect Of Drug Price Control Order On Brand Price Variation. Int J Pharm Pharm Sci, 2016;8:315-21.
- Patel D., Thiyagu R., Surulivelrajan M., Patel H., Pandey S. Price variability among the oral antibiotics available in a South Indian tertiary care hospital. J Clin Diagn Res, 2009;3:1871-5.
- Shareef J., Mateti U.V., James J.B., Rao D., Stanly S.M., Samaga L. Analysis of price variation among parenteral antibiotics available in a tertiary care teaching hospital. Journal of patient safety and infection control, 2017;5:89-93.
- Deolekar P., Yadav P., Deolekar S. Cost analysis study of oral antiplatelet drugs available in indian market. Eur J Pharm Med Res, 2017;4:294-7.
- Pradhan Mantri Bhartiya Janaushadhi Pariyojna-Quality medicines available at affordable price for all. https://www.india.gov.in/spotlight/pradhan-mantri-bhartiya-janaushadhi-pariyojana. Accessed Dec 12, 2018.
- Ahmad A., Patel I., Parimilakrishnan S., Mohanta G.P., Chung H., Chang J. The role of pharmacoeconomics in current Indian healthcare system. J Res Pharm Pract, 2013;2:3-9.
- Singal G.L., Nanda A., Kotwani A. A comparative evaluation of price and quality of some branded versus branded-generic medicines of the same manufacturer in India. Indian J Pharmacol, 2011;43:131-6.
- Shankar P.R., Subish P., Mishra P., Lalit M. Ambiguous pricing of Nepalese medicines. J Inst Med, 2006;28:35-8
- Mehar M., Srivastav A., Jiwane D., Keer A. A cost analysis study of oral hypoglycemic drugs available in Indian market. World J Pharm Pharm Sci, 2018;7:1237-45.
- Kamath L., Satish G.R. Cost variation analysis of antihypertensive drugs available in Indian market: an economic perspective. Int J Pharm Sci Res, 2016;7:2050-56.
- Sarangi S.C., Kaur N., Tripathi M., Gupta Y.K. Cost analysis study of neuropsychiatric drugs: Role of National List of Essential Medicines, India. Neurol India, 2018;66:1427-33.
- National Treatment Guidelines for Antimicrobial Use in Infectious Diseases 2016. National Centre for Disease Control Web site. http://pbhealth.gov.in/amr_guideline7001495889.pdf. Accessed Oct 4, 2018.
- Treatment Guidelines for Antimicrobial Use in Common Syndromes 2019. 2nd edition. ICMR, New Delhi. https://www.icmr.nic.in/guidelines/treatment%20guidelines%20for%20antimicrobial.pdf. Accessed Feb 15. 2020.
- Karve A.V., Paul K.B. Economic analysis of oral cephalosporins in the Indian market. Int J Res Med Sci, 2016;4:4143-9.
- Chawan V.S., Gawand K.V., Badwane S.V. Fluoroquinolones in India—Are we prescribing it right: A cost variation study. Natl J Physiol Pharm Pharmacol, 2015;5:306-8.
- Mir S.A. Cost analysis of different brands of antimicrobial agents available in India. Int J Basic Clin Pharmacol, 2016;5:85-9.
- Circular on Generic Medicine. Medical Council of India. Web site. https://old.mciindia.org/circulars/Public-Notice-Generic-Drugs-21.04.2017.pdf Updated April 21, 2017. Accessed Feb 21, 2019.
- Gudipati R.K. An analysis of generic medicines in India. The Hans India. May 09, 2017. https://www.thehansindia.com/posts/index/Civil-Services/2017-05-09/An-analysis-of-generic-medicines-in-India/298834. Accessed Feb 18, 2019.
- Ayukekbong J.A., Ntemgwa M., Atabe A.N. The threat of antimicrobial resistance in developing countries: causes and control strategies. Antimicrob Resist Infect Control, 2017;6:47.
- Expert Committee Submits its Report on Determining Methodology for Fixing National Minimum Wage. Ministry of Labour & Employment, Government of India Web site. http://pib.nic.in/newsite/PrintRelease.aspx?relid=188610. Updated Feb 14, 2019. Accessed Feb 21, 2019.
- Pharmaceuticals. India brand equity foundation Web site: https://www.ibef.org/download/Pharmaceutical-March-2017.pdf. Updated March, 2017. Accessed on Dec 17, 2018.
- Pharma industry promotion. Department of Pharmaceuticals, Government of India. http://pharmaceuticals.gov.in/. Accessed Oct 04, 2018.
- Gangone S., Godala D., Kashetti S.V. A Review of Pharmacoeconomics and a Discussion on Branded, Branded Generics and Generics. Pharmacoeconomics, 2017;2:1-5.
- DPCO/NPPA. Department of pharmaceuticals, Government of India. http://pharmaceuticals.gov.in/dpconppa. Accessed Feb 18, 2019
- SC to examine pharma pricing policy order on drug control. Financial Express. Aug 7, 2013. https://www.financialexpress.com/archive/sc-to-examine-pharma-pricing-policy-order-on-drug-control/1152032/. Accessed Dec 17, 2018.
- Compendium of notified ceiling prices of scheduled drugs-2015. National Pharmaceutical Pricing Authority, Government of India. Web site. http://www.nppaindia.nic.in. Accessed Dec 17, 2018.
- DPCO 2013 loopholes: OPPI view and Moneylife’s counterview – Part 1. https://www.moneylife.in/article/dpco-2013-loopholes-oppi-view-and-moneylifes-counterview-part-1/35452.html Accessed Dec 18, 2018.
- Singal G.L., Nanda A., Kotwani A. A comparative evaluation of price and quality of some branded versus branded-generic medicines of the same manufacturer in India. Indian J Pharmacol, 2011;43:131–6.
- Kotwani A. Psychiatric medicines in India: why public healthcare facilities and a thriving generics industry cannot assure access and affordability. Int Psychiatry. 2012;9:34-6.
- Kotwani A., Ewen M., Dey D., Iyer S., Lakshmi P.K., Patel A., Laing R. Prices & availability of common medicines at six sites in India using a standard methodology. Indian J Med Res, 2007;125:645–54.
- Quality of generic drugs in question. The Hindu. April 27, 2018. https://www.thehindu.com/news/cities/mumbai/quality-of-generic-drugs-in-question/article23687880.ece. Accessed Dec 18, 2018.
- Pradhan H. Govt asks drug stores to keep generic medicines in separate shelf. The Times Of India. Mar 17, 2018.
http://timesofindia.indiatimes.com/articleshow/63349028.cms?utm_source=contentofinterest&utm_medium=text&utm_campaign=cppst. Accessed Dec 18, 2018. - Hamid Z. Jan aushadhi stores gaining popularity, but supplies low. The Hindu. Jan 18, 2018. https://www.thehindu.com/news/cities/chennai/jan-aushadhi-stores-gaining-popularity-but-supplies-low/article22438906.ece. Accessed Feb 18, 2018.
- Competition Commission of India Brings Out Policy Note on ‘Making Markets Work for Affordable Healthcare. Competition Commission of India Web site. https://www.cci.gov.in/sites/default/files/press_release/PressRelease.pdf. Updated Oct 24, 2018. Accessed Feb 18, 2019.
- Dey S. Big pharma companies propose launch of low priced ‘second brands’ for Ayushman Bharat health insurance scheme. The Times Of India. Oct 16, 2018.
http://timesofindia.indiatimes.com/articleshow/66229879.cms?utm_source=contentofinterest&utm_medium=text&utm_campaign=cppst. Accessed Dec 18, 2018 - Singal G.L. Spurious Drugs / Counterfeit Drugs – An Overview. The Pharma Review. 2008. http://www.kppub.com/articles/december2008/spurious_drugs_counterfeit_drugs.html. Accessed Dec 18, 2018.
- Barnes K. New counterfeit report highlights worrying trends. Outsourcing Pharma. 2007. http://www.outsourcingpharma.com/Contract-Manufacturing/New-counterfeit-report-highlightsworrying-trends. Accessed Dec 18, 2018.

