
Manuscript accepted on :22-05-2020
Published online on: 23-06-2020
Plagiarism Check: Yes
Reviewed by: Shabana Khatoon
Second Review by: Ankur Singh Bist
Final Approval by: Prof. Dr. Ziyad S. Haidar
Saied M. I. Al-Dalaen* , Abdul-Wahab R. Hamad, Fawaz Al-Saraireh, Rawan Nayef Alkaraki, Mousa Khames Mezel Magarbehand Fahil M. Abid
College of Pharmacy, Mutah University, AlKarak, Jordan.
Corresponding Author E-mail : wahabhamad2004@yahoo.com
DOI : https://dx.doi.org/10.13005/bpj/1943
Abstract
Background: Allopurinol is an effective inhibitor of the enzyme xanthine oxidase, use for decreasing the blood concentrations of urate and, therefore, to decrease the quantity of repeated assaults of gout. Allopurinol is metabolized to oxipurinol, and hypouricaemic efficacy of allopurinol is due very in large part to this metabolite. Objective: To study and compare the bioavailability and bioequivalence of two allopurinol 300 mg tablet formulations, test drug (Hyporic tablet, SDI) and reference drug (Zyloric tablets, GlaxoWellcome). Method: A single dose study was carried out in 20 healthy volunteers with a two-sequence, crossover block-randomized design. Blood samples were taken prior to each administration and at 0 time and post administration at 0.5, 1.0, 1.5, 2.0, 3.0, 4.0, 6.0, 9.0 and 12.0 hours after the dose. Standards and plasma concentrations of allopurinol were determined by HPLC. The pharmacokinetic parameters; maximum concentration (C-max) and maximum time (T-max) were obtained directly from plasma allopurinol concentrations for both reference and test drugs. Area under curve (AUC) was calculated by the linear trapezoidal rule for both Hyporic tablet and Zyloric tablet. Results: The pharmacokinetic parameters AUC and C-max were tried for proportional after log-transformation of data. The maximum concentrations (C-max) of allopurinol for both 300mg hyporic and 300mg zyloric tablets were 29.8±3.372 and 30.6±2.507 mg at maximum time of 1.5 hours for both formulation, it was not significantly differences. The AUC for both test and reference tablets were 90.525±11.677 and 92.817±9.752, respectively. Allopurinol has a plasma half-life of about 2.0±0.141 and 2.1±0.148 hours Hyporic drug as a test and Zyloric drug as a reference, respectively. The 90% standard confidence intervals of the mean values for the test/reference ratios were for AUC and for C-max, within the acceptable bioequivalence limits of 0.80-1.25 for both Reference and Test tablets. Conclusion: The two formulations are bioequivalent for Hyporic tablet (SDI) and Zyloric tablet (GlaxoWellcome). The results of all the applied statistical test suggest that Hyporic and Zyloric tablets can be considered as bioequivalent preparations and therefore interchangeable.
Keywords
Allopurinol; Bioequivalence; Bioequivalence
Download this article as:| Copy the following to cite this article: Al-Dalaen S. M. I, Hamad A. W. R, Al-Saraireh F, Alkaraki R. N, Magarbeh M. K. M, Abid F. M. Bioavailability and Bioequivalence of Allopurinol in Two Tablet Formulations. Biomed Pharmacol J 2020;13(2). |
| Copy the following to cite this URL: Al-Dalaen S. M. I, Hamad A. W. R, Al-Saraireh F, Alkaraki R. N, Magarbeh M. K. M, Abid F. M. Bioavailability and Bioequivalence of Allopurinol in Two Tablet Formulations. Biomed Pharmacol J 2020;13(2). Available from: https://bit.ly/2YpXQzl |
Introduction
Description
The chemical structure of allopurinol is 1, 5-dihydro-4H-pyrazolo [3, 4-d] pyrimidin-4-one. It is a xanthine oxidase inhibitor that’s administered orally and intravenously. It may be a white undefined mass with an atomic weight of 158.09 and atomic formula C5H3N4NaO. It has the structural formula below. The pKa of allopurino sodium is 9.31 (Maddison etal.2009).
Allopurinol respond on purine catabolism, without disrupting the biosynthesis of purines. It decreases the generation of uric acid by representing the biochemical responses quickly going before its formation.2
Allopurinol could be an auxiliary simple of the characteristics purine base, hypoxanthine. Allopurinol is an inhibitor of xanthine oxidase,3,4 the protein capable for the change of hypoxanthine to xanthine and of xanthine to uric acid, the end output of purine metabolism in man. Allopurinol is metabolized to the corresponding xanthine analogue, oxipurinol (alloxanthine), which also is an inhibitor of xanthine oxidase.4,5 Therefore, this enzyme is the target of medicine in opposition to gout and hyperuricemia.
Therefore, it is an isomer of hypoxanthine and inhibits the manufacturing of uric acid, the metabolite answerable for gout, by inhibiting enzyme xanthine oxidase. Allopurinol is used to deal with chronic gout (gouty arthritis) and gout is a sort of acute arthritis that is prompted by hyperuricemia and results inside the crystallization of sodium urate.6 This condition is resulting from as well much uric acid within the blood. This medication works by means of causing much less uric acid to be manufactured by means of the body.7 Allopurinol will now not lessen a gout offense that has as of now begun. Also, it does now not cure gout, but it’s going to help save you gout attacks. Be that as it may, it were after you’ve got been taking it frequently for many months. Allopurinol will prevent gout attacks.8,9
Allopurinol include certain forms of kidney stones or different kidney issues. Certain medicines or therapeutic drug treatments can appreciably increase the quantity of uric acid within the body. This can motive gout or kidney troubles in some people.10 Allopurinol is also used to prevent these issues, and can be given as either a pill or an injection if necessary.
For allopurinol, the following must be considered; Allergy. A percentage of humans develop a rash and need to discontinue this drug. The maximum severe adverse event is a hypersensitivity syndrome consisting of fever, skin rush, eosinophilia, hepatitis, and irritating renal function.11
In a few cases, allopurinol allergic reaction syndrome pregnancy. In spite of that thinks approximately on birth abandons have now not been tired pregnant women, allopurinol has not been detailed to purpose problems in humans. In one take a look at in mice, huge sums of allopurinol brought on beginning defects and different undesirable impacts.12,13 In any cases, allopurinol did no longer motive beginning defects or different issues in rats or rabbits given dosages up to twenty instances the sum as rule given to humans. Breast-feeding- allopurinol passes into the breast drain. Mothers who’re taking this pharmaceutical and who want to breast-feed ought to observe this with their specialist.14
Recently, an excessive occurrence of gout and hyperuricemia related to hyperlipidemia, obesity, and hypertension were demonstrated, and these headaches are perceived as a hazard element for inducing mortality and ischemic coronary heart disease.15 It has also been proven that hyperuricemia will increase the relative threat of cardiovascular or cerebrovascular diseases,12 and uric acid is stated to be an independent risk thing inside the remedy of hypertension.16 Considering these factors, it has been advocated that asymptomatic hyperuricemic patients should receive remedy for reducing blood uric acid levels (Qianrui Li etal. 2019). Indeed, sufferers are dealt with a uric acid manipulate drug to save you recurrence of gout.16, 18
Materials and Methods
Extraction of Plasma Samples
The blood samples (5ml) were collected from 20 healthy volunteers (age 20-40 years ,body weigh 55-84 Kg, body height 160-174 cm) for each allopurinol formula (Table 1), in different times between (0.5-12) hours after oral administration of 300 mg of allopurinol tablet. Blood samples were taken prior to each administration and at 0 time and post administration at 0.5, 1.0, 1.5, 2.0, 3.0, 4.0, 6.0, 9.0 and 12.0 hours after the dose. Blood samples were collected in single randomized crossover studies with interval of 7 days between two periods. Plasma were obtained from blood samples to which heparin (25 µg), were added to 10 ml tube before centrifugation at 900 g., plasma (0.5 ml) in ground-glass centrifuge tube, was added to 0.2 ml of 20% perchloric acid, mixed well, and centrifuged at 850 g for 10 min at 4°C. The supernatant was removed and filtered through a 22-µm Millipore GV13 syringe filter. A 20-µl aliquot of the filtrate was analyzed by HPLC.
Assay by HPLC
High performance liquid chromatography (HPLC) 10AVP, Shimadzu, Japan, was used to determine the concentration of allopurinol in plasma. Plasma (0.5 ml) was added to 0.2 ml of 20% perchloric acid, mixed well, and centrifuged at 850 g for 10 min at 4°C. The supernatant was removed and filtered through a 22-µm Millipore GV13 syringe filter. A 20-µl aliquot of the filtrate was analyzed by using a Shimadzu 10AVP, HPLC machine, operating in isocratic mode, equipped with a suplico µBondapak C18 column (4.6 mm i.d. x 250 mm, 5 µm particle size), an absorbance detector set at 254 nm. The mobile phase was 50 mM KH2PO4, pH 6.0, at a flow rate of 1 ml/min. Authentic allopurinol standards were run under similar conditions, and these values were used to calculate concentrations of allopurinol in plasma samples.
Linearity of the Chromatographic Method
The typical chromatogram obtained for a standard of allopurinol is shown in Fig. 1. The retention time of allopurinol in chromatogram is about 5.7 min.
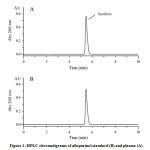 |
Figure 1: HPLC chromatigrams of allopurinol standard (B) and plasma (A) |
Precision and Accuracy
HPLC method was evaluated by measuring the chromatographic peak area of allopurinol, 10 times on the same standard (5 mcg/ml). The coefficient of variation was 1.12 %. Injection precision less than 5% RSD (Relative Standard Deviation) are considered appropriate for these trace level determinations. The accuracy of the method was estimated by injecting five different standard of the same concentration (1 mcg/ml) obtaining a recovery of 99.6% with an RSD of 1.6%.
Recovery of the Method
Table 2 show the results obtained in the analysis of the extracts from spiked plasma with different quantities of allopurinol (0.78 mcg. 10.2 mcg and 26.7 mcg); the average recovery was 98.5%. The RSD values ranged from 1.6% for a quantity of 10.2 μg (intra-day) to 5.6% for 0.78 μg in the inter-day study.
Statistical Analysis
The pharmacokinetic characteristics of allopurinol were determined from the plasma concentration-time data. Peak plasma concentration (Cmax) and time to maximum plasma concentration (Tmax) were determined directly from raw data. The area under the curve (AUC0-t, from 0 to last measured concentration) was calculated by the trapezoidal method.
Student’s (t)-test was used to estimate the significance of the variations in the results obtained for the tested formulations.
Table 1: Characteristics of the volunteers
| Subject | Sex | Age\years | Height \cm | Weight\kg. |
| 1 | M | 23 | 170 | 68 |
| 2 | M | 24 | 165 | 65 |
| 3 | M | 26 | 173 | 63 |
| 4 | M | 29 | 166 | 70 |
| 5 | M | 20 | 174 | 80 |
| 6 | M | 35 | 172 | 78 |
| 7 | M | 32 | 171 | 74 |
| 8 | M | 27 | 167 | 75 |
| 9 | M | 33 | 169 | 73 |
| 10 | M | 29 | 173 | 84 |
| 11 | M | 30 | 168 | 72 |
| 12 | M | 40 | 174 | 69 |
| 13 | F | 24 | 160 | 58 |
| 14 | F | 23 | 164 | 57 |
| 15 | F | 24 | 166 | 60 |
| 16 | F | 26 | 168 | 55 |
| 17 | F | 29 | 170 | 59 |
| 18 | F | 30 | 161 | 60 |
| 19 | F | 32 | 165 | 58 |
| 20 | F | 34 | 165 | 60 |
| Mean | 28.5 | 168.5 | 66.90 | |
| ±SD | 4.94 | 4.11 | 8.59 |
Table 2: Intra- and inter-day variation of the method for allopurinol
| Conc. Added | Intra-day (n=10) | Inter-day (n=10) | ||||
| (mcg) | RSD* | Error | Conc.Found (mcg) | RSD* | Error | Conc.Found (mcg) |
| (%) | (%) | (%) | (%) | |||
| 0.78 | 4.8 | 2.6 | 0.76 +0.03 | 5.6 | 6.4 | 0.73 + 0.04 |
| 10.2 | 1.6 | 0.9 | 10.1 +0.12 | 3.1 | 2.9 | 0.91 + 0.29 |
| 26.7 | 1.9 | 1.1 | 26.4 + 0.25 | 4.2 | 2.3 | 26.1 + 0.53 |
*Relative Standard Deviation (RSD)
Results and Discussion
The chromatograms shown in Fig. 1 are the results of standards of allopurinol standard (B) and free plasma (A) which observed that no endogenous interference occurred in the chromatogram, the figures (2, 3) show the chromatogram after oral administration of 300mg allopurinol at selective result of analysis carried out 2 and 6 hours respectively.
Linear calibration curves of allopurinol peak area versus plasma concentrations were obtained with plasma standards containing 5 – 300 ug/ml (Fig. 2). The calibration curve constructed during the assays of allopurinol in actual plasma samples of the bioavailability trial were being carried out (19). Correlation coefficient for these linear regression were consistently greater than 0.98.9 (n=5) making one point calibration feasible.
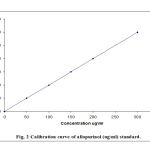 |
Figure 2: Calibration curves of allopurinol (ug/ml) standards |
Precision and accuracy, Percentage intra-assay and inter-day coefficient of variation (CV %) for allopurinol were 97.2–100.3, within the concentration range 0.5–5.0 μg/ml (Table 2). Table2 display the effects obtained within the analysis of the extracts from spiked plasma with different portions of allopurinol (0.78 mcg. 10.2 mcg and 26.7 mcg); the average restoration turned into 98.5%. The RSD values ranged from 1.6% for a quantity of 10.2 μg (intra-day) to 5.6 % for 0.78 μg within the inter-day study.
Plasma concentrations of allopurinol were measurable for most subjects up to 12 hours following the administration of oral allopurinol tablets (Table 3, 4).
Table 3: Mean concentration of allopurinol (ug\ml) in plasma after administration of oral 300 mg Hyporic acid tablet (SDI) to 20 healthy volunteers.
Time – Hours
| No. | 0.0 | 0.5 | 1.0 | 1.5 | 2.0 | 3.0 | 4.0 | 6.0 | 9.0 | 12.0 |
| 1 | 0 | 5.6 | 17.3 | 32.1 | 23.4 | 15.8 | 10.5 | 6.6 | 3.1 | 1.2 |
| 2 | 0 | 4.2 | 15.3 | 29.6 | 22.1 | 14.9 | 9.3 | 5.0 | 2.4 | 1.1 |
| 3 | 0 | 3.9 | 12.4 | 22.5 | 15.3 | 9.7 | 5.5 | 3.7 | 2.1 | 0.9 |
| 4 | 0 | 5.4 | 16.7 | 26.3 | 16.4 | 10.2 | 6.4 | 3.0 | 1.6 | 0.75 |
| 5 | 0 | 6.3 | 16.0 | 30.1 | 21.2 | 13.7 | 8.3 | 4.5 | 2.4 | 1.1 |
| 6 | 0 | 3.5 | 13.1 | 27.8 | 18.5 | 10.4 | 6.4 | 3.1 | 1.7 | 0.85 |
| 7 | 0 | 5.1 | 16.8 | 32.2 | 24.3 | 16.1 | 10.0 | 5.7 | 2.5 | 1.1 |
| 8 | 0 | 6.5 | 17.5 | 34.5 | 25.6 | 17.3 | 9.8 | 4.8 | 2.2 | 0.9 |
| 9 | 0 | 4.6 | 14.3 | 24.0 | 16.2 | 8.9 | 4.8 | 2.8 | 1.8 | 0.8 |
| 10 | 0 | 4.8 | 14.9 | 28.4 | 20.0 | 12.2 | 6.7 | 3.9 | 1.9 | 0.75 |
| 11 | 0 | 4.0 | 15.3 | 31.6 | 22.3 | 15.4 | 10.2 | 5.1 | 2.4 | 1.0 |
| 12 | 0 | 5.2 | 16.7 | 33.4 | 25.7 | 17.9 | 11.4 | 5.7 | 2.7 | 1.2 |
| 13 | 0 | 6.4 | 18.0 | 35.1 | 27.2 | 18.2 | 12.7 | 6.0 | 2.9 | 1.4 |
| 14 | 0 | 3.9 | 14.0 | 28.2 | 19.8 | 11.3 | 6.6 | 3.3 | 1.7 | 0.8 |
| 15 | 0 | 5.5 | 16.2 | 29.4 | 20.0 | 12.0 | 7.4 | 4.0 | 1.9 | 0.9 |
| 16 | 0 | 6.5 | 16.9 | 33.7 | 24.6 | 16.7 | 10.1 | 5.3 | 2.6 | 1.3 |
| 17 | 0 | 4.2 | 14.7 | 29.0 | 19.9 | 11.8 | 7.2 | 4.2 | 2.0 | 0.95 |
| 18 | 0 | 3.7 | 13.2 | 27.4 | 18.3 | 10.3 | 6.0 | 3.0 | 1.4 | 0.65 |
| 19 | 0 | 5.3 | 16.0 | 32.5 | 23.6 | 17.4 | 9.6 | 4.6 | 1.9 | 0.85 |
| 20 | 0 | 3.8 | 14.2 | 28.5 | 19.2 | 11.0 | 5.9 | 2.9 | 1.7 | 0.75 |
| Mean | 0 | 4.92 | 15.475 | 29.815 | 21.18 | 13.56 | 8.24 | 4.36 | 2.145 | 0.963 |
| ±SD | 0 | 1.006 | 1.591 | 3.372 | 3.391 | 3.105 | 2.227 | 1.151 | 0.464 | 0.205 |
Table 4: Mean concentration of allopurinol (ug\ml) in plasma after administration of oral 300 mg Zyloric tablet (GlaxoWelcome) to 20 healthy volunteers.
Time – Hours
| No. | 0.0 | 0.5 | 1.0 | 1.5 | 2.0 | 3.0 | 4.0 | 6.0 | 9.0 | 12.0 |
| 1 | 0 | 6.4 | 18.5 | 33.2 | 23.5 | 16.2 | 11.3 | 6.2 | 3.3 | 1.32 |
| 2 | 0 | 5.3 | 15.4 | 31.2 | 21.0 | 15.3 | 10.2 | 5.4 | 2.9 | 1.2 |
| 3 | 0 | 5.2 | 15.6 | 32.6 | 20.5 | 14.6 | 9.0 | 4.5 | 2.3 | 1.0 |
| 4 | 0 | 4.6 | 15.2 | 29.8 | 19.4 | 13.9 | 8.9 | 4.3 | 2.0 | 0.9 |
| 5 | 0 | 3.9 | 14.3 | 27.8 | 18.3 | 14.2 | 10.3 | 6.0 | 3.0 | 1.4 |
| 6 | 0 | 3.7 | 14.0 | 26.3 | 16.7 | 12.4 | 7.6 | 4.0 | 1.9 | 0.85 |
| 7 | 0 | 4.8 | 14.5 | 27.0 | 16.9 | 12.0 | 7.5 | 3.8 | 1.75 | 0.75 |
| 8 | 0 | 4.9 | 15.6 | 29.6 | 20.1 | 14.3 | 9.4 | 4.7 | 2.1 | 1.0 |
| 9 | 0 | 5.8 | 16.9 | 32.1 | 21.5 | 15.0 | 10.3 | 5.9 | 2.6 | 1.2 |
| 10 | 0 | 6.5 | 18.3 | 33.9 | 22.6 | 17.5 | 11.8 | 6.0 | 3.1 | 1.4 |
| 11 | 0 | 6.7 | 19.2 | 34.5 | 24.0 | 16.5 | 11.3 | 5.5 | 2.7 | 1.5 |
| 12 | 0 | 5.3 | 16.4 | 33.1 | 21.7 | 15.9 | 10.2 | 5.2 | 2.4 | 1.0 |
| 13 | 0 | 4.7 | 15.2 | 29.8 | 19.9 | 14.2 | 9.7 | 4.9 | 2.3 | 0.9 |
| 14 | 0 | 4.3 | 15.3 | 29.7 | 18.8 | 13.9 | 9.4 | 4.7 | 2.2 | 0.88 |
| 15 | 0 | 3.9 | 13.8 | 26.3 | 17.4 | 12.7 | 8.8 | 4.3 | 1.9 | 0.85 |
| 16 | 0 | 5.7 | 16.5 | 30.2 | 20.6 | 14.8 | 9.2 | 4.9 | 1.8 | 0.8 |
| 17 | 0 | 5.8 | 17.0 | 33.4 | 24.5 | 16.3 | 10.6 | 5.1 | 2.3 | 1.0 |
| 18 | 0 | 6.9 | 17.4 | 31.5 | 19.7 | 13.9 | 8.2 | 4.0 | 1.8 | 0.85 |
| 19 | 0 | 6.2 | 16.7 | 30.7 | 21.2 | 15.7 | 9.6 | 4.6 | 1.9 | 0.80 |
| 20 | 0 | 4.4 | 14.3 | 28.6 | 18.6 | 14.2 | 8.9 | 4.4 | 1.75 | 0.75 |
| Mean | 0 | 5.25 | 16.005 | 30.565 | 20.345 | 14.675 | 9.61 | 4.92 | 2.3 | 1.017 |
| ±SD | 0 | 0.977 | 1.552 | 2.507 | 2.237 | 1.418 | 1.168 | 0.724 | 0.485 | 0.234 |
Allopurinol is given orally and unexpectedly absorbed from the top gastrointestinal tract. Studies have detected allopurinol within the blood 30-60 minutes after dosing. Estimates of bioavailability range from 67% to 90%. (Helmy et.al. 2014, and Rathod et.al. 2017). A Peak plasma levels of allopurinol usually arise approximately 1.5 hours after oral administration of Zyloric, however fall swiftly and are barely detectable after 6 hours (Figure 3, 4 and 5). Allopurinol is negligibly bound by way of plasma proteins and thus varieties in protein binding are not thought to be significantly change clearance (Guerra et al. 2001).
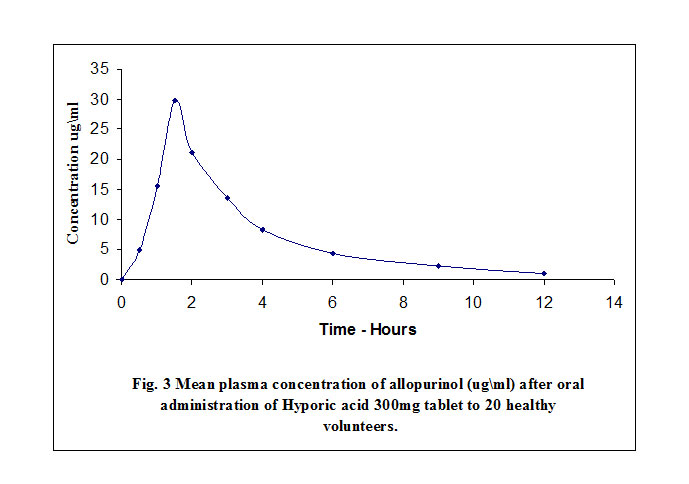 |
Figure 3: Mean Plasma concentration of allopurinol (ug/ml) after oral administration of Hyporic acid |
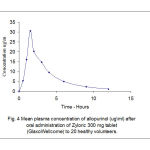 |
Figure 4: Mean Plasma concentration of allopurinol (ug/ml) after oral administration of Zyloric |
 |
Figure 5: Comparison between Reference drug (Zyloric , Glaxo Wellcome) and Test drug (Hyporic, SDI) |
The self-evidence degree of dispersion of allopurinol is approximately 1.6 litre/kg body weight which appears moderately sizable uptake by through tissues. Tissue concentrations of allopurinol have not longer been suggested in humans, however it’s possibly that allopurinol and Oxipurinol can be present in the highest concentrations inside the liver and intestinal mucosa in which xanthine oxidase activity is high (Guerra et al. 2001). Approximately 20% of the ingested allopurinol is excreted within the feces.
Elimination of allopurinol is particularly by manner of metabolic conversion to oxipurinol with beneficial resource of xanthine oxidase and aldehyde oxidase,3 with much less than 10 % of the unchanged drug excreted in the urine. Oxipurinol is a much less effective inhibitor of xanthine oxidase than allopurinol, but the plasma half-life of oxipurinol is ways more prolonged.4 Estimates variety in man ranged between 13 to 30 hours. Therefore powerful inhibition of xanthine oxidase is maintained over a 24 hour period with every day dose of allopurinol.
Patients with everyday renal function will gradually gather oxipurinol till a steady state plasma oxipurinol popularity is reached (4). Such patients, taking three hundred mg of allopurinol in keeping with day, will typically have plasma oxipurinol concentrations of 5-10 mg/litre (Guerra et al. 2001).
Allopurinol has a plasma half lifestyles of about 1 to two hours, while in the present study, it was found that the half-life of Hyporic drug as a test and Zyloric drug as a reference were 2.0 and 2.1 hours, respectively ( Tables 5 and 6).
Table 5: Pharmacokinetic of allopurinol (ug\ml) in plasma after administration of oral 300 mg Hyporic acid tablet (SDI) to 20 healthy volunteers.
| No., | Ka | Ka0.5t | Kelem. | Kelem.0.5t | Cmax | Tmax | AUC |
| 1 | 2.256 | 0.307 | 0.320 | 2.169 | 32.1 | 1.5 | 104.2 |
| 2 | 2.586 | 0.268 | 0.341 | 2.032 | 29.6 | 1.5 | 102.8 |
| 3 | 2.314 | 0.299 | 0.318 | 2.176 | 22.5 | 1.5 | 98.6 |
| 4 | 2.258 | 0.307 | 0.359 | 1.928 | 26.3 | 1.5 | 75.4 |
| 5 | 1.864 | 0.372 | 0.343 | 2.022 | 30.1 | 1.5 | 99.7 |
| 6 | 2.640 | 0.262 | 0.371 | 1.867 | 27.8 | 1.5 | 69.74 |
| 7 | 2.385 | 0.291 | 0.325 | 2.134 | 32.2 | 1.5 | 89.86 |
| 8 | 1.981 | 0.349 | 0.368 | 1.882 | 34.5 | 1.5 | 103.61 |
| 9 | 2.269 | 0.305 | 0.351 | 1.974 | 24.0 | 1.5 | 68.53 |
| 10 | 1.173 | 0.591 | 0.383 | 1.810 | 28.4 | 1.5 | 74.62 |
| 11 | 2.684 | 0.258 | 0.334 | 2.072 | 31.6 | 1.5 | 94.325 |
| 12 | 2.334 | 0.297 | 0.353 | 1.964 | 33.4 | 1.5 | 98.42 |
| 13 | 2.069 | 0.335 | 0.318 | 2.176 | 35.1 | 1.5 | 99.61 |
| 14 | 2.557 | 0.271 | 0.379 | 1.830 | 28.2 | 1.5 | 87.520 |
| 15 | 2.161 | 0.321 | 0.360 | 1.926 | 29.4 | 1.5 | 78.38 |
| 16 | 1.911 | 0.363 | 0.336 | 2.061 | 33.7 | 1.5 | 99.35 |
| 17 | 2.506 | 0.277 | 0.323 | 2.148 | 29.0 | 1.5 | 92.46 |
| 18 | 2.544 | 0.272 | 0.373 | 1.856 | 27.4 | 1.5 | 84.512 |
| 19 | 2.210 | 0.314 | 0.380 | 2.248 | 32.5 | 1.5 | 100.310 |
| 20 | 2.637 | 0.263 | 0.397 | 1.745 | 28.5 | 1.5 | 88.620 |
| Mean | 2.267 | 0.316 | 0.345 | 2.003 | 29.815 | 1.5 | 90.525 |
| ±SD | 0.356 | 0.073 | 0.023 | 0.141 | 3.372 | 0.0 | 11.677 |
Table 6: Pharmacokinetic of allopurinol (ug\ml) in plasma after administration of oral 300 mg Zyloric tablet (GlaxoWelcome) to 20 healthy volunteers.
| No., | Ka | Ka0.5t | Kelem. | Kelem.0.5t | Cmax | Tmax | AUC |
| 1 | 2.123 | 0.326 | 0.311 | 2.231 | 33.2 | 1.5 | 109.68 |
| 2 | 2.134 | 0.325 | 0.339 | 2.046 | 31.2 | 1.5 | 98.86 |
| 3 | 2.198 | 0.315 | 0.325 | 2.134 | 32.6 | 1.5 | 96.33 |
| 4 | 2.391 | 0.289 | 0.337 | 2.058 | 29.8 | 1.5 | 89.42 |
| 5 | 2.599 | 0.267 | 0.226 | 2.605 | 27.8 | 1.5 | 91.98 |
| 6 | 2.662 | 0.260 | 0.325 | 2.133 | 26.3 | 1.5 | 75.31 |
| 7 | 2.211 | 0.313 | 0.341 | 2.034 | 27.0 | 1.5 | 78.42 |
| 8 | 2.316 | 0.299 | 0.308 | 2.252 | 29.6 | 1.5 | 88.62 |
| 9 | 2.139 | 0.324 | 0.336 | 2.061 | 32.1 | 1.5 | 94.52 |
| 10 | 2.071 | 0.335 | 0.292 | 2.373 | 33.9 | 1.5 | 107.9 |
| 11 | 2.106 | 0.329 | 0.309 | 2.240 | 34.5 | 1.5 | 105.75 |
| 12 | 2.259 | 0.307 | 0.327 | 2.120 | 33.1 | 1.5 | 102.12 |
| 13 | 2.348 | 0.295 | 0.334 | 2.022 | 29.8 | 1.5 | 97.31 |
| 14 | 2.539 | 0.273 | 0.313 | 2.216 | 29.7 | 1.5 | 94.86 |
| 15 | 2.528 | 0.274 | 0.316 | 2.192 | 26.3 | 1.5 | 78.68 |
| 16 | 2.126 | 0.326 | 0.345 | 2.008 | 30.2 | 1.5 | 86.62 |
| 17 | 2.151 | 0.322 | 0.325 | 2.132 | 33.4 | 1.5 | 98.31 |
| 18 | 1.850 | 0.375 | 0.342 | 2.026 | 31.5 | 1.5 | 92.41 |
| 19 | 1.982 | 0.349 | 0.346 | 2.004 | 30.7 | 1.5 | 87.71 |
| 20 | 2.358 | 0.294 | 0.336 | 2.063 | 28.6 | 1.5 | 81.55 |
| Mean | 2.255 | 0.305 | 0.324 | 2.146 | 30.565 | 1.5 | 92.28 |
| ±SD | 0.212 | 0.033 | 0.020 | 0.148 | 2.507 | 0.0 | 9.752 |
The bioavailability of both formulations judged by the calculated pharmacokinetic parameters listed in Tables 5 and 6 and Figures 3 and 4. Among the parameters utilized for comparison between the two formulations were the area under curve (AUC) calculated from the plasma concentration profile (Fig. 5). The area was estimated by combination of linear –log – linear trapezoidal method which yields more acceptable results than the linear method alone (23).
The most concentrations of allopurinol for each 300mg hyporic and 300mg zyloric were 29.8 and 30.6mg at maximum time of 1.5 hours for both formulation. It was not significantly differences, the results of the study were given in Tables 3 and 4. Area under curve (AUC) was calculated by the linear trapezoidal rule for both Hyporic tablet and Zyloric tablet, it was found that there was no significant different (see Fig. 5). The AUC0-12 for Hyporic tablet were slightly lower than those calculated for Zyloric tablets. The same applies to the peak concentration Cmax (90.525ug/ml and 92.28ug/ml for Hyporic and Zyloric, respectively). The terminal half-life (t 1/2) for both drugs are 1.5 hr., were similar time and close to the values reported by (2).
Considering the pharmacokinetic parameters used in this study, one finds that the average values for the area under curve (AUC 0-12) corresponding to Hyporic tablet is slightly lower than the values determined for Zyloric tablet. However, statistical testing showed that the differences is insignificant.
The two formulations are bioequivalent for Hyporic tablet (SDI) and Zyloric tablets (GlaxoWellcome). In this study, no statistically significant difference in Cmax, AUC0-12 were found between Hyporic and Zyloric.
Acknowledgements
The authors are expressing their appreciations to all those who have assisted in the research, namely the staff of Pharmacy College, the Mutah’ University, and researchers at the Medical Research Centre at College of Pharmacy, Mutah’ University, Jordan.
Conflict of Interest
The authors do not have any conflict of interest.
Funding
There is not funding source
References
- Jill E Maddison, Stephen WPage and Timothy MDyke, 2009. Chapter 2 – Clinical pharmacokinetics in Small Animal Clinical Pharmacology (Second Edition). 2008, Pages 27-40.
- William N. Kelley and James B. Wyngaarden, Effects of allopurinol and oxipurinol on purine synthesis in cultured human cells. J Clin Invest. 1970 Mar; 49(3): 602–609.
- Frederic Derbre, Beatriz Ferrando, Mari Carmen Gomez-Cabrera, Fabian Sanchis-Gomar, et.al., (2012). Inhibition of Xanthine Oxidase by Allopurinol Prevents Skeletal Muscle Atrophy: Role of p38 MAPKinase and E3 Ubiquitin Ligases. Journal List Plops One v.7 (10); 2012.
- Klinenberg, J. R., Goldfinger, S. E., and Seegmiller, J. E. (1965). The effectiveness of the xanthine oxidase inhibitor allopurinol in the treatment of gout. Ann. Intern. Med. 62, 639–647.
- Wright, D.F., Stamp, L.K., Merriman, T.R., Barclay, M.L., Duffll, S.B., and Holford, N.H. (2013). The population pharmacokinetics of allopurinol and oxypurinol in patients with gout. European Journal of Clinical Pharmacology, 69 (7), 1411-1421.
- Shin HS, Lee HR, Lee DC, Shim JY, Cho KH, et al. (2006) Uric acid as a prognostic factor for survival time: a prospective cohort have a look at of terminally ill cancer patients. J Pain Symptom Manage 31: 493–501.
- Dena H. Jaffe, Alyssa B. Klein, Arriel Benis, Natalia M. Flores,Hagit Gabay, etal. Incident gout and chronic Kidney Disease: healthcare utilization and survival. BMC Rheumatologyvolume3, Article number: 11 (2019)
- Roddy E, Doherty M, Roddy E, Zhang W, Doherty M, Singh J, et al.(2010). Gout. Epidemiology of gout. Arthritis Res Ther. 2010; 12:223.
- Mikuls TR, Saag KG. New insights into gout epidemiology. Curr. Opin Rheumatol. 2006; 18:199–203.
- Suetonia C. Palmer, Allopurinol and kidney function: An update. Revue du Rhumatisme Volume 83, Issue 1, January 2016, Pages 19-24.
- Lisa K. Stamp, Murray L. Barclay. How to prevent allopurinol hypersensitivity reactions? 2018. Rheumatology, 57 (1):35–41.
- Alderman, M. H., Cohen, H., Madhavan, S., and Kivlighn, S. (1999). Serum uric acid and cardiovascular events in successfully treated hypertensive patients. Hypertension 34, 144–150.
- Kamilli I, Gresser U. Allopurinol and oxypurinol in human breast milk. Clin Investig. 1993; 71:161-4.
- Freedman, D. S., Williamson, D. F., Gunter, E. W., and Byers, T. (1995). Relation of serum uric acid to mortality and ischemic heart disease. Am. J. Epidemiol. 141, 637–644.
- Fukushima, S., Thamavit, W., Kurata, Y., and Ito, N. (1986). Sodium citrate: A promoter of bladder carcinogenesis. Jpn. J. Cancer Res.77, 1–4. 18.
- Qianrui Li, Xiaodan Li, Jing Wang, Hongdie Liu, Joey Sum-Wing Kwong, Hao Chen, Ling Li, Sheng-Chia Chung, Anoop Shah, Yaolong Chen, Zhenmei An, Xin Sun, Harry Hemingway, Haoming Tian, and Sheyu Li. Diagnosis and treatment for hyperuricemia and gout: a systematic review of clinical practice guidelines and consensus statements. BMJ Open. 2019; 9(8): e026677.
- John P. Forman, Hyon Choi, and Gary C. Curhan, Uric Acid and Insulin Sensitivity and Risk of Incident Hypertension. Arch Intern Med. 2009 Jan 26; 169(2): 155–162.
- Kannangra, D.R., Graham, G.G., Wright,D.F., Stocker, S.L., Portek, I., Pile, K.D., and Day, R.O. (2017). Individualizing the dose of allopurinol in patients with gout. British Journal of Clinical Pharmacology, 83(9), 2015-2026.
- 19. XiaLiu, Xiao-JiaNi, De-WeiShang , MingZhang, Jin-QingHu, ChangQiuaFu-TianLuo, Yu-GuanWen. Determination of allopurinol and oxypurinol in human plasma and urine by liquid chromatography-tandem mass spectrometry. Journal of Chromatography B 2013, 941:10-16.
- Helmy SA, El-Bedaiwy HM. Pharmacokinetics and comparative bioavailability of allopurinol formulations in healthy subjects. Clin Pharmacol Drug Dev. 2014; 3(5):353–357.
- Rathod DM, Patel KR, Mistri HN, Jangid AG, Shrivastav PS, Sanyal M. Simultaneous analysis of allopurinol and oxypurinol using a validated liquid chromatography-tandem mass spectrometry method in human plasma. J Pharm Anal. 2017; 7(1):56–62.
- Guerra P; Frias J; Ruiz B; Soto A; Carcas A; Govantes C; Montuenga C; Fernández A, Clinical Trials Unit, School of Medicine, Universidad Autónoma Madrid, Spain. Bioequivalence of allopurinol and oxipurinol in two tablet formulations Pedro. J. Clin. Pharm. Ther. 2001; 26 (2):113-9.
- 23. Wojciech Jawień. Searching for an optimal AUC estimation method: a never-ending task? J. Pharmacokinet Pharmacodyn. 2014; 41(6): 655–673.

