
Manuscript accepted on :25-01-2020
Published online on: 04-06-2020
Plagiarism Check: Yes
Reviewed by: Chaitany Patel
Second Review by: Ruchi Jakhmola
Final Approval by: Dr. Javad Sharifi-Rad
Rachna Sharma1*, P. Satyanarayana1, Pallavi Anand1 and Ganpati Aruna Kumari2
1Department of Biochemistry, Rama Medical College, Hospital and Research Centre, Kanpur
2Department of Pedodontics and Peventive Dentistry, Malla Reddy Dental College for Women, Suraram, Hyderabad.
Corresponding Author E-mail : drrachna99@gmail.com
DOI : https://dx.doi.org/10.13005/bpj/1963
Abstract
MDA level were established to be augmented in poor controlled T2DM and is positively correlated with progression of diabetes while adiponectin is negatively correlated with diabetes progression furthermore adiponectin high level is associated with low risk of cardio-metabolic complication and low risk of macro vascular complication in patient with T2DM. To find out the correlation between Adiponectin and MDA level in patient with T2DM (type 2 Diabetes Mellitus). 120 sample size, age above 30yrs, was taken in present study from sub urban population grouped as T2DM, Prediabetic and healthy non diabetic as control group Mean ±SD (n=120) MDA =3.94±1.02 in Diabetic group, MDA=1.93±0.31 in prediabetic group and control group MDA = 2.80±1.51, While adiponectin level Mean ±SD (n=120) in diabetic group =3.94±1.02, adiponectin in prediabetic group=9.72±0.31 and the control group adiponectin level =10.81±2.24 Our study suggest that MDA level are augmented with progression of Diabetes Mellitus (T2DM) especially poor controlled T2DM ,MDA blood level are high in T2DM and prediabetic group as compared to control group while low level of adiponectin was found in prediabetic patient group and T2DM group indicating risk of diabetic complication as compared to controlled group which have high level of adiponectin . Also the study confirmed Adiponectin is a reliable biochemical indicator and its correlation in diabetic patient, it reduces the risk of diabetes and diabetic complication and metabolic syndrome and insulin resistance.
Keywords
Adiponectin; Lipid Peroxidation; Malondialdehyde (MDA); Oxidative Stress; Pre diabetes; Type 2 Diabetes Mellitus
Download this article as:| Copy the following to cite this article: Sharma R, Satyanarayana P, Anand P, Kumari G. A. Adiponectin Level Association with MDA in the Patients with Type 2 Diabetes Mellitus. Biomed Pharmacol J 2020;13(2). |
| Copy the following to cite this URL: Sharma R, Satyanarayana P, Anand P, Kumari G. A. Adiponectin Level Association with MDA in the Patients with Type 2 Diabetes Mellitus. Biomed Pharmacol J 2020;13(2). Available from: https://bit.ly/2XwbUa0 |
Introduction
Diabetes mellitus is growing health issue with endless multiple complication and may lead to early death. Poor life style, obesity, aging, stress and several factors are implicated in the prevalence of the disease. The disease Diabetes Mellitus is established as a constellation of a number of metabolic disorders, and is characterized by hyperglycemia related to defects in insulin secretion and insulin action or both. The chronic hyperglycemia is associated with long-term damage, dysfunction, and failure of normal functioning of various organs, especially the eyes, kidneys, nerves, heart, and blood vessels [1, 2]. Diabetes-specific microvascular disease is a leading cause of blindness, renal failure, and nerve damage [3]. The prevalence of diabetes is rising all over the world due to population growth, aging, urbanisation, and the increase of obesity due to physical inactivity. In the year 2000, the global number of individuals with diabetes was estimated to be 171 million (2.8% of the world’s population), and this figure has been projected to increase in 2030 to 366 million (6.5%), 298 millions of whom will be living in developing countries [WHO, 1998][4]. According to International Diabetes Federation (IDF) data , the total number of people in India with diabetes are reported to be 50.8 millions in 2010 and would be 87.0 million by 2030 [5] .
Adiponectin
Fatty tissue (adipose tissue) discharge a cytokine called Adiponectin, and enormously secreted in white adipose tissue. Adiponectin triggers 5’AMP initiated protein kinase and countless other protein enzymes kinases. Additionally AMPK pathway can increase glucose uptake and use and free fatty acid (FFA) oxidation in various tissue like skeletal muscle cells, hepatocyte (liver) and fatty tissue (adipose tissue), thus controlling rate of metabolism and insulin sensitivity [6-8]. Adiponectin can also impede the mutilation on blood vessel especially the vascular endothelial cells from inflammatory elements and thus shield the cardiovascular system [9, 10]. Adiponectin is linked with many diseases as the study suggests it is linked to obesity, insulin resistance, T2DM etc [11]. Adiponectin, an adipose tissue-specific plasma protein, was recently revealed to have anti-inflammatory effects on the cellular components of vascular wall.
Adiponectin Receptors
Adiponectin receptor 1 and adiponectin receptor 2 are of two main categories nominated as AdipoR1, AdipoR2. AdipoR1and AdipoR2 precisely expressed in a diverse tissue, but their dispersal is different [12]. In vitro investigational facts suggest that AdiPoR1 appearance is essentially seen in vascular endothelial cells and blood macrophages [13], signifying that in vascular pathophysiology AdiPoR1 may be tangled.
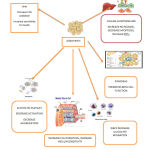 |
Scheme 1: Various action for adiponectin at Cellular Levels |
Oxidative Stress and Diabetes
Oxidative stress plays a pivotal role in cellular injury from hyperglycaemia. Oxidative stress is principally discrepancy between the rate of production of free radicals and the capacity of the body system to counter or detoxify their detrimental effects through neutralization by antioxidants. It can cause noxious effects through the assembly of peroxides and free radicals that mutilate all apparatuses of the cell, including proteins, lipids, and DNA. High glucose level can stimulate free radical production. Fragile shielding system of the human body becomes incapable to impede the enhanced ROS generation and as a result condition of imbalance between ROS and their protection occurs which leads to domination of the condition of oxidative stress [15,16] . Oxidative stress acts as mediator of insulin resistance and its progression to glucose intolerance and installation of diabetes mellitus, subsequently favouring the appearance of atherosclerotic complications, and contributes to rise in many micro and macrovascular complications [17]. Some imperative oxidative stress biological indicators or markers during diabetes are MDA: malondialdehyde, AOPP: Advanced oxidation protein products, PCO: protein carbonyls.
Lipid Peroxidation
Lipids are reported as one of the primary targets of ROS. Peroxidation of lipids in cell membrane produces extremely reactive molecules like aldehydes, including MDA, acrolein, 4-hydroxynonenal (HNE), 4-oxononenal (ONE), and isolevuglandins (IsoLGs) [18]. Lipid peroxidation is the oxidative degradation of lipids. It is phenomenon of stealing of electrons from the lipid molecules present in cell membranes, leading to cell damage. This process occurs and executed through free radical chain reaction mechanism. Malondialdehyde is a highly reactive compound and results from lipid peroxidation of polyunsaturated fatty acids (19). Increased MDA level in plasma, serum, and many others tissues has been reported in diabetic patients [20, 21].Furthermore, various antioxidant assays are described in vitro and vivo [22]. Similar work on oxidative stress in diabetes mellitus and MDA level in diabetes and its correlation with HbA1c and altered biomolecules due to oxidative stress in diabetes is highlighted [23, 24, 25, 26, 27].Moreover the complication of poorly controlled blood glucose concentration in diabetic patient include micro and macro vascular, neurological and end organ damages like kidney, peripheral digits. Complications such as diabetic retinopathy, nephropathy with various molecular target and various novel drugs for newly discovered molecular targets [28-39] are under scanner of researcher, neuropathy, gastropathy and dyslipidaemia are currently in limelight and therapy to control and manage such complications with new mode of drug delivery by nanoparticles or by gene delivery or by gene silencing [40] along with identification of reliable biomarker for prognosis of disease.
Materials and Methods
Study Design
Cross Sectional Case Control study
Study Group
Controls, pre diabetic and Diabetic patients.
Sample Size Calculation
This study is a hospital based study.120subjects was selected in this study. The prevalence of diabetes in the previous study conducted in Uttar Pradesh region was 11.6% [41]. Using this, the sample size n at 95% confidence and the error of 5 % is – n= no. of samples z = z score at 95% confidence p = prevalence c = error
𝑛 = (𝑧) 2 × 𝑝 × 1 − 𝑝/𝑐²
Place of Work
The study was carried out in the Department of Biochemistry, Rama Medical College Hospital & Research centre, Kanpur.
Study Population
Patients were selected from both outpatient and inpatient department in random method. The information collected is according to prescribed format.
Case definition of Diabetes Mellitus
Based on criteria laid by the WHO guidelines [42, 43, 44] i.e. Fasting Plasma Glucose: ≥126 mg/dl. Impaired Fasting Glucose (IFG): 110-126 mg/dl. Post Prandial Plasma Glucose: ≥ 200 mg/dl. Impaired Post Prandial Glucose: 140-199 mg/dl.
Inclusion Criteria
Patients with type 2 Diabetes Mellitus (according to ADA criteria for diabetes)
Pre-diabetes (Impaired Fasting Glucose/Impaired Postprandial Glucose)
Age group > 30
Exclusion Criteria
Patients with any systemic disease e.g. asthma, chronic obstructive pulmonary disease (COPD), malignancies, Sexually Transmitted Diseases, cardiovascular disease
Patients with Type 1 diabetes mellitus.
Groups
Group I
Type 2 Diabetes Mellitus
Group II
Prediabetic Group
Group III
Healthy non diabetic group was used as control
Methods
Collection of Sample
5 ml of venous (antecubital vein) blood collected after overnight fasting with all aseptic precautions in three parts. The first part was collected in Ethylene Diamine Tetra-Acetate (EDTA) vial for estimation of HbA1c. The second part was collected in plain vial for determination of serum Adiponectin and serum MDA.
Methodology
MDA and Adiponectin were estimated by kit based double-antibody sandwich enzyme-linked immunosorbent ELISA methods. Serum glucose was estimated by kit based glucose oxidase peroxidase method and HbA1c by nephelometry method.
Statistical Analysis
Appropriate statistical method was applied within the groups.
The results are presented in mean±SD and percentage. Percentage of test was used to compare the categorical variables between Diabetes, Prediabetes and Control. Unpaired t-test was used to compare thestudy parameters between cases and controls. The Pearson correlation coefficient was calculate damong the study parameters. The p-value<0.05 was considered significant. All the analysis was carried out by using SPSS 21.0 version (Chicago, Inc., USA).
Result
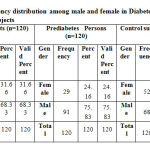 |
Table 1: Frequency distribution among male and female in Diabetes and Prediabetes and Control subjects |
Table 1: In Diabetes Patients group, 38 (31.66%) patients were females and 82 (68.33%) were males whereas in Prediabetes Persons group, there were 29 (24.16%) males and 91 (75.83%) were females. In Control subjects there were 52 (43.33%) males and 68 (56.66%) were females.
Table 2: Clinical Characteristics of Diabetes and Prediabetes and Control Subjects Participating in the Study
| Diabetes
Mean ±SD (n=120) |
Prediabetes
Mean ±SD (n=120) |
Control Subjects
Mean ±SD (n=120) |
|
| Age | 54.68±10.67 | 47.23±2.06 | 48.07±10.02 |
| MDA | 3.94±1.02 | 2.80±1.51 | 1.93±0.31 |
| Adiponectin | 6.55±0.66 | 9.72±0.31 | 10.81±2.24 |
Table 2: In normal individual group, all the serum values were in normal range. In the clinical characteristics of Diabetes is higher in age group compared to Prediabetes (54.68±10.67 vs 47.23±2.06) Prediabetes to Control Subjects is below age group (47.23±2.06vs 48.07±10.02). Diabetes is higher in MDA compared to Prediabetes (3.94±1.02vs 2.80±1.51) Prediabetes to Control Subjects is below age group (2.80±1.51vs 1.93±0.31). Diabetes is higher in MDA compared to Prediabetes (6.55±0.66 vs 9.72±0.31) Prediabetes to Control Subjects is below age group (9.72±0.31vs 10.81±2.24).
Table 3: Pearson Correlation Coefficient among the Biochemical Parameters in Diabetes Cases
| Correlations | |||||
| ADPN ng/ml | MDA ng/ml | ADPN ng/ml | MDA ng/ml | ||
| ADPN ng/ml | Pearson Correlation | 1 | -.113 | -.015 | .105 |
| Sig. (2-tailed) | .219 | .871 | .255 | ||
| N | 120 | 120 | 120 | 120 | |
| MDA ng/ml | Pearson Correlation | 1 | .017 | -.047 | |
| Sig. (2-tailed) | .851 | .612 | |||
| N | 120 | 120 | 120 | ||
| ADPN ng/ml | Pearson Correlation | 1 | -.011 | ||
| Sig. (2-tailed) | .903 | ||||
| N | 120 | 120 | |||
| MDA ng/ml | Pearson Correlation | 1 | |||
| Sig. (2-tailed) | |||||
| N | 120 | ||||
**. Correlation is significant at the 0.01 level (2-tailed). ADPN- Adiponectin, MDA- Malondialdehyde
Table 4 & Fig. 1-3: Shows the correlation matrix which represents the quantitative measurements of degree of relationship among different variables. The table showed that MDA and ADPN was negatively correlated with mild correlation (r=-.113, p=0.219) in cases. There is negative correlation between ADPN and MDA (r=-0.011 p=0.903). In figure association between MDA and Adiponectin in Diabetes Cases strongly correlated (r value = 0.013). Association between Adiponectin in Diabetes & Control Subjects are strongly correlated (r value = 0.016) MDA and Adiponectin in Diabetes & Control Subjects strongly correlated (r value = 0.003).
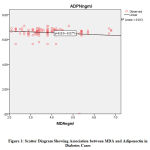 |
Figure 1: Scatter Diagram Showing Association between MDA and Adiponectin in Diabetes Cases |
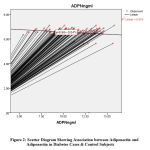 |
Figure 2: Scatter Diagram Showing Association between Adiponectin |
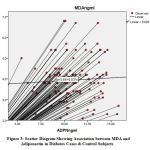 |
Figure 3: Scatter Diagram Showing Association between MDA |
Table 4: Pearson Correlation Coefficient among the Biochemical Parameters in Diabetes & Prediabetes Cases
| Correlations | |||||
| ADPN ng/ml | MDA ng/ml | ADPN ng/ml | MDA ng/ml | ||
| ADPN ng/ml | Pearson Correlation | 1 | -.113 | -.128 | .043 |
| Sig. (2-tailed) | .219 | .162 | .639 | ||
| N | 120 | 120 | 120 | 120 | |
| MDA ng/ml | Pearson Correlation | 1 | .057 | -.117 | |
| Sig. (2-tailed) | .538 | .205 | |||
| N | 120 | 120 | 120 | ||
| ADPN ng/ml | Pearson Correlation | 1 | -.626** | ||
| Sig. (2-tailed) | .000 | ||||
| N | 120 | 120 | |||
| MDA ng/ml | Pearson Correlation | 1 | |||
| Sig. (2-tailed) | |||||
| N | 120 | ||||
**. Correlation is significant at the 0.01 level (2-tailed). ADPN- Adiponectin, MDA- Malondialdehyde
Table 4 & Fig. 4-6: Shows the correlation matrix which represents the quantitative measurements of degree of relationship among different variables. The table showed that diabetic and prediabetes was ADPN and ADPN was negative correlation mildly correlated (r=-.128, p=0.162) in cases. There is negative correlation between ADPN and MDA (r=-0.011 p=0.903) & MDA & ADPN was (r=0.057 p=0.538). Association between MDA and Adiponectin in Diabetes Cases strongly correlated (r value = 0.013). Association of prediabetes MDA and ADPN in Prediabetes Cases negative strongly correlation & strongly significant (r =-0.626** p=0.000). In figure association between ADPN and MDA in Prediabetes Cases correlated (r value = 1.266) Association between Adiponectin and Adiponectin in Prediabetes Cases & Control Subjects strongly correlated & significant (r=0.005). MDA and Adiponectin in Prediabetes Cases & Control Subjects (r=0.059)
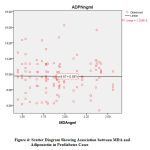 |
Figure 4: Scatter Diagram Showing Association between MDA |
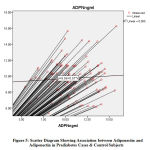 |
Figure 5: Scatter Diagram Showing Association between Adiponectin |
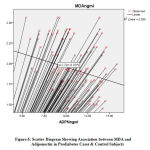 |
Figure 6: Scatter Diagram Showing Association between MDA |
Table 5: Pearson Correlation Coefficient among the Biochemical Parameters in Diabetes cases & Control Subjects
| Correlations | |||||
| ADPN ng/ml | MDA ng/ml | ADPN ng/ml | MDA ng/ml | ||
| ADPN ng/ml | Pearson Correlation | 1 | -.011 | .074 | .025 |
| Sig. (2-tailed) | .903 | .423 | .787 | ||
| N | 120 | 120 | 120 | 120 | |
| MDA ng/ml | Pearson Correlation | 1 | -.243** | .244** | |
| Sig. (2-tailed) | .008 | .007 | |||
| N | 120 | 120 | 120 | ||
| ADPN ng/ml | Pearson Correlation | 1 | -.626** | ||
| Sig. (2-tailed) | .000 | ||||
| N | 120 | ||||
| MDA ng/ml | Pearson Correlation | 1 | |||
| Sig. (2-tailed) | |||||
| N | 120 | ||||
**. Correlation is significant at the 0.01 level (2-tailed). ADPN- Adiponectin, MDA- Malondialdehyde
Table 4 & Fig. 1-4: Shows the correlation matrix which represents the quantitative measurements of degree of relationship among different variables. The table showed that Diabetes cases & Control Subjects was MDA and ADPN was negative correlation mildly correlated (r=-.011, p=0.903) in cases. There is negative correlation between ADPN and MDA and strongly significance (r=-0.249 p=0.008). Prediabetes MDA and ADPN in diabetes & control group negative strongly correlation & strongly significant (r =-0.626** p=0.000).
Discussion
Adiponectin gene is traced in human being on chromosome 3q27 region, which has been establish to be linked with T2DM and metabolic syndrome [45-47]. It has a molecular weight of 30kDa and the programming gene encompasses 244 amino acids four areas of Adiopnectin cytokine encompasses of the N-terminal signal peptide area, the non-helical functional area, the collagen area and the carboxyl terminal globular area [48]. Foregoing research have presented that serum adiponectin level were considerably declined in persons with metabolic syndrome, coronary heart disease obesity, T2DM, and hypertension [49].
In present research study, serum Adiponectin level prediabetic groups and in T2DM were established with low level than that in controlled group. Related with healthy controls, the T2DM cases revealed substantially lower level of serum Adiponectin, which was reliable and verified with results from preceding exploration. Yamauchi T et al. [45] establish that Adiponectin might improve muscle FFA oxidation and energy utilization, and decrease the level of TG in Hepatocytes and skeletal muscle cells, thus retreating insulin resistance [45].
Maeda N et al. [50] testified that Adiponectin could instigate various cells especially skeletal muscles, hepatocytes to insulin via increasing muscle free fatty acid oxidation and hindering glucose output from liver as demonstrated in animal study by genetic manipulation especially knocking out Adiponectin gene in mice [50]. More over adiponectin can govern carbohydrate metabolism and increase insulin sensitivity in peripheral tissues. In our investigation, serum Adiponectin concentration in blood displayed highly positive correlation between the diabetic and control group and prediabetic and control group P < 0.01, which was reliable with the preceding exploratory studies [51].
Furthermore, our study displayed T2DM patients and prediabetic patient have low blood level of adiponectin as compared to healthy individual similarly serum MDA blood level were high in T2DM and prediabetic patient as compared to normal healthy individuals thus suggesting both MDA and blood level of adiponectin are reliable forecaster biochemical parameter to analyse the progression of T2DM. Nilsson PM et al. also got equivalent deduction, and stated that the blood level of Adiponectin was negatively linked with carotid artery intima-media width, signifying that Adiponectin was a biochemical parameter and reliable indicator for subclinical cases of atherosclerosis and might forecast the risk for myocardial infarction and cerebral stroke [52].
Jiang et al. testified that in patient with peripheral vascular disease with onset in T2DM the blood level of adiponectin was negatively associated with disease [53]. Though, there were still some deficiencies in present research. Primarily, the sample size is taken from specific geographical location and other confounding factor which might alter the blood level of MDA and adiponectin may factor which might alter the reading in specified subset of population. Furthermore, the molecular and cellular mechanism of Adiponectin and its receptor signalling pathway in regulating carbohydrate metabolism, lipid metabolism, immunological effect, anti-proliferative effect, anti-thrombotic action and T2DM is still area to explore in detail.
Conclusion
Presently, adiponectin is amongst the durable and best reliable as a dual biochemical marker forecaster of type 2 DM and Obesity patients. Adiponectin low level are associated with high risk for cardio-metabolic complication and macro vascular complication in patient with T2DM.MDA level where established to be augmented in poor controlled T2DM and is positively correlated with progression of diabetes while
We concluded this study was higher levels of circulating adiponectin are associated with a lower risk of type 2 diabetes, poor control of type 2 diabetes. For clinical investigation in adiponectin parameter reveal its potential as a biomarker in assessment of prediabetes state and T2DM screening.
Acknowlegement
All authors are very helpful to the department of Biochemistry, Rama Medical College, Hospital & Research Centre Kanpur, India for help in writing the paper.
Conflict of Interest
The authors declare no conflict of interest.
Funding
No receipt any financial support for the research
Ethical Permission
Ethical approval to conduct this study was obtained from Rama Medical College, Hospital & Research Centre Kanpur, India ethical board.
References
- American Diabetes Association, “Diagnosis and classification of diabetes mellitus,” Diabetes Care, 35(1), S64–S71, 2012.
- Paneni, J. A. Beckman, M. A. Creager, and F. Cosentino, “Diabetes and vascular disease: pathophysiology, clinical consequences, and medical therapy: part I,” European Heart Journal, 34(31), 2436–2443, 2013.
- T. Cade, “Diabetes-related microvascular and macrovascular diseases in the physical therapy setting,” Physical Therapy, 88(11) 1322–1335, 2008.
- World Health Organization Consultation Group. Definition, diagnosis and classification of diabetes mellitus and its complications. Part 1: [125] diagnosis and classification of diabetes mellitus. Provisional report of a WHO Consultation. Diabetic Medicine 1998; 15: 539-553.
- Ramachandran, A. K. Das, S. R. Joshi, C. S. Yajnik, S. Shah, and K. M. P. Kumar, “Current status of diabetes in India and need for novel therapeutic agents,” Journal of Association of Physicians of India, 58; 7–9, 2010.
- Achari AE, Jain SK: adiponectin, a therapeutic target for obesity, diabetes and endothelial dysfunction. Int J Mol Sci 2017; 18: pii: E1321.
- Yamauchi T, Kadowaki T: physiological and pathophysiological functions of the adiponectin and adiponectin receptors in the integrated regulation of metabolic and cardiovascular diseases. Int J Obes (Lond) 2008; 32: S13-18.
- Liu M, Liu F: regulation of multimerization, signaling and function of adiponectin. Best Pract Res Clin Endocrinol Metab 2014; 28: 25-31.
- Ohashi K, Ouchi N, Matsuzawa Y: anti-inflammatory and antiatherogenic properties of adiponectin. Biochimie 2012; 94: 2137-2142.
- Letter L, Sena C: Cerebrovascular Disease: Consequences of Endothelial Dysfunction Induced by Obesity. Adv Neurobiol 2017; 19: 163-189.
- Van Andel M, Heijboer AC, Drent ML: Adiponectin and its isoforms in physiopathology. Adv Clin Chem 2018; 85: 115-147.
- Yamauchi T, Iwabu M, Okada-Iwabu M, Kadowaki T: Adiponectin Receptors: a review of their structure, function and how they work. Best Pract Res Clin Endocrinol Metab 2014; 28: 15-23.
- Parker-Duffen JL, Walsh K: cardiometabolic effects of adiponectin. Best Pract Res Clin Endocrinol Metab 2014; 28: 81-91.
- Kadowaki T, Yamauchi T, Kubota N, Hara K, Ueki K, Tobe K. Adiponectin and adiponectin receptors in insulin resistance, diabetes, and the metabolic syndrome. J Clin Invest. 2006; 116 (7): 1784-179.
- Halliwell and J. Gutteridge, Free Radicals in Biology and Medicine, Oxford University Press, New York, NY, USA, 4th edition, 2007.
- B. Pandey, N. Mishra, and S. I. Rizvi, “Protein oxidation biomarkers in plasma of type 2 diabetic patients,” Clinical Biochemistry, 43; 4-5, pp. 508–511, 2010.
- Negre-Salvayre, R. Salvayre, N. Augé, R. Pamplona, and M. Portero-Otín, “Hyperglycemia and glycation in diabetic complications,” Antioxidants and Redox Signaling, vol. 11, no. 12, pp. 3071–3109, 2009.
- Guo, Z. Chen, V. Amarnath, and S. S. Davies, “Identification of novel bioactive aldehydemodified phosphatidylethanolamines formed by lipid peroxidation,” Free Radical Biology and Medicine, 53(6); 1226–1238, 2012.
- Davey MW1, Stals E, Panis B, Keulemans J, Swennen RL (2005). “High-throughput determination of malondialdehyde in plant tissues”. Analytical Biochemistry. 347 (2): 201– 207.
- A. Moussa, “Oxidative stress in diabetes mellitus,” Romanian Journal of Biophysics, 18; 225–236, 2008.
- de M. Bandeira, G. da S. Guedes, L. J. S. da Fonseca, A. S. Pires, D. P. Gelain, and J. C. Moreira, “Characterization of blood oxidative stress in type 2 diabetes mellitus patients: increase in lipid peroxidation and SOD activity,” Oxidative Medicine and Cellular Longevity, vol. 2012, Article ID 819310, 13 pages, 2012.
- Soni, Navneet Omprakash. “Antioxidant assay in vivo and vitro.” Int J Phytopharmacol5; 2014: 51-58.
- Singh, P., Manish Kumar Verma, Pratibha Tripathi, and Durgesh Singh. “Study of oxidant (MDA) and antioxidants (SOD and Vitamin E) in hypertensive patients and normotensive individuals.” International Journal of Life-Sciences Scientific Research2(1); 2016: 9-14.
- Alam R, Verma MK, Verma P. Glycated hemoglobin as a dual biomarker in type 2 diabetes Mellitus predicting glycaemic control and dyslipidemia risk. Int J Life Sci Scienti Res. 2015;1(2):62-5.
- Tripathi, Pratibha, Manish Kumar Verma, Shiv Shankar Tripathi, and Shashi Prabha Singh. “Comparative Study of Malondialdehyde and Vitamin C in Type 2 Diabetes Mellitus and Non Diabetic Individuals.” J. Life. Sci. Scienti. Res 2(1); 2016: 31-36.
- Verma, Manish, Roshan Alam, and Mohd Mobin. “Review on Malondialdehyde and Superoxide dismutase levels in patients of Type 2 Diabetes Mellitus with Retinopathy and without Retinopathy.” Int J Life Sci Scienti Res1(2); 2015: 52-7.
- Verma MK, Verma P. Role of Oxidant Alteration of Biomolecules in Diabetes and Other Associated Diseases. Int. J. Life. Sci. Scienti. Res., 2018; 4(1):1542-1549.
- Navneet Omprakash Soni, Dr. “TGF-Β Inhibitors Are Novel Drugs -In Diabetic Nephropathy a Review.” World Journal of Pharmacy and Pharmaceutical Sciences, 2017, 622–45.
- Navneet Omprakash Soni, Dr. “Embryonic Life OF HDAC Inhibitors: – In Diabetic Nephropathy.” World Journal of Pharmacy and Pharmaceutical Sciences, 2017, 345–59.
- Navneet Omprakash Soni, Dr. “FAP Inhibitors: In Diabetic Nephropathy?” World Journal of Pharmacy and Pharmaceutical Sciences, 2017, 321–26.
- Navneet Omprakash Soni, Dr. “Fructokinase Inhibitors–In Diabetic Nephropath.” World Journal of Pharmacy and Pharmaceutical Sciences, 2017, 339–44.
- Navneet Omprakash Soni, Dr. “SIRT-1 activators –in diabetic nephropathy.” World Journal of Pharmacy and Pharmaceutical Sciences, 2017, 316–20.
- Navneet Omprakash Soni, Dr. “Targeting DNA Methyl Transferase 1[Dnmt1]- In Diabetic Nephropathy.” World Journal of Pharmacy and Pharmaceutical Sciences, 2017, 333–38.
- Navneet Omprakash Soni, Dr. “Targeting LTB4 –BLT1 – in diabetic nephropathy?” World Journal of Pharmacy and Pharmaceutical Sciences, 2017, 312–15.
- Navneet Omprakash Soni, Dr. “monaschin and ankaflavin- in diabetic nephropathy?” World Journal of Pharmacy and Pharmaceutical Sciences, 2017, 327–32.
- Navneet Omprakash Soni, Dr. “resveratrol nanoparticle’s formulation – in diabetic nephropathy.” World Journal of Pharmacy and Pharmaceutical Sciences, 2017, 368–86.
- Navneet Omprakash Soni, Dr. “NADPH Oxidase Inhibitors –Are Novel Drugs In Diabetic Nephropathy A Review.” World Journal of Pharmacy and Pharmaceutical Sciences, 2017, 765–75.
- Om Prakash Soni, Navneet. “TRPC 6 as a Molecular Target in Diabetic Nephropathy.” International Journal of Life-Sciences Scientific Research 3 (2017): 1311–14.
- Navneet Omprakash Soni Drugs for Diabetic Nephropathy- Full Review World Journal of Pharmacy And Pharmaceutical Sciences. 2017; 6(7), 1958-2022.
- Omprakash Soni, Navneet. “Biodegradable Nanoparticles for Delivering Drugs and Silencing Multiple Genes or Gene Activation in Diabetic Nephropathy.” Int J Life Sci Scienti Res 3 (2017): 1329–38.
- Ramachandran A, Snehalatha C, Kapur A, Vijay V, Mohan V, Das AK, Rao PV, Yajnik CS, Prasanna Kumar KM, Nair JD. Diabetes Epidemiology Study Group in India (DESI). High prevalence of diabetes and impaired glucose tolerance in India: National Urban Diabetes Survey. Diabetologia. 2001; 44(9):1094–101.
- Definition and diagnosis of diabetes mellitus and intermediate hyperglycemia: report of a WHO/IDF consultation (PDF). Geneva: World Health Organization. 2006. p. 21. ISBN 978- 92-4-159493-6.
- Vijan, S (March 2010). “Type 2 diabetes”. Annals of Internal Medicine. 152 (5):ITC31- 15.
- Diabetes Care, January 2010″. American Diabetes Association. Retrieved 2010-01-29.
- Yamauchi T, Kamon J, Waki H, Terauchi Y, Kubota N, Hara K, Mori Y, Ide T, Murakami K, Tsuboyama-Kasaoka N, Ezaki O, Akanuma Y, Gavrilova O, Vinson C, Reitman ML , Kagechika H, Shudo K, Yoda M, Nakano Y, Tobe K, et al .: The fat-derived adiponectin hormone reverses the insulin resistance associated with lipoatrophy and obesity. Nat Med 2001; 7: 941-946.
- Lindberg S, Jensen JS, Pedersen SH, Galatius S, Frystyk J, Flyvbjerg A, Bjerre M, Mogelvang R: low levels of adiponectin and increased risk of type 2 diabetes in patients with myocardial infarction. Diabetes Care 2014; 37: 3003-3008.
- Wang G, Gao S, Su N, Xu J, Fu D: plasma adiponectin levels are inversely correlated with clinical parameters in patients with type 2 diabetes mellitus with macrovascular diseases. Ann Clin Lab Sci 2015; 45: 287-291.
- Scherer PE, Williams S, Fogliano M, Baldini G, Lodish HF: a new serum protein similar to C1q, produced exclusively in adipocytes. J Biol Chem 1995; 270: 26746-26749.
- Arita Y, Kihara S, Ouchi N, Takahashi M, Maeda K, Miyagawa J, Hotta K, Shimomura I, Nakamura T, Miyaoka K, Kuriyama H, Nishida M, Yamashita S, Okubo K, Matsubara K, Muraguchi M, Ohmoto And, Funahashi T, Matsuzawa Y: Paradoxical decrease of a specific fat protein, adiponectin, in obesity. 1999. Biochem Biophys Res Commun 2012; 425: 560-564.
- Maeda N, Shimomura I, Kishida K, Nishizawa H, Matsuda M, Nagaretani H, Furuyama N, Kondo H, Takahashi M, Arita Y, Komuro R, Ouchi N, Kihara S, Tochino Y, Okutomi K, Horie M, Takeda S, Aoyama T, Funahashi T, Matsuzawa Y: diet-induced insulin resistance in mice lacking adiponectin / ACRP30. Nat Med 2002; 8: 731-737.
- Kim MJ, Yoo KH, Park HS, Chung SM, Jin CJ, Lee Y, Shin YG, Chung CH: Plasma adiponectin and insulin resistance in type 2 diabetes mellitus in Korea. Yonsei Med J 2005; 46: 42-50.
- Nilsson PM, Engstrom G, Hedblad B, Frystyk J, Persson MM, Berglund G, Flyvbjerg A: plasma adiponectin levels in relation to the thickness of the carotid intima and insulin resistance markers. Arterioscler Thromb Vasc Biol 2006; 26: 2758-2762.
- Jiang W, Tang Q, Zhang L, Chao Y, Hong B: association of serum protein related to serum C1q tumor necrosis factor with the severity of peripheral arterial disease of the lower extremity in patients with type 2 diabetes. Diab Vasc Dis Res 2018; 15:270-273.
- Sattar N, Wannamethee SG, Forouhi NG. Novel Biochemical risk factors for type 2 diabetes: pathogenic perspectives or prediction possibilities? Diabetology 2008; 51 (6): 926-940.
- Swarbrick MM, Havel PJ. Physiological, pharmacological and nutritional regulation of circulating adiponectin concentrations in humans. Metabolic Syndrome Related Disorder 2008; 6 (2): 87-102.
- Fargnoli JL, Fung TT, Olenczuk DM, Chamberland JP, Hu FB, Mantzoros CS. Adherence to healthy eating patterns is associated with greater total circulation and high molecular weight adiponectin and lower resistin concentrations in women from Nurses’ Health Study. I’m J Clin Nutr. 2008; 88 (5): 1213-1224.
- Cook NR. Statistical evaluation of the forecast versus diagnosis models: beyond the ROC curve. Clinic Chem. 2008; 54 (1): 17-23.
- Hajer GR, van Haeften TW, Visseren FL. Adipose Tissue dysfunction in obesity, diabetes and vascularization. Eur Heart diseases J. 2008; 29 (24): 2959-2971.
- Soni, Navneet Omprakash. “Drugs for Diabetic Nephropathy-full review.” World journal of Pharmacy and Pharmaceutical Sciences.6 (7); 2017: 1958-2022.
- Su, N., N. Zhao, G. Wang, L. Wang, Y. Zhang, R. Li, Y. Liu, X. Yang, C. Li, and M. Hou. “The Effects of Adiponectin and Adiponectin Receptor 1 Levels on Macrovascular Complications Among Patients with Type 2 Diabetes Mellitus.” Cellular physiology and biochemistry: international journal of experimental cellular physiology, biochemistry, and pharmacology 52(2); 2019: 225-231.

