
Manuscript accepted on :11-01-2020
Published online on: 23-01-2020
Plagiarism Check: Yes
Reviewed by: vikram singh
Second Review by: Jerwin Prabu
Final Approval by: Ayush Dogra
P. R. Wankhede* and K. B. Khanchandani
Electronics and Telecommunication Engineering, Shri Sant Gajanan Maharaj College of Engineering, Shegaon, India, 444203
Corresponding Author E-mail: pravin.india1@gmail.org
DOI : https://dx.doi.org/10.13005/bpj/1859
Abstract
Computer aided design is in demand for diabetic retinopathy screening systems. Microaneurysms are the first observations as sign of Non-prolific diabetic retinopathy. Number of microaneurysms in retinal image helps to find severity of diabetic retinopathy. This paper presents a method to detect microaneurysms in retinal fundus images. Non illuminated and varying field of view images preprocess initially, so that non lesion and lesion features can be clearly visible for proper detection. Then negative pixel intensity rank transform (PIRT) is used to find smooth regions and edges in retinal images. In next step, optic disc and blood vessels are subtracted from rank transform image. Finally true microneurysms candidates are selected using histogram thresholding. The proposed method is evaluated on publicly available datasets DIARETDB1 and E-optha MA. The performance parameters sensitivity, specificity, and accuracy achieved are 98.79%, 83.33%, and 97.75% respectively for DIARETDB1 database and 94.59%, 96.56% and 95.80% respectively for E-optha MA database. The results show that proposed method is able to detect microaneurysms efficiently in retinal images for diagnosis of diabetic retinopathy.
Keywords
Computer Aided Diagnosis; Image Enhancement; Image Segmentation; Microaneurysm; Rank Transform; Retinal Image
Download this article as:| Copy the following to cite this article: Wankhede P. R, Khanchandani K. B. Automated Microaneurysms Detection from Retinal Fundus Images using Pixel Intensity Rank Transform. Biomed Pharmacol J 2020;13(1). |
| Copy the following to cite this URL: Wankhede P. R, Khanchandani K. B. Automated Microaneurysms Detection from Retinal Fundus Images using Pixel Intensity Rank Transform. Biomed Pharmacol J 2020;13(1). Available from: https://bit.ly/2GftGVp |
Introduction
Diabetic retinopathy (DR) is one of the ocular diseases with highest number of patients. As per the report [1] of Indian Optometry Federation (IOF) published in the year 2010, an estimated 500 million people of India’s population of 1.25 billion require vision correction through spectacles, contact lenses or refractive surgery to be able to perform and functioning normal in their routine life. More than 26 million people are blind or vision impaired due to different ocular diseases. It is painful to note that 133 million people, including 11 million children, are blind or vision impaired simply due to lack of an eye examination facilities. The main reason is inadequate number of professionally trained optometrists in India. Only less than 50% of current requirement of optometrists are available to provide necessary vision care to all the people of the country.
Screening is an effective way for early detection of ocular diseases. Fundus cameras are used to acquire retinal image for detection and assessment of ocular diseases. These retinal images contain normal (optic disc, blood vessels and fovea) and pathological features (microaneurysms and exudates). Microaneurysms are the first sign of presence of proliferative diabetic retinopathy (NPDR). Microaneurysms count can decide the severity of DR. Figure 1 show the microaneurysm patches in retinal image.
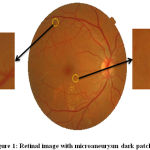 |
Figure 1: Retinal image with microaneurysm dark patches |
Many attempts have been made to detect microaneurysms from retinal images. The methods for microaneurysms detection can be categorized into morphological image processing, supervised classification, and template matching based algorithms. Here we have made attempt to detail some of the methods proposed for microaneurysms (MAs) detection.
A simple morphological image processing based algorithm is presented by spencer et al. [5]. MAs detected using top-hat transformation and matched filtering. Then thresholding is used to select accurate MAs. Finally region growing is used to get MA candidates. Eight intensity features of MAs are extracted to find accurate MAs by Cree et al. [6]. Region growing is used to improve specificity of proposed algorithm. An image compression based technique using wavelets is proposed by Hangsen et al. [7]. The results show more accuracy. A pixel operator called “moat operator” is used by Sinthanayothin et al. [8]. This operator helps to sharp the edges of MAs. Then region growing and thresholding is used for final segmentation. Extension of this work was proposed by Usher et al. [9]. An artificial neural network is used to classify diabetic retinopathy.
Two-dimensional principal component analysis is used to extract Haemorrhages from retinal images by Zhang et al [10]. Then classification is done using support vector machine (SVM). A pixel classification is used to detect MAs and use of k-nearest neighbor (kNN) proposed by Niemeijer et al. [11] for lesion detection. In terms of computational time the method was not good. Akram et al. [12] have presented a hybrid classifier method for detection and grading of DR. The extension of this work and improvement of efficiency is proposed by [13] which outperform to classify image for DR.
The template matching based on wavelet transform lesion detection was proposed by Quellec et al. [14]. Though the computational time was less but proposed method reject MA candidates which are near to blood vessels. Zhang et al. [15] have proposed multi-scale correlation filtering based template matching method. A sliding window of multi scale Gaussian kernel is used to calculate high correlation coefficient. False detection occurred in this method when low contrast images were used. The dynamic multi-parameter template matching for microaneurysms detection is used by Ding et al. [16].
As there is scope to improve microaneurysm detection in retinal images, we proposed a new method to detect microaneurysms using pixel intensity rank (![]() -rank) transform (PIRT). The section 2 will detail the methodology used in our proposed method. Experimental results are elaborated in section 3. Finally conclusion is discussed in section 4.
-rank) transform (PIRT). The section 2 will detail the methodology used in our proposed method. Experimental results are elaborated in section 3. Finally conclusion is discussed in section 4.
Methods and Materials
This section presents publicly available retinal image database that are used for evaluation of proposed method also detail methodology is presented for microaneurysm detection from retinal images. Initially, we used pre-processing using morphological operations to enhance the dark and bright features of retinal images. Negative Pixel intensity rank ( ![]() -rank) transform is applied on pre-processed image to get smooth regions and sharp edges of dark and bright features. Then blood vessels and optic disc suppressed from transformed image so that they should not be considered as microaneurysm regions. Finally, histogram based thresholding is used to select true microaneurysms candidates. Figure 2 shows the methodology used for microaneurysm detection.
-rank) transform is applied on pre-processed image to get smooth regions and sharp edges of dark and bright features. Then blood vessels and optic disc suppressed from transformed image so that they should not be considered as microaneurysm regions. Finally, histogram based thresholding is used to select true microaneurysms candidates. Figure 2 shows the methodology used for microaneurysm detection.
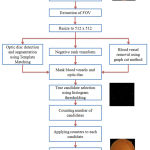 |
Figure 2: Proposed method for automated microaneurysms detection |
Database
DIARTDB
DIARETDB [17] database is freely available for research purpose. Images were captured with a 50 degree field-of-view (FOV) digital fundus camera. This database has two sets, first is: DIARTDB0 which consists of 130 color fundus images, out of this 20 are normal and 110 images have lesions of DR. These signs include hard exudates, soft exudates, microaneurysms, and Heamorrhages. The second set is DIARTDB1, consist of 89 fundus images out of which 84 contain stage 1 non-proliferative signs (MAs) of DR, and 5 are normal without DR.
E-OPTHA
The OPHDIAT Tele-medical network for DR screening established a colored image database for DR, called E-ophtha [18]. The database is made of retinal images with different types of lesions (exudates and microaneurysms) manually annotated by ophthalmology experts. It contains e-ophtha-MA (MicroAneurysms), and e-ophtha-EX (EXudates). The e-ophtha EX contains 47 images with exudates and 35 images with no lesion and e-ophtha-MA consist of 148 images with microaneurysms or small hemorrhages and 233 images with no lesion.
Preprocessing
Color fundus retinal images show some lighting variations, poor contrast and noise. To reduce these imperfections and generate images more suitable for extracting lesion features. Green channel of original fundus image is used for feature extraction. We have used CLAHE based histogram equalization on green channel. Then all images are scaled between [0, 1]. Next Laplacian of Gaussian filtering is applied which extract the gradient variations. Finally median filtering is applied on difference images between scaled image and Gaussian filtered image. This pre-processing helps to enhance retinal images and removes photographic artifacts and inconsistencies in illumination. Figure 3 show that after enhancement of retinal image hard exudates and micro-aneurysm are clearly visible can be segmented properly.
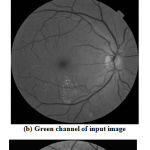 |
Figure 3: preprocessing of retinal image |
Microaneurysms detection
Rank Transform
Rank transform [2][3] encodes for each pixel the position of its grey value in the ranking of all grey values in its neighbourhood. Practically this rank is determined by counting the number of neighbours with a smaller grey value than the reference pixel. Microaneurysms are reddish, smaller and circular patches on retinal images. These patches are smooth in nature. Hence pixel intensity rank transform can effectively detect microaneurysm from retinal images.

Above equation show that only 4 neighbor pixels are selected for finding rank of pixel x considered.
Pixel Intensity Rank Transform ( ![]() rank)
rank)
The rank transform is very sensitive to noise presence in images hence low pass filtering is needed before evaluation of rank transform [2]. Let us consider the use of rank transform in noisy images. In noisy image, few pixels will contribute to the noise where as maximum pixels are smooth in given patch. If we select at least ![]() number of elements less than x in (m×n ) neighbourhood pixels image then its
number of elements less than x in (m×n ) neighbourhood pixels image then its ![]() – rank transform can written as
– rank transform can written as
![]()
By observing above statement we can say that if ![]() is more,then
is more,then
![]()
is less and when ![]() is less then
is less then
![]()
more. Here N(x) is the set of neighborhood pixels. If ![]() is selected to be negative then the response is opposite to that of
is selected to be negative then the response is opposite to that of ![]() positive. Rank transform negative
positive. Rank transform negative ![]() are given below
are given below
![]()
These two responses can be used to enhance abrupt regions like exudates and smooth regions like microaneusyms respectively.
Microaneurysms Detection
We have seen that negative ![]() – rank transform can be used to get smooth patches and edges in retinal images. Equation 5 can be rewritten for negative
– rank transform can be used to get smooth patches and edges in retinal images. Equation 5 can be rewritten for negative ![]() – rank transform for images as
– rank transform for images as
![]()
The rank transform
![]()
image provides all the smooth regions with sharp changes in retinal image. So it will respond to all microaneurysms region as well as blood vessels, edges of exudates and edges of optic disc. Blood vessels are detected using graph cut method [19] and optic disc are detected and segmented using [4] separately from original retinal image and subtracted from rank transform
![]()
image. Finally thresholding is used to select small dots or pixels as true micro aneurysms candidates. Based on variations in illumination in retinal images threshold value may change from database to database. Figure 4 shows micro aneurysms detection process and results for sample retinal image.
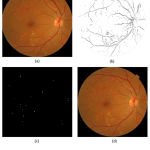 |
Figure 4: Microaneurysms detection in retinal image: step wise results |
Experimental Results
The proposed microaneurysms and exudates detection methods are tested and evaluated on retinal images of DIARETDB1 [102] and E-optha Ex and E-optha MA databases. Ground truth images are used to evaluate the performance of proposed methods. Image based evaluation are done to measure the accuracy of the proposed method.
Performance matrices
The performance metrics used for analyzing the proposed method are defined in terms of true positives (TP), true negatives (TN), false positives (FP), and false negatives (FN) as follows.
Sensitivity
It defines how well the algorithm detects true positives in given set of images as compared to true negative images in ground truth images set.

Specificity
It defines how well the algorithm detects true negatives in given set of images as compared to true negative images in ground truth image set.

Accuracy
It defines how well the algorithm separate images with lesion and images with without lesion in given set of images.

Results for Automated Detection of Microaneurysms
A total of 89 images from DIARETDB1 database used. Out 89, almost 84 images have at least mild grade severity microaneurysms and 5 images are normal. A total of 381 images are evaluated from E-optha MA database containing 148 images with microaneurysms whereas 233 images are free from any lesion. An image is considered to be true if it has a minimum of two microaneurysms are detected, otherwise the image is considered to be false.
Table 1 shows the image based results of the proposed method for automated detection of microaneurysms.
The proposed algorithm is able to achieve 98.79%, 83.33% and 97.75% of sensitivity, specificity and accuracy when evaluation is done on total 89 images DIARETDB1 dataset. In evaluation 82 images are found to be containing microaneurysms as compared to 84 as proposed by experts of dataset. The proposed method is also able to detect 5 images without any lesions.
We found that still one case missed from true positive as false negative and one case of true negative to false positive. These results are shown by comparing results with ground truth images given along with dataset.
Table 1: Results for automated detection of microaneurysms
| Database | DIARETDB1 | E-optha MA |
| TP | 82 | 140 |
| FP | 01 | 07 |
| FN | 01 | 08 |
| TN | 05 | 225 |
| Sensitivity % | 98.79 | 94.59 |
| Specificity % | 83.33 | 96.56 |
| Accuracy % | 97.75 | 95.80 |
Conclusion
In this paper, negative pixel intensity rank (![]() – rank) transform is proposed to detect microaneurysms in retinal images. Preprocessing is used to enhance the dark and bright features in image. Proposed transform gives the information of smooth regions and edges of bright and dark regions. Thresholding was used for selection of true microaneurysm candidates. It is observed that very high specificity achieved for presented method. Results show that proposed method can be used in diabetic retinopathy screening systems for finding lesions in retinal images. In some of the cases our results was very poor due bad illumination in input retinal image hence there is scope for improvement in future.
– rank) transform is proposed to detect microaneurysms in retinal images. Preprocessing is used to enhance the dark and bright features in image. Proposed transform gives the information of smooth regions and edges of bright and dark regions. Thresholding was used for selection of true microaneurysm candidates. It is observed that very high specificity achieved for presented method. Results show that proposed method can be used in diabetic retinopathy screening systems for finding lesions in retinal images. In some of the cases our results was very poor due bad illumination in input retinal image hence there is scope for improvement in future.
Acknowledgement
There is no acknowledgement
Funding Source
There is not funding source for this work
Conflict of Interest
There is no conflict of interest.
References
- Report by Indian Optometry Federation (IOF), “Delhi Declaration on Optometry and Blindness Prevention in India”, April 2010
CrossRef - Mukherjee, “Local rank transform: Properties and applications,” Pattern Recognition Letters, vol. 32, no. 7, pp. 1001 – 1008, 2011.
CrossRef - Oliver demetz, David Hafner, and Joachim Weickert, “The complete rank transform: A tool for accurate and morphologically invariant matching of structures”, British machine vision conference, Bristol, 2013
CrossRef - R. Wankhede, K. B. Khanchandani, “Optic Disc Detection using Histogram based Template Matching”, IEEE conference on Signal Processing, Communication, Power and Embedded System (SCOPES)-2016, Oct, 2016
CrossRef - Spencer, J. Olson, K.C. McHardy, P. Sharp, J. Forrester, An image-processing strategy for the segmentation and quantification of microaneurysms in fluorescein angiograms of the ocular fundus, Computers and Biomedical Research, 29 (4) (1996) pp 284–302.
CrossRef - J. Cree, J.A. Olson, K.C. McHardy, P.F. Sharp, J.V. Forrester, A fully automated comparative microaneurysm digital detection system, Eye 11 (1997) pp 622–628.
CrossRef - Hansgen, P. Undrill, M. Cree, The application of wavelets to retinal image compression and its effect on automatic microaneurysm analysis, Computer Methods Programs in Biomedicine 56 (1) (1998) pp 1–10.
CrossRef - Sinthanayothin, J.F. Boyce, T.H. Williamson, H.L. Cook, E. Mensah, S. Lal, D. Usher, Automated detection of diabetic retinopathy on digital fundus images, Diabet. Med. 19 (2) (2002) pp 105–112.
CrossRef - Usher, M. Dumskyj, M. Himaga, T.H. Williamson, S. Nussey, J. Boyce, Automated detection of diabetic retinopathy in digital retinal images: a tool for diabetic retinopathy screening, Diabetic Medicine 21 (1) (2004) pp 84–90.
CrossRef - Zhang, O. Chutatape, A SVM approach for detection of hemorrhages in background diabetic retinopathy, Proceedings. 2005 IEEE International Joint Conference on Neural Networks, 2005, vol. 4 (2005) pp 2435–2440.
- Niemeijer, B. van Ginneken, J. Staal, M.S.A. Suttorp-Schulten, M.D. Abramoff, Automatic detection of red lesions in digital color fundus photographs, IEEE Transactions on Medical Imaging 24 (5) (2005) pp 584–592.
CrossRef - U. Akram, S. Khalid, S.A. Khan, Identification and classification of microaneurysms for early detection of diabetic retinopathy, Pattern Recognition 46 (1) (2013) pp 107–116.
CrossRef - U. Akram, S. Khalid, A. Tariq, S.A. Khan, F. Azam, Detection and classification of retinal lesions for grading of diabetic retinopathy, Computer in Biology and Medicine 45 (2014) pp 161–171.
CrossRef - Quellec, M. Lamard, P.M. Josselin, G. Cazuguel, B. Cochener, C. Roux, Detection of lesions in retina photographs based on the wavelet transform, 2006 International Conference of the IEEE Engineering in Medicine and Biology Society (2006) pp 2618–2621.
CrossRef - Zhang, X. Wu, J. You, Q. Li, F. Karray, Hierarchical detection of red lesions in retinal images by multiscale correlation filtering, Proc. SPIE 7260 (2009) pp 7260- 7260-12.
CrossRef - Ding, W. Ma, An accurate approach for microaneurysm detection in digital fundus images, 2014 22nd International Conference on Pattern Recognition (2014) pp 1846–1851.
CrossRef - Kauppi, V. Kalesnykiene, J.-K. Kamarainen, L. Lensu, I. Sorri, A. Raninen, R. Voutilainen, H. Uusitalo, H. Kälviäinen, J. Pietilä, Diaretdb1 diabetic retinopathy database and evaluation protocol, Proceeding of Medical Image Understanding and Analysis (MIUA), vol. 2007 pp (2007).
CrossRef - Decencière E, et al. “TeleOphta: Machine learning and image processing methods for tele-ophthalmology”. IRBM, 2013
CrossRef - R. Wankhede, K. B. Khanchandani, “Retinal Blood Vessel Segmentation using Graph Cut Analysis”, IEEE Int. Conf. of Instrumentation and Control, COEP, Pune, May 2015
CrossRef

