
Manuscript accepted on :25-03-2020
Published online on: 30-03-2020
Plagiarism Check: Yes
Reviewed by: Yasemin Saygideger
Second Review by: John Osaigbovoh Imaralu
Anuja Kumar Acharya*and Rajalakshmi Satapathy
School of Computer Engineering, KIIT University, India
Corresponding Author E-mail : anujafcs@kiit.ac.in
DOI : https://dx.doi.org/10.13005/bpj/1905
Abstract
In the research work, we propose an automatic detection of pneumonia from chest radiography image using the deep Siamese based neural network. Although in the recent past many method were devoted but these methods are either solely depends on the transfer learning approach or the traditional handcrafted techniques towards classifying the pneumonia disease. Viral and bacterial pneumonia infections are distinguished by analyzing the amount of white substance that is spread across the two segment of the chest X ray image. Deep Siamese network use the symmetric structure of the two input image to compute or classify the problem. Each of the chest X-ray image is divided into two segment and then feed it to the network to compare the symmetric structure along with the amount of the infection that is spread across these two region. We use the Kaggle dataset, to train and validate our model towards the automatic detection of the different kind’s pneumonia disease. This proposed model could help the medical practioner towards easily identifying the pneumonia problem from the X-ray imagery. Simulation results The model outperforms the state-of-the-art in all performance metrics and demonstrates reduced bias and improved generalization.
Keywords
Clinical Decision; Chest X-rays(CXR); Computer-Aided Diagnosis; Convolution Neural Networks(CNN); Deep Siamese Network(DSN); Pneumonia; Segmentation
Download this article as:| Copy the following to cite this article: Acharya A. K, Satapathy R. A Deep Learning Based Approach towards the Automatic Diagnosis of Pneumonia from Chest Radio-Graphs. Biomed Pharmacol J 2020;13(1). |
| Copy the following to cite this URL: Acharya A. K, Satapathy R. A Deep Learning Based Approach towards the Automatic Diagnosis of Pneumonia from Chest Radio-Graphs. Biomed Pharmacol J 2020;13(1). Available from: https://bit.ly/2vYHz8V |
Introduction
Pneumonia is a one of the common acute respiratory lung disease. Children under the age of 5 years easily get infected with this disease. The WHO estimate that around 1.4 millions of children lost their life due to the failure of detecting this lung disease at its early stage[1]. Viral pneumonia and the bacterial pneumonia are the two major type that can cause severe damages to the human respiratory system Different types of clinical management is required for the cure of these infection. Antibiotics are used to recover the bacterial infected pneumonia while viral infected patient need the different medication and supportive care for recovery of the diseases. Chest X-ray (CXR) analysis is the chosen as one of the most preferably for the medical practitioner for diagnosing the pneumonia disease [2]. Accurately identifying and categorizing the pneumonia subtypes is an important and challenging clinical task, and automated methods can be used to save time and reduce error. Deep learning techniques can be used to recognize and identify the type of pneumonia infection in the patient and proper clinical treatment can be provided towards making the patient cure from this kind of respiratory infection. Deep Siamese based CNN method can be associated with the radiographic examination towards detecting the particular type of pneumonia [12].
Despite of several advantages of X-ray imaging, still in some cases it is not possible to identify the correct region of interest in the radiographic image for detecting the diseases. It is also observed that as the diagnostic accuracy of automated method reach the human level. This makes researchers to develop automated methods for detection of diseases through radiography imagery. Automated detection method provides an add on support to the clinical experts towards a ease of diagnosing the disease. For all the aforementioned reasons, we have developed a robust CNN based method to identify the different types of pneumonia diseases identification with X-ray imaging.
Convolutional neural networks (CNNs) belong to a class of Deep Learning models that are highly used in the field of computer vision [3]. These models have multiple processing layers to learn hierarchical feature representations from the input pixel data. It helps in learning the model for extracting the features and then infers or construct the object for classifying the task. Commonly used CNN architecture are SegNet [5], CardiacNet [6] and U-Net [9]. These architecture are profoundly used in the classification task of medical imagining data. All these model having large number of decision parameter which can be used by the developers towards resolving the real time problem. In the current research work, we proposed a deep Siamese based method towards predicting the CNN model in classifying the chest X ray to detect the different types of pneumonia infection. DSN basically use the symmetric structure of image that learn useful data descriptor to compare the inputs of the respective sub networks. Each CXR image is segmented into two region that is left and right segment and then pass through each of the sub network of DSN for predicting the amount of white substance that spread across these region. Correct identification of the region and the amount of the thickness of the substance on the ROI is the main criteria of visualizing the class type of pneumonia.
Related Work
With the recent development of deep learning CNN model, many work has been carried out in the field of medical imaging such as skin diseases classification, Automated knee arthritis detection, diabetic retinopathy detection[14], Automated diagnoses of Chest disease with radiography, arrhythmia detection [13] etc. One of the common threat to human health is the pulmonary problem. Diseases like tuberculosis, pneumonia and lung cancer if not detected in the earlier stage then it may create a major threat to human health. Reviewing all the medical imaging problem with deep learning methodology is out of scope of this paper. However, We have briefly discuss some of the important methodology detecting the pneumonia disease with chest radiography[7-10]. Khobragade et al.[11], proposes artificial neural netwok based classification method that use lung segmentation to detect various lung related disease. Lakhani et al[1], proposes the classification of pulmonary tuberculosis diseases using CNN model with x-ray imaging. S.Rajaraman et al. [12] developed a CNN based segmentation method towards classifying the different kinds of pneumonia diseases in pediatric patient.
CNN has been choosen as the one of the best technique towards detecting diseases such as brain cancer, colorectal cancer etc. Lisowska et al.[4] contributed, a 3D based CNN model for the detection of brain stoke. This model uses the contralateral feature and atlas information for the classification of a stroke. Ponzio et al[10] developed a deep learning technique based on Convolutional Neural Networks to differentiate adenocarcinomas from healthy tissues and benign lesions.
Wang et al[13] developed a Chest-Xray8 database with text-mined eight disease image labels from radiological reports using natural language processing. Kerman etal[14] uses the CNN model for classifying the different kinds of pneumonia infection for the pediatrics patient. Their approach based on V3 inception model that extract the fixed features and use area under curve(AUC) as the measuring tool to classify the viral and bacterial pneumonia. Santosh et al13] has proposed method to detect the pulmonary abnormalities using the comparison of symmetric structure of the lung region from the chest X-ray. Rajaraman et al[8] also use the simple VGG16 model for the pneumonia detection from the pediatric chest x-ray image. The main objective of this paper is to build a model based on convolution neural network in order to recognize the pneumonia from the X-ray image and then classify to its particular type.
Materials and Methods
Description of the Dataset
We have used the Kaggle dataset for the training and testing the diseases. This dataset contains 5,528 number of X-ray image. In the preprocessing stage, poor quality X-ray image were found and those images are preprocessed and trained in order to classify it correctly. Furthermore each X-ray image is divided into two segments that is right and left region. In the proposed work our main intention is to identify pneumonia and then classify into its particular type that is either viral pneumonia or the bacterial pneumonia. Figure 1 shows a case study of bacterial and viral pneumonia X-ray image. In the radiography image, bacterial pneumonia, the alveoli become filled with secretion of the white inflammatory fluid while in the viral pneumonia, left most part of the chest is infected with the white spot. From the state of the art, it is found that AUC parameter can be used to classify the pneumonia type on the basis of the amount of white fluid infected the chest. In the proposed work, the dataset is organized into 3 folders mainly training, testing and validation and contains sub-folders for each image category. We trained all our models for identifying the pneumonia as well as the type of pneumonia infection. As shown in the Figure 2, in the training phase, each of the sample image is first segmented into left and right segment and then the segmented image is normalized to process it for classification. To tune the classification parameter and to reduce the over fitting problem, training model is feed to the validation process. Network validation is used and further more to validate the model, cross-validation of k-fold is used, which consists of dividing the images into two sets i,e testing and training. The method is repeated for 5 times, changing the test and training images after the calculation of k.
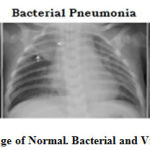 |
Figure 1: X-ray image of Normal. Bacterial and Viral pneumonia patient |
Network Architecture
We have used Deep Siamese CNN architecture for our proposed classification problem. The original application of this architecture was to learn a similarity metric between pairs of images. Left segmented region of the CXR image is flipped vertically, required for the semantic analysis of the two portion of the chest region. Usually, the whole network consists of two branches, where each one corresponds to each input image. Our model consists of two step. In the first step we have identified two region of the image and train the model to compare with the normal X-ray image. Followed to this in the 2nd step, we compare the Symantec visibility region of left and right segmented region of the chest X-ray image. This comparison revels the amount of thickness and spreading of the white substance which leads to the identification of the particular type of pneumonia infection.
As shown in the Figure 2, left and right segment of the image is separated and then passes through the network. Left patch of the segregated image is flipped horizontally, These segmented image patch are then input to the two network branches, which contains different blocks employed for different layer of CNN such as convolution layer, pooling Relu layer and soft max layer. each branch again pass through the five convolutional layer and one fully connected layer. Convolution (Conv), rectified linear unit (ReLU) layers and the batch normalization (BN) is represented with the blue block . Grey coloured circles represent the max-pooling 2 × 2. Light-red blocks consist of Conv-BN-ReLU layers followed by the global average pooling. The output of two network branch is concatenated and then fed to the softmax layer and this layer is used to find out the prediction rate for classifying the pneumonia type. Details of each layer of convolution neural network are explained below.
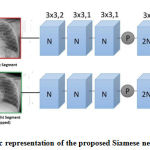 |
Figure 2: Schematic representation of the proposed Siamese network’s architecture. |
Convolution Operation Layer
The first step of the CNN is the convolution layer where each input is undergoes a learning process. This layer mainly consists of series filter known as the kernels. Kernal generally expressed as rectangular matrix, consisting of set of values known as the weights. These weights are learned from the input data[16] and are calculated automatically by an error back propagation algorithm [17a]. As shown in the Figure 3, each filter is convolved with the input data and their by producing the feature map.
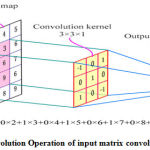 |
Figure 3: Convolution Operation of input matrix convoluted on Kernel |
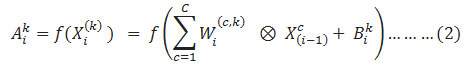
Each term of the feature map of the convolution layer can be described as
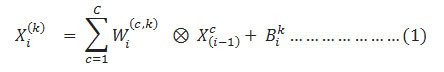
Here, ⊗ represents the convolutional operator,
![]()
represent the weight of the kernel in the ith layer.
![]()
is the input feature map of channel c and
![]()
is the bias of the kth group filter in the ith layer. If C = 3, it represents the input feature map, a 3-channel array such as a color picture with three Red-Green-Blue channels. We used a stack of 3 × 3 convolutional filters instead of the larger ones. In order to keep the input size constant and to build a deep network, zero padding is not used for 3X3 filter in the proposed work.
Activation (ReLu) Layer
Followed to the convolution layer is the Relu layer. In this layer a non linear activation function is applied on the output of the convolution layer. Relu activation also helpful in preventing the gradient disappearance problem and the over-fitting problem which are usually arises in the deep neural network. Equation (1) can be rewritten as follows after adding the activation function:
where ƒ(.) is the activation function and
![]()
is the kth output feature map after a nonlinear transformation by the activation layer.
Pooling Layer
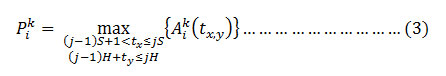
The pooling layer is used for down-sampling or reducing the dimensionality of the feature map. Two types of methods used in the pooling that is either max pooling or the average pooling. Mathematically, pooling can be expressed as [18]
where
![]()
describes value of tx,yth pixel value present in the in the ith layer and the size of the pooling window considered as S×H. In the proposed method we have considered the max pooling technique with convolution stride of 2 in the first layer.
Fully Connection Layer
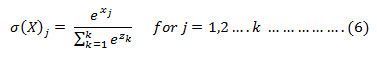
Last stage of the CNN is the Fully connection layer, this layer is used as the final learning phase. Normally this layer is used extract the features of the output data of CNN and also to connect the feature extraction stages with the Softmax classifier. A fully connected CNN is normally consists of 2 to 3 layers and connected to a feed forward neural network. The final output of the fully connected layer is transformed from 2-D array to 1-D array. Each element of this 1-D array is the parameter for the determination of class type of an input image. Mathematically, FCN layer can be written as
![]()
where W,X,B denotes the weight, input and the bias of the fully connected network layers respectively. The softmax activation function[20] is very much use full for the probabilistic distribution of the input image belong to each of the classes in which the network was trained. Probability distribution of the input image x is measured as
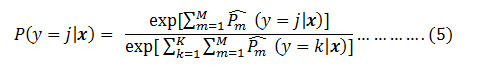
Where M is the no of models or the branches and here it is 2, k is the number of class level that is 3 and
![]()
is the probability distribution.
In order to minimize the training time and to restrict the over fitting problem, we have used dropout training skill with the fully connected layer, i.e in each iteration, a certain percentage of neuron of a layer from the training set id added and then using the ADAM optimization function[15],weights of the each neuron are updated.
As mentioned above, we learned the same convolution and batch normalization weights for both sides of the chest image. Finally, we concatenated the outputs of these two branches and used a final fully connected layer to make the prediction for classification.
Implementation Details
We have used PyTorch, python based computing package that support the GPU environment. Entire experimental work is implemented in Nvidia GTX1080 cards system with 8 GB memory support system. For our model, first we rescaled the input image of 130X130 mm region into a image of 300 X 300 pixel. This image is then cropped into two rectangular segments. Left segmented image of the CXR is flipped vertically. As cited earlier, Siamase network act on two different input at a time to compute the output. As shown in the figure3, the two segmented image of each CXR is feed into the model and then undergoes the following series of operation for training the model such as convolution layer, batch normalization, ReLu layer, max pooling and then finally the fully connected layer with soft max dense operation. Furthermore in order to reduce the dimension of extracted feature, Adam Optimizer and the cross entropy loss function are used. To avoid over fitting, we include a drop out layer with a drop out ratio of 0.2 after the last convolutional layer and a drop out layer with a drop out ratio of 0.5 after the fully connected layer (fc5).
Performance Evaluation
Cross Validation
One of the measuring parameter for the evaluation of the performance is the cross validation. One of the popular validation methods is the k-fold validation in which the selected sample from the dataset is divided equally into k number of groups. Treat the 1st group as the validation set and the remaining (k-1) as the training data. Although this method of measuring the performance is quite complex but still it is one of the better approach as it takes the full advantage of analyzing the entire data.
Confusion Matrix
Confusion Matrix is used towards measuring the prediction correctness. Prediction correctness of the algorithm is expressed in this 2D array. Here we consider the multi class classification problem. Three classes generally identified as normal or bacterial infected or the viral infected pneumonia patient.
| T r u e L a b e l |
Viral Pneumonia | 86.0 | 14.0 | 0.0 |
| Bacterial Pneumonia | 7.0 | 89.0 | 4.0 | |
| Normal | 2.0 | 4.0 | 94.0 | |
| Viral Pneumonia | Bacterial Pneumonia | Normal | ||
| Predicted Label | ||||
In the above table, we have used two sections which contain the true or the actual classification against the predicted classification section.
AUC -ROC Curve
Towards checking or visualizing the performance of the multi – class problem, we use AUC (Area Under The Curve) curve and ROC (Receiver Operating Characteristics) curve. Current work is a multiclass problem and the AUC and ROC parameter plays a measure role. ROC curve is conceptually equivalent to a curve that shows the relationship between the power of the test and the probability of error, with the variation of the cutoff value of a statistical test. Therefore, the ROC curve compares classifier performance across the full range of class distributions, offering an assessment, covering a wide range of operating conditions [19]. Figure 4 shows the performance of the ROC-curve along with the AUC value for the two case i.e normal vs pneumonia and viral vs bacterial pneumonia.
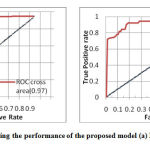 |
Figure 4: ROC curve representing the performance |
Conclusions
In this paper we have demonstrated a novel approach to identify and classify the various types pneumonia disease. We have used the kaggle dataset and specific features are used relevant to the diseases. Compared to the earlier approaches ,we have trained our model for both the right and left part of chest X-ray that makes the process robust towards better classification. Overall our approach has provide the add on benefits to inexperienced practitioner in towards diagnosing the specific type of pneumonia in the early stage.
Acknowledgements
The author is very thankful to all the associated personnel in any reference that contributed in/for the purpose of this research.
Funding source
There is no funding source for the current research work.
Conflict of Interest
There is no conflict of interest.
Reference
- Lakhani and B. Sundaram, “Deep learning at chest radiography: automated classification of pulmonary tuberculosis by using convolutional neural networks,” Radiology, vol. 284, no. 2, pp. 574–582, 2017.
- D. Demner, M. D. Kohli, M. B. Rosenman et al., “Preparing a collection of radiology examinations for distribution and retrieval,” Journal of the American Medical Informatics Association, vol. 23, no. 2, pp. 304–310, 2015.
- S, Rajaraman, S. Candemir, Kim, G. Thoma, and S. Antani, “Visualization and interpretation of convolutional neural network predictions in detecting pneumonia in pediatric chest radiographs.”Applied Sciences, 8(10).
- Lisowska, E. Beveridge, K. Muir, and I. Poole, “Thrombus detection in ct brain scans using a convolutional neural network.”, In BIOIMAGING, 2017 pages 24–33.
- Abe, H.Macmahon, J. Shiraishi, Q. Li, “Engelmann, R.; Doi, K. Computer-aided diagnosis in chest radiology.” Semin. Ultrasound CT MR 2004, 25, 432–437.
- [6]M. Giger, H.MacMahon, “Image-processing & computer-aided diagnosis.” Radiologic Clinics of North America. 1996, 34, 565–596.
- Monnier-Cholley, H. MacMahon, S. Katsuragawa, J. Morishita, T.Ishida, K. Doi, “Computer-aided diagnosis for detection of interstitial opacities on chest radiographs.” AJR Am. J. Roentgenol. 1998, 171, 1651–1656.
- S. Kermany, M.Goldbaum, W. Cai, C.C,S Valentim, H. Liang, S.L Baxter, A.McKeown, G. Yang, X. Wu, F. Yan, et al. “Identifying Medical Diagnoses and Treatable Diseases by Image-Based Deep Learning.” Cell 2018, 172, 1122–1131.
- L.G Oliveira, S.A.E Silva, L.H.V Ribeiro, R.M De Oliveira, C.J. Coelho, A.L.S Ana Lúcia, “Computer-Aided Diagnosis in Chest Radiography for Detection of Childhood Pneumonia.” International Journal of Medicine and Information 2008, 77, 555–564.
- Ponzio, E. Macii, E. Ficarra, and S.Di Cataldo, “Colorectal cancer classification using deep convolutional networks”, In Proceedings of the 11th International Joint Conference on Biomedical Engineering Systems and Technologies , Volume 2 BIOIMAGING, 58-66, 2018, Funchal, Madeira, Portugal
- M Le Roux, L. Myer, M.P Nicol, “Incidence and severity of childhood pneumonia in the first year of life in a South African birth cohort”, The Drakenstein Child Health Study. Lancet Glob. Health 2015, 3, e95–e103.
- Cherian, E.K Mulholland, J.B Carlin, H. Ostensen, R. Amin, M. De Campo, D. Greenberg, R. Lagos, “Lucero, M.; Madhi, S.A.; et al. Standardized interpretation of paediatric chest radiographs for the diagnosis of pneumonia in epidemiological studies”, Bull. World Health Organ. 2005, 83, 353–359.
- C Santosh, S. Antani, “Automated chest x-ray screening: Can lung region symmetry help detect pulmonary abnormalities”, IEEE Transactions on Medical Imaging, 2018, 37(5):1168–1177.
- [14]A. Krizhevsky, Sutskever, G.E Hinton, “Imagenet classification with deep convolutional neural networks” , In Proceedings of the Advances in Neural Information Processing Systems (NIPS), Lake Tahoe, NV, USA, 3–6 December 2012; pp. 1097–1105.
- P. Kingma, J. Ba, A. Adam: A method for stochastic optimization. CoRR, abs/1412.6980, 2014.
- Goodfellow, Y. Bengio, A. Courville, Deep Learning, MIT Press: Cambridge, MA, USA, 2016
- Xia, T. Li,L. Xu, L. Liu, C.W de Silva, “Fault-diagnosis for rotating machinery using multiple sensors and convolution neural networks”. IEEE/ASME Trans. Mech. 2018, 23, 101–110.
- [18] W. Zhang, G. Peng, C. Li, “Bearings fault diagnosis based on convolutional neural networks with 2-D representation of vibration signals as input”, In Proceedings of the 2016 the 3rd International Conference on Mechatronics and Mechanical Engineering (ICMME 2016), Shanghai, China, 21–23 October 2016; pp. 1–5.
- Brzezinski, J. Stefanowski, “ Prequential auc: properties of the area under the roc curve for data streams with concept drift”, Knowledge and Information Systems, 52(2):531–562.
- Peng, J. Li, Y. Song, Y. Liu, “ Incrementally learning the hierarchical soft max function for neural language models”, In AAAI, 2017,pages 3267–3273.

