
Manuscript accepted on :21- 10-1919
Published online on: 05-12-2019
Plagiarism Check: Yes
Reviewed by: Wenyi Li
Second Review by: Abrar Thabit
Final Approval by: Prof. em. Hans-Joachim Freisleben
Md. Aknur Rahman1 , Sauda Sumaya Dina2, Md. Monirul Islam3, Jakir Ahmed Chowdhury4, Shaila Kabir1, Abu Asad Choudhury1 and Md. Shah Amran1*
1Department of Pharmaceutical Chemistry, Faculty of Pharmacy, University of Dhaka, Shahbag, Dhaka-1000, Bangladesh
2Department of Pharmacy, Faculty of Pharmacy, University of Dhaka, Shahbag, Dhaka-1000, Bangladesh
3Department of Clinical Pharmacy and Pharmacology, Faculty of Pharmacy, University of Dhaka, Shahbag, Dhaka-1000, Bangladesh
4Department of Pharmaceutical Technology, Faculty of Pharmacy, University of Dhaka, Shahbag, Dhaka-1000, Bangladesh
Corresponding Author E-mail: amranms@du.ac.bd
DOI : https://dx.doi.org/10.13005/bpj/1812
Abstract
The increased prices and low availability of medicines are main obstacles to health care system in developing countries like Bangladesh. The main goal of this work is to gather and assessing the data on availability, affordability and price variations of essential antibiotics in Bangladesh. The data will help to improve the availability and affordability of essential antibiotics for the mass peoples. The present work was done using standard methodology described in guideline, “Price measurement, availability and affordability and price components of medicines. A total of eighteen essential antibiotics were surveyed and their prices and availability were determined. Prices from 2003 to 2019 were collected from different sources to make a comparative study of the price variations over the years. The overall prices of essential antibiotics are not much higher than international reference prices. The rate of increase of price from previous years is not so alarming. The numbers of manufacturing companies were collected from the Bangladesh National Formulary (BDNF) of different Volumes to compare the increasing number of manufacturers. Essential antibiotics affordability was determined by comparing the total cost of treatment of a particular disease to the monthly salary of the lowest paid unskilled laborer. There are several essential antibiotics for which the numbers of manufacturing companies are increasing in very high rate. This type of survey may be expanded to the national level for the data of different regions of Bangladesh.
Keywords
Affordability, Availability, Essential Antibiotics, Median Price Ratio, Median Price and Price variations.
Download this article as:| Copy the following to cite this article: Rahman M. A, Dina S. S, Islam M. M, Chowdhury J. A, Kabir S, Choudhury A. A, Amran M. S. The Study of Availability, Affordability and Price Variation of Essential Antibiotics in Bangladesh. Biomed Pharmacol J 2019;12(4). |
| Copy the following to cite this URL: Rahman M. A, Dina S. S, Islam M. M, Chowdhury J. A, Kabir S, Choudhury A. A, Amran M. S. The Study of Availability, Affordability and Price Variation of Essential Antibiotics in Bangladesh. Biomed Pharmacol J 2019;12(4). Available from: https://bit.ly/2OPfkjM |
Introduction
The insufficiency of access to essential antibiotics remains a great public health problem all over the world. World Health Organization (WHO) defines the essential medicines as “those medicines which meet the global health needs of the majority of the population of a particular territory”. The WHO updates its Model Essential Medicines List every 2 years in a transparent way. Although access to essential medicines has improved since the introduction of the essential medicines concept in 1977, one-third of the world’s population is still not treated with the required medicines that are needed for their treatment. In low- and middle-income countries (LMICs), as many as ninety percent of the population pay out-of-pocket for their drugs. The USA has also made a shift to high-deductible insurance strategy during within the last decades1.
In 2001, a resolution (WHA 54.11) endorsed by the Member States of the World Health Assembly called for a standardized procedure to monitor medicines prices to help boost the access. In response, the World Health Organization/Health Action International (WHO/HAI) Project on Medicine Prices and Availability was established. The primary purpose of this project was to develop a standardized method to calculate medicines’ prices, availability, affordability and price components in a reproducible method so as to allow international comparisons against the time. In 2003, after testing in 9 countries, the standard WHO/HAI methodology was released, with a second edition published in 2008 2.
Poor medicine availability, increased prices and low affordability are major obstacles to medicine access for common people in developing countries of the world. In many developed countries, for example, the USA, there are growing concerns about decreased medicine access for reasons including high medicine prices and co-payments/deductibles, uninsured populations, inadequate transparency in medicine price components, and health agencies’ low capability to bargain procurement prices 1.
For the evaluation of the studied medicines’ consumer prices, WHO/HAI methodology uses international reference prices (IRPs) as an external standard. To evaluate prices, a median price ratio (MPR) is measured by comparing the median consumer price of a supplied medicine with the particular IRP. International reference prices used in this work were taken from the 2015 Management Sciences for Health (MSH) International Drug Price Indicator Guide.
The MSH reference prices were published in 1986 for the first time. The MSH reference prices are procurement prices obtained from both sellers and purchasers and collected from government agencies, pharmaceutical suppliers and international development organizations. The MSH prices are widely accepted as proper reference standards 3. These MSH procurement prices report the real prices obtained by non-profit suppliers and government tenders, the robust nature of this data ensures international comparability 4.
Government of any country should procure medicines from the reliable sources as compared to the IRPs patient prices from the private sector to reduce the excessive cost of the medicines occurring from the additional costs in markups, tariffs, taxes and other costs. Because of these additional costs, the WHO has set a target of 4 times the IRP for patient prices in the private sectors. Medicine availability and prices are recognized as an important components of access to medicines by WHO, For this reason the WHO five years strategic plan 2008-2013 defines the global and national targets for generic essential medicines, targeting 80% availability in all sectors and median consumer prices to be no more than four times the IRP. In studied works, the Median price ratios of studied medicines in Bangladesh varied from 0.36-2.56 and 0.33-2.36 in year 2015 and 2019, respectively.
Medicines included in this survey are used all over the world. The medicines are used to treat common conditions and appear on most treatment guidelines. Many of the surveyed medicines were studied in the 2009 study of medicine availability and prices in 36 developing and middle-income countries 3.
In our work, we examined the availability of essential antibiotics across Model pharmacies and general retail stores. Prices were obtained from BDNF-2, BDNF-3, BDNF-4 and DGDA website of year 2003, 2006, 2015 and 2019, respectively, and essential antibiotics prices of 2015 according to BDNF 4 and 2019 according to DGDA website were then compared with the MSH IRPs. The current survey was performed using standard methodology stated in guideline Price measurement, availability and affordability and price components of medicines 2.
The WHO/HAI Project on Medicine Prices and Availability was founded in 2001 – (i) to develop a effective methodology for accumulating and analyzing medicine price, availability, affordability and medicine price component data in different health-care sectors and regions in a country; (ii) to publish survey data on open access website to enhance price transparency; and (iii) to recommend for proper national policies and monitor their consequences.
The specific objectives of our study were – (i) to measure prices of Essential antibiotics for treating prevalent conditions in Bangladesh, (ii) to assess the affordability of standard treatment regimens utilizing these medicines, (iii) to compare the prices of drugs found in the country with international reference prices and (iv) to compare the prices of essential antibiotics of different years with statistical significance testing.
National drug policy 2016
Bangladesh Government has approved 3rd national drug policy of the country in its Cabinet Meeting that was held on 19 December 2016. To propose a draft of this policy, a drug policy formulation committee and sub-committee were constituted in 20115. The sub-committee has analyzed meticulously the problems and prospects of the country’s pharmaceutical sector, discussed with many professional experts and leaders of this sector, gathered opinion from all stakeholders and incorporated important suggestions from the public. Thus this drug policy has turned to be both pro-industry and pro-people.
Essential drug list (EDL)
To protect public health effectively and to deal with emergency need of the majority of the people, separate EDL for Allopathic, Ayurvedic, Unani and Homeopathic-Biochemic systems of medicines have been prepared. The quantity of drugs in the Essential Drug List (Allopathic) is 285 (versus 150 in the drug policy of 1982 with 56 in the Supplementary List), the number of medicines in the Essential Drug List (Ayurvedic) is 100, the quantity of drugs in the Essential Drug List (Unani) is 223 and the quantity of drugs in the Essential Drug List (Homeopathic) is 370.
All the drugs included in this list must be available throughout the country so that people even from remote corners can get an easy access to these drugs. After every 2 years, all these lists will be updated from time to time. Regular updating and inclusion of more drugs in this list will help us to get patent waiver of drugs on public health issue beyond 2033.
Regulatory system
The Directorate General of Drug Administration (DGDA), Ministry of Health and Family Welfare, is the National Regulatory Authority for drugs in Bangladesh. The DGDA oversees and implements all Drug laws in the country and guides all activities related to import, purchase of raw and packaging materials, manufacture and import of finished drugs, export, sales and price fixation, etc. Currently there are 28,734 brands of medicine products and a total of 269 drug manufacturing companies 6.
Methodology
With the help of the WHO/HAI methodology, we analyzed the availability, affordability and prices of 18 essential antibiotics. Availability of 18 essential medicines was obtained from 25 private pharmacies (Model pharmacies and general medicine stores). The medicine shops were located in different regions of the Dhaka Metropolitan City.
The prices of 18 essential medicines were also examined. The prices of drug were compared with international reference prices (IRPs). A comparative study on variation of prices across years was also done. A comparative statistical analysis among prices of different years was done by using SPSS statistic software. The local unit prices were collected from Bangladesh National Formulary which is the directory for all drugs produced locally and marketed in Bangladesh 7. International reference prices were utilized to compare national prices with the international standard.
The WHO/HAI methodology also evaluates the affordability of medicines, expressed as the number of day’s salary needed by the lowest paid unskilled government laborer to buy a full-course of treatment. To estimate what drug prices mean in terms of affordability for mass people, some normal treatment costs were measured and compared with the salary of the lowest-paid unskilled laborer, which was 8000 Bangladeshi Taka per month8. All prices were converted to United States Dollar (USD) using the exchange rate on 30.06.2015 ($1 USD = 77.83 Bangladeshi Taka)9. The international prices of 2015 were used as reference unit prices.
Survey medicines
A total of 18 essential antibiotics were selected from the Essential drug list of Allopathic drugs published by Directorate General of Drug Administration. All essential antibiotics were dose and dosage-form specific. The surveyed essential antibiotics were shown in Table 1. All surveyed essential antibiotics are generally used and have an available IRP.
Table 1: List of essential antibiotics surveyed.
| SL
No. |
Beta Lactam antibiotics | Dosage form taken to check Availability | Dosage form taken to check Affordability and price |
| 1 | Amoxicillin | Capsule/Dry Syrup /Injection | Capsule 250mg |
| 2 | Ampicillin | Capsule/Dry Syrup /Injection | Capsule 250mg |
| 3 | Phenoxymethyl Penicillin | Tablet/Syrup | Tablet 250mg |
| 4 | Benzathine Penicillin | Injection | Injection 12 lac unit/vial |
| 5 | Flucloxacillin | Capsule/Syrup/Injection | Capsule 250mg |
| 6 | Procaine Penicillin | Injection | Injection 4 lac unit/vial |
| 7 | Cephradine | Capsule/Syrup/Injection | Capsule 250mg |
| 8 | Cephalexin | Capsule/Tablet/Syrup | Cap 250mg |
| 9 | Benzyl Penicillin | Injection | Injection 5 lac unit/vial |
| 10 | Cloxacillin | Capsule/Syrup/Injection | Capsule 500mg |
| 11 | Amoxiclav (Amoxicillin + Clavulanic acid) | Tablet/Capsules/Dry Syrup/Injection | Tablet (250mg + 125mg) |
| Other antibacterials | |||
| 12 | Erythromycin | Tablet/Oral Suspension /Injection | Tablet 250mg |
| 13 | Chloramphenicol | Cap/Eye/Ear Drops/Ointment | Capsule 250mg |
| 14 | Doxycycline | Capsule | Capsule 100mg |
| 15 | Co-Trimoxazole (Trimethoprim + Sulfamethoxazole) | Tablet/Suspension | Tablet (800mg + 160mg) |
| 16 | Metronidazole | Tablet/Oral Liquid/Injection | Tablet 400mg |
| 17 | Tetracycline HCl | Capsule/Injection | Capsule 250mg |
| 18 | Nalidixic Acid | Tablet/Syrup | Tablet 500mg |
Price component
Prices were obtained from BDNF-2, BDNF-3, BDNF-4 and DGDA of year 2003, 2006, 2015 and 2019, respectively. Essential antibiotics prices of 2015 according to BDNF 4 were then compared with the MSH 2015 IRPs. The drug prices were compared with international reference prices (IRPs). A comparative study on prices variation across years was also done. To ease international comparisons, medicine-specific median price ratios (MPR) were estimated when prices were available from at least four facilities. The MPR refers to the ratio of a medicine’s local median unit price as compared to the 2015 MSH international median unit reference price.
Availability of essential antibiotics
The availability of essential antibiotics was expressed in two ways. One was the national availability of medicines which was calculated by counting the number of manufacturer in the country. The manufacturer numbers were collected from Bangladesh National Formulary7, 10, 11, 12. Medicine availability was collected for different years as in 2001, 2003, 2006, 2015 and 2019. The data for the year of 2019 were collected from DGDA website.
Our study investigated the availability of essential antibiotics across Model pharmacies and general retail stores. The availability of medicine in retail medicine shops was expressed as percentage to the number of sites on day of data collection. Only those medicines were considered available which were present at the time of data collection. Availability of 18 essential medicines were obtained from 25 private pharmacies (Model pharmacies and general medicine stores) and a comparison of mean percentage availability between 10 Model pharmacies and 15 General medicine stores were also studied using WHO/HAI methodology.
Affordability of essential antibiotics
The affordability of medicine was estimated as the number of days’ wages that the lowest paid unskilled laborer would have to give for a standard treatment. As the government hospitals provide essential antibiotics to the patients free of cost, only the private sector medicine price was considered. The most common disease conditions were taken as standard for treatment approaches.
Results and Discussion
The data for each medicine were collected from different sites and national formularies. Then the data were utilized in the program of MS Excel Workbook, given by the WHO/HAI. To avoid errors, data were checked and re-entered into the program. For a comparative study, prices of medicines of different years were collected. The drug unit price collected from the facility survey were entered into the MS Excel-based Workbook, followed by automated and manual error-checking, and built-in automated analysis feature of the workbook. A comparative statistical analysis among prices of different years was done by using SPSS statistical software.
Price of medicines
The prices of selected medicines (Shown in Table 1) of different years (2003, 2006, 2015 and 2019) were collected and listed (Shown in Table 2).The medicine unit prices gathered from the facility survey were placed into the MS Excel-based Workbook. A comparative statistical analysis among prices of different years was done by using SPSS statistical software (Shown in Table 3). There are some medicines of which prices changed dramatically. Sometimes prices increased and sometime remained almost the same.
Table 2: Median unit price of medicines in different years.
| Medicines | Strength | Dosage form | Price in
2003 |
Price in
2006 |
Price in
2015 |
Price in
2019 |
|||
| Amoxicillin | 250mg | Capsule | 3.29 | 3.02 | 3.54 | 3.51 | |||
| Ampicillin | 250mg | Capsule | 2.51 | 2.5 | 3.25 | 3.25 | |||
| Benzathine Penicillin | 12 lac units/vial | Injection | 23.56 | 23.12 | 24.98 | 24.21 | |||
| Flucloxacillin | 250mg | Capsule | 5.5 | 5.5 | 5.52 | 5.52 | |||
| Procaine Penicillin | 4 lac units/vial | Injection | 6.81 | 7.6 | 14.05 | 10 | |||
| Cephradine | 250mg | Capsule | 6.5 | 6.5 | 6.525 | 6.65 | |||
| Cephalexin | 250mg | Capsule | 6.285 | 6.5 | 6.575 | 6.5 | |||
| Benzyl Penicillin | 5 lac units/vial | Injection | 6.365 | 6.36 | 11.29 | 8.76 | |||
| Cloxacillin | 500mg | Capsule | 5.5 | 5.355 | 5.8 | 5.92 | |||
| Amoxiclav (Amoxicillin + Clavulanic acid) | 250mg+ 125mg | Tablet | 20.22 | 16.25 | 16.57 | 20 | |||
| Erythromycin | 250mg | Tablet | 4.5 | 4.35 | 4.75 | 4.82 | |||
| Chloramphenicol | 250mg | Capsule | 2.5 | 2.35 | 2.5 | 2.5 | |||
| Doxycycline | 100mg | Capsule | 2 | 2 | 2.03 | 2.06 | |||
| Co-Trimoxazole (Trimethoprim + Sulfamethoxazole) | 800mg + 160mg | Tablet | 2 | 2 | 2.02 | 2.01 | |||
| Metronidazole | 400mg | Tablet | 1.01 | 1.01 | 1.13 | 1.14 | |||
| Tetracycline | 250mg | Capsule | 1.01 | 1 | 1.1 | 1.3 | |||
| Nalidixic Acid | 500mg | Tablet | 3.85 | 3.87 | 4.87 | 4.03 | |||
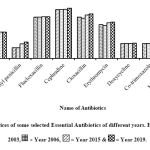 |
Figure 1: Prices of some selected Essential Antibiotics of different years. Here, =Year 2003, = Year 2006, = Year 2015 & = Year 2019. |
Figure 1 showed that the Median unit price of Amoxicillin Capsule (250 mg) was Tk. 3.29 in 2003, 3.02 in 2006, 3.54 in 2015 and 3.51in 2019, respectively; that of Phenoxymethyl Penicillin Tablet (250 mg) was Tk. 1.47 in 2003, 1.46 in 2006, 1.98 in 2015 and 2.2 in 2019, respectively; that of Flucloxacillin Capsule (250 mg) was Tk. 5.5 in 2003, 5.5 in 2006, 5.52 in 2015 and 5.52 in 2019, respectively; that of Cephradine Capsule (250 mg) was Tk. 6.5 in 2003, 6.5 in 2006, 6.52 in 2015 and 6.65 in 2019, respectively; that of Cloxacillin Capsule (500 mg) was Tk. 5.5 in 2003, 5.35 in 2006, 5.8 in 2015 and 5.92 in 2019, respectively; that of Erythromycin Tablet (250 mg) Tk. 4.5 in 2003, 4.35 in 2006, 4.75 in 2015 and 4.82 in 2019, respectively; that of Doxycycline Capsule (100 mg) was Tk. 2.00 in 2003, 2.00 in 2006, 2.03 in 2015 and 2.06 in 2019, respectively; that of Co-trimoxazole Tablet (800mg+160 mg) was Tk. 2.00 in 2003, 2 in 2006, 2.02 in 2015 and 2.00 in 2019, respectively; that of Metronidazole Tablet (400 mg) Tk. 1.01 in 2003, 1.01 in 2006, 1.13 in 2015 and 1.14 in 2019, respectively.
Table 3: Statistical hypothesis testing
| Paired t- test | Year 2003 vs Year 2006 | Year 2003 vs Year 2015 | Year 2003 vs Year 2019 | Year 2006 vs Year 2015 | Year 2006 vs Year 2019 | Year 2015 vs Year 2019 |
| p-value | Can’t reject Null;
p value= 0.325> α=0.05 |
Can’t reject Null;
P value=0.168> α=.05 |
Might reject Null;
p-value =0.02< α=0.05 |
Might reject null;
p value =0.032< α=0.05 |
Might reject
Null; p value=0.007< α=0.05 |
Can’t reject null
p value=0.510> α=0.05 |
| Result | Price difference not statistically significant | Price difference not statistically significant | Significant Price difference exist | Significant Price difference exist | Significant Price difference exist | Price difference not statistically significant |
The Null Hypothesis (H0) showed that there is no significant difference between the mean of two year’s medicine price (i.e., population mean are same) and the alternative hypothesis (H1) showed that there is significant difference between the mean of two year’s medicine price (i.e., population mean are not equal), at 95% confidence level with α=0.05.
Comparison between year 2003 and 2006
Medicines prices from year 2003 to 2006 were not changed much. Median prices of maximum medicine decreased in 2006 compared to year 2003. This difference of prices between year 2003 and year 2006 was not statistically significant (p value = 0.325).
Comparison between year 2003 and 2015
Median prices of maximum medicine increased in 2015 moderately compared to year 2003. This difference of prices between year 2003 and year 2015 was not statistically significant (p value = 0.168).
Comparison between year 2003 and 2019
Median prices of selected medicines increased in 2019 much compared to year 2003. This difference of prices between year 2003 and year 2019 was statistically significant (p value = 0.020).
Comparison between year 2006 and 2015
Median prices of selected medicines increased in 2015 much compared to year 2006. This difference of prices between year 2003 and year 2015 was statistically significant (p value = 0.032).
Comparison between year 2006 and 2019
Median prices of selected medicines increased in 2019 greatly compared to year 2006. This difference of prices between year 2003 and year 2019 was statistically significant (p value = 0.007).
Comparison between year 2015 and 2019
Median prices of selected medicines increased in 2019 greatly compared to year 2015. This difference of prices between year 2015 and year 2019 was not statistically significant (p value = 0.510).
Table 4: Price variation of essential antibiotics given in percentage across years.
| Medicine | Strength | Dosage
form |
Standard
Price Year 2003 |
Price increased Or decreased in Percentage | ||
| Year 2006
|
Year 2015 | Year 2019 | ||||
| Amoxycillin | 250mg | Capsule | 3.295 | -8.34%(3.02) | 7.43% (3.54) | 6.52%(3.51) |
| Ampicillin | 250mg | Capsule | 2.515 | -0.6%(2.5) | 29.2%(3.25) | 29.2%(3.25) |
| Phenoxymethyl penicillin | 250mg | Tablet | 1.47 | 0%(1.47) | 35%(1.985) | 49.6%(2.2) |
| Benzathine Penicillin | 12 lac units/vial | Injection | 23.56 | -1.8%(23.12) | 6%(24.98) | 2.7%(24.21) |
| Flucloxacillin | 250mg | Capsule | 5.5 | 0%(5.5) | 0.36%(5.52) | 0.36%(5.52) |
| Procaine Penicillin | 4 lac units/vial | Injection | 6.815 | 11.5%(7.6) | 106%(14.05) | 46.7%(10) |
| Cephradine | 250mg | Capsule | 6.5 | 0%(6.5) | 0.38%(6.525) | 2.3%(6.65) |
| Cephalexin | 250mg | Capsule | 6.285 | 3.4%(6.5) | 4.6%(6.575) | 3.4%(6.5) |
| Benzyl Penicillin | 5 lac units/vial |
Injection |
6.365 | 0%(6.365) | 77%(11.29) | 37.7%(8.765) |
| Cloxacillin | 500mg | Capsule | 5.5 | -2.6%(5.355) | 5.4%(5.8) | 7.6%(5.92) |
| Amoxiclav | 250mg | Tablet | 20.22 | -19.6%(16.2) | -18%(16.57) | -1%(20) |
| Erythromycin | 250mg | Tablet | 4.5 | -3.3%(4.35) | 5.5%(4.75) | 7.2%(4.825) |
| Chloramphenicol | 250mg | Capsule | 2.5 | -6%(2.35) | 0%(2.5) | 0%(2.5) |
| Doxycycline | 100mg | Capsule | 2 | 0%(2) | 1.5%(2.03) | 3%(2.06) |
| Co-Trimoxazole | 800mg + 160mg | Tablet | 2 | 0%(2) | 1%(2.02) | 0.25%(2.01) |
| Metronidazole | 400mg | Tablet | 1.01 | 0%(1.01) | 11.8%(1.13) | 12.8%(1.14) |
| Tetracycline | 250mg | Capsule | 1.01 | -0.9%(1) | 8.9%(1.1) | 28.7%(1.3) |
| Nalidixic Acid | 500mg | Tablet | 3.855 | 0.39%(3.87) | 26%(4.87) | 4.5%(4.03) |
A graph was drawn using selected antibiotics showed a great deviation in price over years (Figure 2(a), 2(b)).
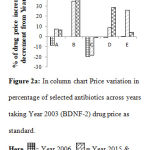 |
Figure 2a: In column chart Price variation in percentage of selected antibiotics across years taking Year 2003 (BDNF-2) drug price as standard. |
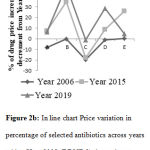 |
Figure 2b: In line chart Price variation in percentage of selected antibiotics across years taking Year 2003 (BDNF-2) drug price as standard. |
A=Amoxicillin Cap 250 mg B=Phenoxymethyl Penicillin Tab 250mg C=Amoxiclav Tab 250 mg D=Tetracycline Cap 250 mg E=Nalidixic Acid Tab 500 mg.
Figure 2a showed that the Median unit price of Amoxicillin Capsule (250 mg) decreased 8.34% from 2003 to 2006, increased 7.43% from 2003 to 2015, and 6.52% from 2001 to 2019; that of Phenoxymethyl Penicillin Tab (250 mg) increased 0% from 2003 to 2006, 35% from 2003 to 2015 and 49.6% from 2003 to 2019; that of Amoxiclav Tablet (250 mg) decreased 19.6% from 2003 to 2006, 18% from 2003 to 2015 and 1% from 2001 to 2019; that of Tetracycline Capsule (250 mg) decreased 0.9% from 2003 to 2006, 8.9% from 2003 to 2015and 28.7% from 2003 to 2019; that of Nalidixic Acid Tablet (500 mg) increased 0.389% from 2003 to 2006, 26% from 2003 to 2015 and 4.5% from 2003 to 2019, respectively.
A plot was drawn using selected antibiotics showed a great deviation in price over years (Figure 3(a), 3(b)).
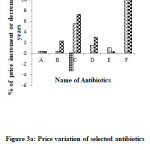 |
Figure 3a: Price variation of selected antibiotics across years from year 2003. Drug price of year 2003 was taken as standard. |
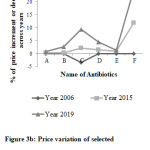 |
Figure 3b: Price variation of selected antibiotics across years from year 2003. Drug price of year 2003 was taken as standard. |
A= Flucloxacillin capsule 250mg B = cephradine capsule 250mg C= Erythromycin Tablet 250mg D= Doxycycline Capsule 250mg E= Co-trimoxazole tablet 800mg + 160mg F= Metronidazole Tablet 400mg.Here, = Year 2006, = Year 2015 & = Year 2019.
Figure 3a showed that the Median unit price of Flucloxacillin Capsule 250 mg increased 0% from 2003 to 2006, increased 0.36% from 2003 to 2015 and 0.36% from 2001 to 2019; that of Cephradine Capsule 250 mg increased 0 % from 2003 to 2006, 0.38% from 2003 to 2015 and 2.3% from 2003 to 2019 ; that of Erythromycin Tablet 250 mg decreased 3.3% from 2003 to 2006, 5.5% from 2003 to 2015 and 7.2% from 2001 to 2019; that of Doxycycline Capsule 250 mg increased 0% from 2003 to 2006, 1.5% from 2003 to 2015 and 3% from 2003 to 2019; that of Co-trimoxazole Tablet 800 mg+160 mg increased 0% from 2003 to 2006, 1% from 2003 to 2015 and 0.25% from 2003 to 2019; that of Metronidazole Tablet 400 mg increased 0% from 2003 to 2006, 11.8% from 2003 to 2015 and 12.8% from 2003 to 2019, respectively.
Median Price Ratio (MPR)
Median Price Ratio (MPR) of medicines was calculated to observe how many times greater or lesser the price of local medicines to international reference unit prices. The formula for calculating MPR is given below –
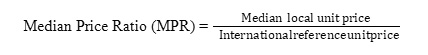
The medicine prices of year 2015 and 2019 were converted to US Dollar using the exchange rate on 30.06.2015 ($1 USD = 77.83 Bangladeshi Taka) and 28.01.2019 ($1 USD= 83.4643 BDT), respectively. The international prices of 2015 were used as reference unit prices.
Table 5: Median Price Ratio (MPR) of surveyed essential antibiotics.
| Medicines | Strength
|
Dosages form
|
Median international reference unit price(USD) | Median local unit price (USD) | Median price ratio(MRP) | ||||
| 2015 | 2019 | 2015 | 2019 | ||||||
| Amoxicillin | 250mg | Capsule | 0.0227 | 0.0455 | 0.042 | 2.00 | 1.85 | ||
| Ampicillin | 250mg | Capsule | 0.0163(S) | 0.0417 | 0.039 | 2.56 | 2.39 | ||
| Phenoxymethyl penicillin | 250mg | Tablet | 0.0388 | 0.0255 | 0.026 | 0.66 | 0.67 | ||
| Benzathine Penicillin | 12 lac units/vial | Injection | 0.1809 | 0.321 | 0.29 | 1.77 | 1.6 | ||
| Flucloxacillin | 250mg | Capsule | 0.0403 | 0.0709 | 0.066 | 1.76 | 1.64 | ||
| Procaine Penicillin | 4 lac units/vial | Injection | 0.2951 | 0.1806 | 0.119 | 0.61 | 0.40 | ||
| Cephradine | 250mg | Capsule | 0.08383 | 0.079 | |||||
| Cephalexin | 250mg | Capsule | 0.0475 | 0.08453 | 0.078 | 1.78 | 1.64 | ||
| Benzyl Penicillin | 5 lac units/vial | Injection | 0.1224 | 0.1451 | 0.105 | 1.18 | 0.86 | ||
| Cloxacillin | 500mg | Capsule | 0.0566 | 0.0745 | 0.071 | 1.32 | 1.25 | ||
| Amoxiclav (Amoxicillin + Clavulanic acid) | 250mg + 125mg | Tablet | 0.1476 (S) | 0.2130 | 0.239 | 1.44 | 1.62 | ||
| Erythromycin | 250mg | Tablet | 0.045 | 0.0610 | 0.058 | 1.35 | 1.28 | ||
| Chloramphenicol | 250mg | Capsule | 0.09 | 0.0321 | 0.03 | 0.36 | 0.33 | ||
| Doxycycline | 100mg | Capsule | 0.0192 | 0.0261 | 0.025 | 1.36 | 1.30 | ||
| Co-Trimoxazole (Trimethoprim + Sulfamethoxazole) | 800mg + 160mg | Tablet | 0.0314 | 0.0259 | 0.024 | 0.82 | 0.76 | ||
| Metronidazole | 400mg | Tablet | 0.0157 | 0.0145 | 0.0136 | 0.92 | 0.83 | ||
| Tetracycline | 250mg | Capsule | 0.0222 | 0.0141 | 0.016 | 0.63 | 0.67 | ||
| Nalidixic Acid | 500mg | Tablet | 0.0435 | 0.0626 | 0.048 | 1.44 | 1.1 | ||
⃰⃰ S= Supplier price [As Buyer price not found]
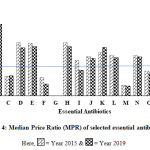 |
Figure 4: Median Price Ratio (MPR) of selected essential antibiotics. |
A=Amoxycillin B=Ampicillin C=Phenoxymethyl Penicillin D=Benzathine Penicillin E= FlucloxacillinF= Procaine Penicillin G=Cephradine H=Cephalexin I=Benzyl Penicillin J= Cloxacillin K=Amoxiclav L=Erythromycin M= Chloramphenicol N=Doxycycline O=Co-Trimoxazole P= Metronidazole Q=Tetracycline R=Nalidixic Acid.
Figure 4 showed that the Median Price Ratio (MPR) of Amoxicillin was 2.00 and 1.85 in 2015 and 2019, respectively; that of Ampicillin was 2.56 and 2.39 in 2015 and 2019, respectively; that of Phenoxymethyl Penicillin was 0.66 and 0.67 in 2015 and 2019, respectively; that of Benzathine Penicillin was 1.77 and 1.6 in 2015 and 2019, respectively; that of Flucloxacillin was 1.76 and 1.64 in 2015 and 2019, respectively; that of Procaine Penicillin was 0.61 and 0.4 in 2015 and 2019, respectively; that of Cephradine was not found; that of Cephalexin was 1.78 and 1.64 in 2015 and 2019, respectively; that of Benzyl Penicillin was 1.2 and 0.86 in 2015 and 2019, respectively; that of Cloxacillin was 1.32 and 1.25 in 2015 and 2019, respectively; that of Amoxiclav was 1.44 and 1.62 in 2015 and 2019, respectively; that of Erythromycin was 1.36 and 1.28 in 2015 and 2019, respectively; that of Chloramphenicol was 0.36 and 0.33 in 2015 and 2019, respectively; that of Doxycycline was 1.36 and 1.3 in 2015 and 2019, respectively; that of Co-Trimoxazole was 0.82 and 0.76 in 2015 and 2019, respectively; that of Metronidazole was 0.93 and 0.83 in 2015 and 2019, respectively; that of Tetracycline was 0.64 and 0.67 in 2015 and 2019, respectively; that of Nalidixic Acid was 1.44 and 1.1 in 2015 and 2019, respectively.
Availability of medicines
For assessing medicine availability, manufacturers of each medicine were counted. This gave the national availability of the medicines. By collecting data from different retail pharmacies, availability of medicines at regional level was determined. It is important to mention that the availability given in the results refers to all eighteen examined essential antibiotics. Only that antibiotics were seen at the time of data collection were termed as available.
Table 6: Availability and Market growth of essential antibiotics.
| Medicines | Dosages Form | No. of manufacturers in different year | ||||
| 2001 | 2003 | 2006 | 2015 | 2019 | ||
| Amoxicillin | Capsule/Dry Syrup /Injection | 10 | 75 | 70 | 45 | 69 |
| Ampicillin | Capsule/Dry Syrup /Injection | 10 | 11 | 9 | 6 | 6 |
| Phenoxymethyl
Penicillin |
Tablet/Syrup | 10 | 15 | 17 | 10 | 16 |
| Benzathine penicillin | Injection | 7 | 4 | 5 | 2 | 6 |
| Flucloxacillin | Capsule/Syrup/Injection | 10 | 46 | 57 | 49 | 70 |
| Procaine penicillin | Injection | 4 | 2 | 3 | 3 | 4 |
| Cephradine | Capsule/Syrup/Injection | 10 | 54 | 58 | 57 | 79 |
| Cefalexin | Capsule/Tablet/Syrup | 11 | 39 | 30 | 8 | 20 |
| Benzyl penicillin | Injection | 3 | 3 | 2 | 1 | 4 |
| Cloxacillin | Capsule/Syrup/Injection | 10 | 30 | 26 | 14 | 16 |
| Amoxiclav (Amoxicillin + Clavulanic acid) | Tablet/Capsules/ Dry Syrup/Injection | 8 | 4 | 4 | 8 | 14 |
| Erythromycin | Tablet/Oral Suspension /Injection | 10 | 27 | 40 | 40 | 50 |
| Chloramphenicol | Eye/Ear Drops/Ointment | 4 | 5 | 4 | 21 | 25 |
| Doxycycline | Capsule | 10 | 47 | 46 | 25 | 40 |
| Co-trimoxazole (Trimethoprim + Sulfamethoxazole) | Tablet/Suspension | 9 | 69 | 60 | 33 | 32 |
| Metronidazole | Tablet/Oral Liquid/Injection | 11 | 77 | 70 | 44 | 80 |
| Tetracycline | Capsule/Injection | 10 | 37 | 34 | 14 | 26 |
| Nalidixic acid | Tablet/Syrup | 10 | 12 | 11 | 4 | 9 |
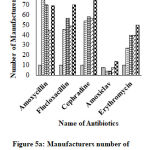 |
Figure 5a: Manufacturers number of selected essential antibiotics across years. |
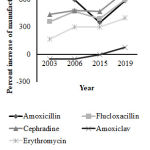 |
Figure 5b: Percent increase of manufacturers across years |
Figure 5a showed that the number of manufacturers of Amoxicillin was 10 in 2001, 75 in 2003, 70 in 2006, 45 in 2015 and 69 in 2019; that of Flucloxacillin was 10 in 2001, 46 in 2003, 57 in 2006, 49 in 2015 and 70 in 2019; that of Cephradine was 10 in 2001, 54 in 2003, 58 in 2006, 57 in 2015 and 79 in 2019; that of Amoxiclav was 8 in 2001, 4 in 2003, 4 in 2006, 8 in 2015 and 14 in 2019; that of Erythromycin was 10 in 2001, 27 in 2003, 40 in 2006, 40 in 2015 and 50 in 2019, respectively.Here, =Year 2001, =Year 2003, = Year 2006, = Year 2015 & = Year 2019.
Figure 5b showed that the number of manufacturers of Amoxicillin increased 650% from 2001 to 2003, 600% from 2001 to 2006, 350% from 2001 to 2015 and 590% from 2001 to 2019; that of Flucloxacillin increased 360% from 2001 to 2003, 470% from 2001 to 2006, 390% from 2001 to 2015 and 600% from 2001 to 2019; that of Cephradine increased 440% from 2001 to 2003, 480% from 2001 to 2006, 470% from 2001 to 2015 and 690% from 2001 to 2019; that of Amoxiclav decreased 50% from 2001 to 2003, 50% from 2001 to 2006, increased 0% from 2001 to 2015 and 75% from 2001 to 2019; that of Erythromycin increased 170% from 2001 to 2003, 300% from 2001 to 2006, 300% from 2001 to 2015 and 400% from 2001 to 2019, respectively.
A total of 25 retail pharmacies were inspected to gather information about the described medicines. Availability of a medicine was ensured when one outlet had the medicine of any dose and dosage form on the time of data collection. However, data were collected from different types of retail pharmacies- large, small; medicine shop, model pharmacy; medicine stores located near the both government and non-government hospitals. The retail shops were located in different regions of the Dhaka Metropolitan City. In inspected retail shops, the essential antibiotics were poorly available in general medicine stores as compared to the Model pharmacies. So availability is higher in Model pharmacies than General medicine stores.
Table 7: Availability of generic equivalent medicines in retail pharmacies.
| Medicine | Dosages Form | Availability in percentage (%) | |
| Model Pharmacy(n=10) | General medicine store(n=15) | ||
| Amoxicillin | Capsule/Dry Syrup /Injection | 100% | 93.33% |
| Ampicillin | Capsule/Dry Syrup /Injection | 70% | 26.66% |
| Phenoxymethyl
Penicillin |
Tablet/Syrup | 90% | 53.33% |
| Benzythine penicillin | Injection | 80% | 33.33% |
| Flucloxacillin | Capsule/Syrup/Injection | 100% | 86.66% |
| Procaine penicillin | Injection | 20% | 0% |
| Cephradine | Capsule/Syrup/Injection | 100% | 80% |
| Cephalexin | Capsule/Tablet/Syrup | 60% | 6.66% |
| Benzyl penicillin | Injection | 30% | 6.66% |
| Cloxacillin | Capsule/Syrup/Injection | 90% | 26.66% |
| Amoxiclav (Amoxicillin + Clavulanic acid) | Tablet/Capsules/ Dry Syrup/Injection | 100% | 86.66% |
| Erythromycin | Tablet/Oral Suspension /Injection | 100% | 66.66% |
| Chloramphenicol | Eye/Ear Drops/Ointment | 70% | 40% |
| Doxycycline | Capsule | 90% | 66.66% |
| Co-trimoxazole (Amoxicillin + Clavulanic acid) | Tablet/Suspension | 100% | 46.66% |
| Metronidazole | Tablet/Oral Liquid/Injection | 100% | 86.66% |
| Tetracycline | Capsule/Injection | 100% | 46.66% |
| Nalidixic acid | Tablet/Syrup | 50% | 33.33% |
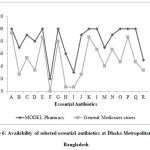 |
Figure 6: Availability of selected essential antibiotics at Dhaka Metropolitan city in Bangladesh. |
A=Amoxicillin B=Ampicillin C=Phenoxymethyl Penicillin D=Benzathine Penicillin E= Flucloxacillin F= Procaine Penicillin G=Cephradine H=Cephalexin I=Benzyl Penicillin J=Cloxacillin K=Amoxiclav L=Erythromycin M= Chloramphenicol N=Doxycycline O=Co-Trimoxazole P= Metronidazole Q=Tetracycline R=Nalidixic Acid.
Figure 6 showed that the availability of Amoxicillin was 100% and 93.3% in Model pharmacies and General medicine stores respectively; that of Ampicillin was 70% and 26% in Model pharmacies and General medicine stores respectively; that of Phenoxymethyl Penicillin was 90% and 53% in Model pharmacies and General medicine stores respectively; that of Benzathine Penicillin was 80% and 33.3% in Model pharmacies and General medicine stores respectively; that of Flucloxacillin was 100% and 86% in Model pharmacies and General medicine stores respectively; that of Procaine Penicillin was 20% and 0% in Model pharmacies and General medicine stores respectively; that of Cephradine was 100% and 80% in Model pharmacies and General medicine stores, respectively ; that of Cephalexin was 60% and 7% in Model pharmacies and General medicine stores, respectively; that of Benzyl Penicillin was 30% and 7% in Model pharmacies and General medicine stores, respectively; that of Cloxacillin was 90% and 26% in Model pharmacies and General medicine stores, respectively; that of Amoxiclav was 100% and 86% in Model pharmacies and General medicine stores, respectively; that of Erythromycin was 100% and 66% in Model pharmacies and General medicine stores respectively; that of Chloramphenicol was 70% and 40% in Model pharmacies and General medicine stores, respectively; that of Doxycycline was 90% and 66% in Model pharmacies and General medicine stores, respectively; that of Co-Trimoxazole was 100% and 46% in Model pharmacies and General medicine stores respectively; that of Metronidazole was 100% and 86% in Model pharmacies and General medicine stores, respectively; that of Tetracycline was 100% and 46% in Model pharmacies and General medicine stores, respectively; that of Nalidixic Acid was 50% and 33.3% in Model pharmacies and General medicine stores, respectively.
Affordability of medicine
Medicine affordability was estimated by calculating the expenses of standard treatment to complete a full course (Shown in Table 7). The prices of medicines of 2019 were considered. The government of Bangladesh, on September 13, 2018 announced Tk. 8000 BDT as the minimum salary for Garment worker. The lowest monthly wage of unskilled people was considered as 8000 BDT . The economic condition of Bangladesh is also growing healthy. The per capita national income is also increasing every year. So the medicines are also becoming more affordable. The following table gives some idea about health and economic status of Bangladesh.
Table 8: Prices per regimens of treatment with different essential antibiotics
| Medicine | Strength | Course of treatment | No. of units per treatment | Median price per
tab/vial |
Price per course of
treatment |
Number of days’ wages
|
| Amoxicillin | Cap 250mg | 6 Cap/day, 7 days | 42 | 3.51 | 147.42 | 0.553 |
| Ampicillin | Cap 250mg | 6 Cap/day,7 days | 42 | 3.25 | 136.5 | 0.512 |
| Phenoxymethyl-penicillin | Tab 250mg | 8 tab/day, 7 days | 56 | 2.2 | 123.2 | 0.462 |
| Benzathine penicillin | Inj12 lac unit/vial | 2 Inj/week,3 weeks | 6 | 24.21 | 145.26 | 0.545 |
| Flucloxacillin | Cap 250mg | 6 Cap/day, 7 days | 42 | 5.52 | 231.84 | 0.87 |
| Procaine penicillin | Inj4 lac unit/vial | 2vial/day, 10 days | 20 | 10 | 200 | 0.75 |
| Cephradine | Cap 250mg | 8 Cap/day, 7 days | 56 | 6.65 | 372.4 | 1.4 |
| Cephalexin | Cap 250mg | 8 Cap/day, 7 days | 56 | 6.5 | 364 | 1.36 |
| Benzyl penicillin | Inj 5lac unit/vial | 4 vial/day, 5 days | 20 | 8.765 | 175.3 | 0.66 |
| Cloxacillin | Cap 500mg | 4 cap/day, 7 days | 28 | 5.92 | 165.76 | 0.6216 |
| Amoxiclav (Amoxicillin + Clavulanic acid) | Tab 250mg+125mg | 6 tab/day, 7 days | 42 | 20 | 840 | 3.15 |
| Erythromycin | Tab 250mg | 8 tab/day, 7 days | 56 | 4.825 | 270.2 | 1.01 |
| Chloramphenicol | Cap 250mg | 8 Cap/days,5 days | 40 | 2.5 | 100 | 0.4 |
| Doxycycline | Cap 100mg | 2 Cap/day,7 days | 14 | 2.06 | 28.84 | 0.11 |
| Co-trimoxazole (Trimethoprim + Sulfamethoxazole) | Tab 800mg+160mg | 2 Cap/day,7 days | 14 | 2.005 | 28.07 | 0.105 |
| Metronidazole | Tab 400mg | 4 cap/day, 7 days | 28 | 1.14 | 31.92 | 0.12 |
| Tetracycline | Cap 250mg | 8 Cap/day, 7 days | 56 | 1.3 | 72.8 | 0.273 |
| Nalidixic acid | Tab 500mg | 8 Cap/day, 7 days | 56 | 4.03 | 225.68 | 0.8463 |
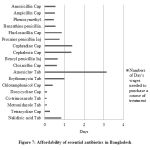 |
Figure 7: Affordability of essential antibiotics in Bangladesh. |
The number of day’s salaries necessary to buy a course of treatment (shown in Table 8) was estimated from the daily wages of the lowest-paid unskilled laborer (266.67 BDT).
Discussion
In visited retail shops, the essential antibiotics were less available in general medicine stores as compared to the Model pharmacies. A comparative study on prices variation across years had shown a moderate increase in price. The median prices of surveyed antibiotics were obtained and a gross comparison was done that indicated % increase or decrease in price. In the study, the median price ratios of surveyed antibiotics ranged from 0.36-2.56 and 0.33-2.39 in Year 2015 and 2019, respectively. While observing the WHO target that patients should pay no more than four times the IRPs, we found that medicine prices were lower in the Bangladesh compared to IRPs. A medicine price survey in Bahrain during 2013 utilizing the WHO/HAI method, exhibited that patients were paying 34.78 and 13.85 times IRPs for innovator brands and lowest paid generics, respectively 1. Patients were paying 13.05 and 4.12 times IRPs for innovator brands and lowest paid generics, respectively during 2011 at Tatarstan Province of Russia. While patients were paying 61.44 and 17.33 times IRPs for innovator brands and lowest paid generics, respectively13, in a Caribbean country in 2010. Our findings gave the idea that the essential antibiotics were affordable in Bangladesh.
Conclusions
Medicine prices are not much higher than international reference prices. In comparison to the WHO target, medicine prices were considerably lower in the Bangladesh. We also observed a wide variation in terms of the MPR results for different antibiotics in our work. The prices for medicines included were near to WHO’s target. The essential antibiotics were affordable. These data exhibit that the antibiotics targeted by the study have a high variation in prices. The reason for this variation may be due to fewer generics on the market and therefore they have a widespread availability in the first level health facilities, which may result in decreased prices relative to the international reference. Some treatments are affordable for families on a low income. This is especially true for essential medicine used in the treatment of different diseases. The numbers of manufacturers for several medicines have increased in a very rapid speed. Mostly used antibiotics manufacturers are increasing from the last consecutive years.
Based on the findings of the study, it is inferred that – (i) Investigating the availability of medicines in government hospitals and examining models that are able to provide good prices and availability at their hospital, (ii) Establishing a price regulation mechanism for essential medicines, (iii) Medicine price monitoring should be performed at regular interval. To more precisely control price and availability trends, prices must be monitored regularly and have the results made widely available, (iv) There are several medicines which are manufactured by only a few companies. As a result, the prices of those medicines remain very high in comparison to international reference prices. The government should be aware that essential medicines are manufactured by almost all company, (v) There should be a database for the prices of medicines of previous years so that one can easily compare the price changes among years. This database should be available for mass people.
Acknowledgement
We express our gratitude to the authority of Directorate General of Drug Administration (DGDA).
Conflict of Interest
None
Funding source
This work was conducted by self-funding contributed by all authors except Md. Monirul Islam and Sauda Sumaya Dina.
References
- Sharma, A., Rorden, L., Ewen, M., & Laing, R. (2016). Evaluating availability and price of essential medicines in Boston area (Massachusetts, USA) using WHO/HAI methodology. Journal of pharmaceutical policy and practice, 9(1), 12.
- WHO 2008 Measuring medicine prices, availability, affordability and price components 2nd Edition. Geneva: World Health Organization and Health Action International; 2008. http://www.who.int/medicines/areas/access/OMS_Medicine_prices.pdf. Accessed 5 January 2019.
- Cameron, A., Ewen, M., Ross-Degnan, D., Ball, D., & Laing, R. (2009). Medicine prices, availability, and affordability in 36 developing and middle-income countries: a secondary analysis. The lancet, 373(9659), 240-249.
- Management Sciences for Health 2015. Price of International Reference Medicines. Website: http://mshpriceguide.org /en/home/. Accessed: 21 November, 2019.
- National Drug Policy (2016) Directorate General of Drug Administration (DGDA), Ministry of Health & Family Welfare, Government of the People’s Republic of Bangladesh.
- Manufacturers of allopathic medicines. Website: http://www.dgda.gov.bd/index.php/manufacturers/allopathic. Accessed: 12 January, 2019.
- Bangladesh National Formulary (BDNF) 4. Directorate General of Drug Administration, Bangladesh Medical Association, Bangladesh Pharmaceutical Society, 2015.
- Minimum wage for apparel workers set at Tk8000. https://www.dhakatribune.com/business/regulations/2018/09/13/tk8-000-set-as-minimum-wage-for-rmg-workers. (10 October, 2018)
- Exchange Rate USD to BDT. https://www.exchange-rates.org/Rate/USD/BDT/6-30-2015. (15 March, 2018)
- Bangladesh National Formulary (BDNF) 1. Directorate of Drug Administration, Bangladesh Medical Association, Bangladesh Pharmaceutical Society, 2001.
- Bangladesh National Formulary (BDNF) 2. Directorate of Drug Administration, Bangladesh Medical Association, Bangladesh Pharmaceutical Society, 2003.
- Bangladesh National Formulary (BDNF) 3. Directorate of Drug Administration, Bangladesh Medical Association, Bangladesh Pharmaceutical Society, 2006.
- Poltavets, D., & Konovalova, L. (2011). Medicine prices, availability, affordability & price components. https://haiweb.org/wp-content/uploads/2015/07/Ukraine-Summary-Report-Palliative-Care-Pricing-Surveys.pdf. (24 March, 2018).

